
Healthy growth:
Why there’s more to the pharma sector than weight-loss
drugs


Plus: Nvidia vs Google What next as AI race hots up?

Money & Markets podcast
Weekly discussions on everything investing from the teams at AJ Bell and Shares magazine, all available on your favourite streaming platforms.
The easy way to stay up to speed with the investing world with new episodes each week from Dan Coatsworth, Laura Suter, Charlene Young, Laith Khalaf and Danni Hewson.
LISTEN NOW
The
INCOME INVESTING
Different ways investments generate income for you
Festive trading: what to expect from Next, Tesco and more
UNDER THE BONNET
Nvidia vs Google: what next as AI race hots up? 14 RETIREMENT
IN FOCUS
Approaching or in retirement; here’s your Budget breakdown
How do I find funds which go against the herd? 18
Revealed: a great way to find stocks at a discount
Portfolio MOT: how to keep your investments ticking over
The how and why of investing in the pharmaceutical sector
What should I do with my first bonus: treat myself, save it or invest it? 34 FUNDS
Can Indian stocks start firing again after pause for breath? 36 ASK RUSS
What is the Shiller PE and can it reveal if we’re in a bubble?
Why bonds matter to all investors
What will happen to my pension if I move abroad?


magazine is published by AJ Bell, authorised and regulated by the Financial Conduct Authority. It’s here to inform, not to give personal advice. Please don’t base your investment decisions on it alone. If you’re unsure, speak to an independent adviser. And remember: past performance isn’t a guide to the future. Tax benefits depend on your circumstances and tax rules may

The best way to get the UK investing is education not Cash ISA cuts
The decision by the chancellor to cut the Cash ISA allowance for under-65s to £12,000 appears to have been driven, at least in part, by an aspiration to get the UK investing on a much larger scale.
AJ Bell is on record that the ISA needs to be simplified, rather than made more complex as will be the case as a result of this change. Elsewhere in the Budget the incentive to invest was actively undermined by increased dividend taxes with a decision to remove stamp duty on newly listed UK shares a welcome crumb of comfort but really no more than that.
According to Aberdeen’s Tell Sid report, released in 2025, only 8% of people’s personal wealth in the UK is in equities and funds. Compared with 33% in the US, 22% in Canada, 19% in Italy and 13% in France.
What’s actually required for people to become enthusiastic about putting their money to work in the markets is, to paraphrase Tony Blair, education, education, education.
Just like mastering a musical instrument or learning a language, getting to grips with finance and the markets when you’re still at school and your brain is more open and flexible, making it easier to grasp new concepts, is the best hope of bolstering the proportion of Britons who are happy to invest.
Never mind investing, managing finances at all was never covered as part of my own education and there’s been very little sign of that changing for my kids either, with my eldest just starting secondary school.
This leaves people entirely reliant on friends or family who have the right experience to pass on their knowledge. Which means, by definition, not everyone is being given an equal opportunity to take control of their financial destiny and tap into the wealth-generating potential of the financial markets.
With the best will in the world, actively investing in stocks and shares or even funds won’t suit every individual. However, the majority of us are going

Note: Based on Aberdeen analysis of data from individual countries’ financial accounts. Figures are the latest available data, released in 2023.
Source: Aberdeen, January 2025
to have at least some exposure to the markets as we look to build up a pot to cover our needs in retirement.
Another key point is that, without understanding the markets, people are much more likely to be burnt by being caught up in scams or unsuitable investments.
A review of the national curriculum announced in November 2025 has trailed the idea of giving greater prominence to financial education. This is quietly encouraging and it will be interesting to see the full details. Although we will have to wait until spring 2026 for this.
In the meantime, AJ Bell, including through the pages of this magazine, will continue to do what it can to provide insights into investing which, in turn, can help people become more confident about making the decisions required to make the most of their hard-earned cash.


Different ways investments generate income for you
Income investors seeking true diversification should consider more than just whether a fund invests in shares, bonds or other asset classes when making choices for a pension or ISA.
Different means of generating income
It’s important to look at how a fund generates an income stream for investors, as it isn’t always as straightforward as passing on dividends from investments inside its portfolio. Certain funds have extra tricks up their sleeve which widen the potential for income generation.
Method 1
The traditional route
The traditional model for an equity income fund –one that invests in stocks and shares – is to identify companies that pay generous dividends. The fund will collect the income paid out by the companies in its portfolio and distribute them to its investors, typically once every three or six months.
With these types of funds, a fund manager might look at stocks with above-average dividend yields and pick 50 or 100 of them to form their portfolio. They would consider factors such as a company’s financial strength, its cash flow, and its ability to sustain or even grow dividends from their current level.
It is common to see companies pay generous dividends when they haven’t got big demands on their cash flow elsewhere.
Source: AJ Bell
Heavily indebted companies might need cash flow to pay down borrowings. Certain companies
might need to keep spending on technology or new equipment, and so dividends might less of a priority.
For others, they might not need have huge investment demands to sustain their business and so they can hand more cash to shareholders in the form of dividends.

Method 2
Blending income and growth
Looking at the FTSE 100 index of UK companies, the top dividends yields are in sectors like life insurance and tobacco where earnings growth might be pedestrian. Such companies might enjoy steady cash generation and the act of paying a high yield helps to make their shares more attractive to investors.
Certain investors might also want an element of faster growing companies in their portfolio to add a different flavour. For example, you might have already retired but are healthy and want your pension to keep growing for years to come. Therefore, you might focus on both capital growth and income, and there are specific types of funds that have their fingers in both pies.
You can find investment trusts that offer blend both income and growth styles. These typically sit in the AIC’s global equity income sector and the largest is JPMorgan Global Growth & Income with £3.5 billion of assets.
A fund manager employing this kind of investment strategy will pull together a mix of most generous dividend payers with faster growing companies that might only pay a modest dividend,
or not one at all. The portfolio has two different engines, one designed to drive income and the other capital growth.
This approach typically gives the fund manager a bigger investment universe from which to pick opportunities than someone running a vanilla equity income fund.
You might expect a lower overall yield for such an approach, particularly if certain holdings only pay tiny dividends, yet this isn’t necessarily true.
The AIC global equity income sector yields 3.8% on average, yet JPMorgan Global Growth & Income has a 4% yield. It helps to fund this higher dividend through topping up the natural income from its underlying portfolio with profits it has made from selling investments at a higher price than originally paid.

Method 3
Keeping money back in reserve
Investment trusts can keep up to 15% of the income they receive from their holdings each year in reserve. This means they can top up dividend payments during lean years and provide a smoother stream of income for investors.
This is not an excuse for fund managers to invest in companies with potentially volatile earnings and dividends. Fund managers will still strive to find solid businesses that have the capacity to deliver sustainable dividends; the reserves function merely acts as a ‘just in case’ fallback in the event of any unforeseen setbacks such as the Covid pandemic when many firms cancelled or paused their payouts.
Method 4
Selling options to top up dividends
Enhanced income funds (also known as ‘income maximiser’ funds) have a way to boost their dividend power. They might generate a 4% or 5% yield from their underlying portfolio but often pay even more to investors.
They sell call options on stocks held in the portfolio to generate additional income. These options are contracts that give the buyer the right, but not the obligation, to buy the underlying asset at a specific price on or before a certain date.
For example, an investment bank buys an option on Company X from an enhanced income fund for a fee. This entitles the investment bank to any rise in the price of the underlying share above a certain level over a set period, typically three months. The enhanced income fund uses the option fee to top up its dividends, but in doing so it sacrifices part of the capital growth from the stock holding.
Enhanced income funds might underperform traditional equity income funds when markets are rising but potentially outperform in a falling market.
Call options can be difficult to understand and charges on enhanced income funds are often much higher than a traditional equity income fund. That means these types of funds won’t suit everyone.

Method 5
Property income
Property has long been a rich source of income, whether directly through buy to let ownership or using investment funds.
Property-focused investment trusts use tenants’ rent to fund shareholder payments. They can also make money from doing up properties and selling them, using capital gains to top up dividend payments to investors. Though it is worth noting they might prefer to redeploy capital into property acquisitions.

Other income-generating investments
Fixed income funds can pay a regular stream of cash to investors, funded from coupons paid by a portfolio of corporate or government bonds.
Multi-asset funds are a one-stop-shop for investors seeking instant diversification. They will hold a mixture of investments, typically incomepaying shares, bonds, and property assets.
Alternatively, investors can always sell chunks of their investments and use that money to generate an income – we will explore the pros and cons of this strategy in a future article.

By Dan Coatsworth Head of Markets


Festive trading: what to expect from Next, Tesco and more
December is a key trading period for UK retailers which can make or break the year. With the Budget not as damaging as some may have feared, companies are now in a position focus on the festive season.
Next is seen as a barometer for the UK retail sector due to its wide range of products and broad customer base.
Traditionally it is also the first large retailer to report on Christmas trading and therefore, eagerly watched by analysts for clues about
the performance of other high street and online retailers. It is scheduled to release a sales report on 6 January 2026.
Next looked to be in decent shape when it revealed full price sales up 10.5% in the 13 weeks to 25 October, prompting the company to raise full-year pre-tax profit guidance by around 3% to £1.14 billion.
Under CEO Simon Wolfson, Next has built a reputation of managing market expectations by underpromising and overdelivering.
Source: Stockopedia, LSEG
Key dates
Overseas stocks
Oracle (Q3) ☽ 15-Dec
Micron (Q1) ☽ 16-Dec
Nike (Q2) ☽ 18-Dec
FedEx (Q2) ☽ 18-Dec
Carnival (Q2) ☽ 19-Dec
Constellation Brands (Q3) ☽ 8-Jan
JPMorgan (Q4) ☼ 13-Jan
Bank of America (Q4) ☼ 14-Jan
Netflix (Q4) ☼ 15-Jan
UK Stocks
WH Smith (FY) 16-Dec
Currys (HY) 18-Dec
Next (TS) 6-Jan
Marks & Spencer (TS) 7-Jan
Tesco (TS) 8-Jan
Sainsbury's (TS) 9-Jan
Key economic announcements
US non-farm payrolls 16-Dec
UK inflation (CPI) 17-Dec
BoE interest rate decision 18-Dec
US inflation (CPI) 18-Dec
ECB interest rate decision 18-Dec
US inflation (Core PCE) 19-Dec
US non-farm payrolls 9-Jan
US inflation (CPI) 13-Jan
Key: Q=Quarter. HY= Half year.
FY=Full year. TS= Trading statement. ☽ = After market close.
☼ = Before market open.


Analysts have increased their annual EPS (earnings per share) forecasts up by around 6% since the start of 2025 suggesting the stock continues to perform better than expected.
Fellow retailer Marks & Spencer is scheduled to report on 7 January 2026 and investors will be looking for evidence that the turnaround under CEO Stuart Machin remains intact, notwithstanding interruption from the cyberattack earlier in 2025.
The food division at M&S has been a consistent performer, reporting 37 consecutive months of volume and value outperformance. Sales of Christmas party and premium lines will be scrutinised against the tougher economic backdrop.
Management has previously stated they expect the second half to be at least in line with the prior year, so investors will be looking to see if M&S reconfirms guidance in
early January.
The UK’s two biggest grocers, Tesco and Sainsbury’s are also expected to report on festive trading in the first week of 2026.
Grocery inflation slowed to 4.7% in the four weeks to 2 November, as promotions ramped up ahead of Christmas, official industry data showed.
Both supermarkets increased their market share with leader Tesco rising to 28.2% and Sainsbury’s increasing its share to 15.7% from 15.5%.
Sainsbury’s recently hiked its full year underlying pre-tax profit forecast to more than £1 billion from around £1 billion previously. Meanwhile Tesco raised its full year adjusted operating profit to a range of £2.9 billion to £3.1 billion from £2.7 billion to £3 billion.
These upgrades imply the grocers expect a strong trading period over Christmas.
Nvidia vs Google: what next as AI race hots up?

No investor, whether they want to or not, can really afford to ignore microchip giant Nvidia. While it may have shrunk a little of late, the world’s largest company remains so big that, as of 31 October 2025, it accounted for around 6% of the global MSCI World index all on its own.
This means nearly anyone with broad global exposure to the markets will likely have some stake in Nvidia’s future performance.
Its stratospheric rise coincided with the launch of OpenAI’s ChatGPT in November 2022. To put this in share price terms, in the three years leading up to that AI milestone the shares gained 212%. An impressive showing by any standard – but paling into insignificance when you consider that in the three years since they have gone up nearly 10-fold.
Yet, after reaching a valuation of more than $5 trillion for the first time, there are now growing signs of investor caution around the stock as competitive threats start to build. This article will look to cut through the noise and understand Nvidia’s strategy, market positioning and valuation.
What is behind Nvidia’s surge to prominence?
To understand why the company has been such a winner in the artificial intelligence space, we must
Key stats
Forecast PE 2027 23.8
Forecast dividend yield 2027 0.02%
January year end
Source: ShareScope
take a step back and look at its history.
Nvidia’s premium processors were initially used for graphics-heavy computer games, striking key licensing deals to place its chips in consoles like the Xbox and PlayStation. But the ability of Nvidia’s GPUs, or graphics processing units, to accelerate the speed of data processing have helped to put it at the forefront of the AI revolution.
Under CEO Jensen Huang the company has built on this head start and is now the market leader by a considerable distance – most estimates put its share at around 90%.
Its latest iteration of AI chip – Blackwell –launched in late 2024 and has been the subject of relentless demand, supporting extremely high margins and bumper cash generation.
Nvidia has stated that it expects demand for next generation chips to outstrip supply in 2025 and possibly through 2026, leading to a big backlog of
orders. This constraint is beyond its control and due to the highly complex supply chain.
Gross margins, or how much of its revenue is left if you subtract the costs of producing its chips, stand at more than 70% and the net margin, encompassing other operating costs, interest and taxes, is more than 50%.
What about regulatory and competitive threats?
Typically, when a company is as profitable as Nvidia either regulators intervene or competition emerges to get a slice of the action.
There have been hints of regulatory pushback from the authorities with an antitrust investigation launched in the US in 2024 and China commencing its own probe in September 2025.
External competition has been limited until relatively recently. However, the rave reviews for Google-owner Alphabet’s new Gemini 3 model and the company’s push on its custom TPU (tensor processing unit) AI chips, with reports Meta Platforms might be in talks over a multi-billiondollar deal to use them, have shaken investors in Nvidia.
Companies linked to Alphabet's AI push have started to outstrip OpenAI plays – including Nvidia
Mean average of performance not weighted by market valuation. OpenAI basket (Oracle, Advanced Micro Devices, Microsoft, Nvidia, Coreweave, SoftBank) Alphabet AI basket (Alphabet, Broadcom, Lumentum Holdings, Celestica, TTM Technologies)
Source: AJ Bell, LSEG
As the chart above demonstrates this has seen a divergence between stocks like Nvidia which are connected to OpenAI and its ChatGPT model and those like Broadcom with a stake in Alphabet’s own play in the artificial intelligence space.
Set against that, Nvidia is evolving into a broader platform rather than just being a hardware provider. Its CUDA software ecosystem and new ‘Nvidia Inference Microservices’ (NIMs) create high switching costs and could help protect its competitive position. It’s also the case that, for now, there’s plenty of demand to go around. If that were to change then the concerns about competition might carry increased weight.
What has recent performance been like?
Third-quarter numbers were impressive at the headline level. Amid strong demand for the company’s Blackwell chips, Nvidia’s revenue was up 62% year-on-year to $57 billion in the three months to the end of October – ahead of the $55 billion consensus estimate.
Net income was up 65% year-on-year to $31.9 billion, ahead of the forecast $30 billion. Data centre revenue – which essentially encompasses Nvidia’s sales of AI chips – was up 66% at $51.2 billion versus the $49 billion which had been pencilled in.

IS NVIDIA REALLY A ‘CHIPMAKER’
The label may be regularly applied to the company but like many of its peers Nvidia designs but does not actually make its own chips at scale – this activity is outsourced to the likes of TSMC, Intel and Samsung who operate the foundries which manufacture the physical chips themselves.

Sales forecasts for the fourth quarter also came in higher than anticipated with guidance of $65 billion materially higher than the $61.7 billion which analysts were expecting.
While the data centre arm is obviously the main story, other parts of the business also contributed. Revenue from its gaming business was up 30% to $4.3 billion, professional visualisation revenue, derived from supporting activities like video editing, 3D rendering and virtual reality, was up 56% to $760 million and its automotive and robotics operations saw revenues up 32% to $592 million.
Potential warning signs
As is often the case with a set of corporate results, the devil was in the detail and there were some items buried within the statement which might ring a few alarm bells.
Inventory and receivables are growing faster than sales on a year-on-year basis, which is a possible warning sign. Receivables relate to revenue which has potentially been booked by Nvidia but where payment has not yet been received.
Some analysts argue this is simply a consequence of having some extremely large customers, including the so-called hyperscaler cloud computing providers like Amazon and Microsoft, who have the buying power to negotiate longer

payment terms.
Nvidia has also flagged that ‘less capitalised’ companies could face difficulties securing financing for large-scale infrastructure projects. Accessing adequate power to run big data centres is also a big challenge, any setbacks in these areas could have a knock-on effect on demand for Nvidia’s chips.
The company has been investing in some of its customers – most notably with a commitment to put $100 billion into OpenAI. This has been characterised as ‘vendor financing’ in some quarters and has raised hackles among investors with long enough memories.
In the late 1990s Cisco and other internet equipment giants engaged heavily in what became characterised as vendor financing. These arrangements helped boost demand in the near term but exacerbated the crash that followed.
Does Nvidia trade on a lofty valuation?
The obvious implication of Nvidia’s unprecedented market value, $4.3 trillion at the last count, is that the shares must trade at a sky-high valuation. Actually, its price to earnings or PE ratio based on consensus forecast earnings per share for the next financial year (which ends in January 2027) is 24 times. This is significantly lower than many other businesses which have links to the AI theme.

AI stocks' valuations
Based on forecasts for next financial year
Source: SharesScope
The price to earnings growth ratio (calculated by dividing the PE by forecast earnings growth) is 0.4 times – anything under one is usually considered as representing value.
These metrics do reflect some demanding growth assumptions, so, in making a judgement on the valuation, you must consider if these assumptions are valid.
Morningstar chief investment and research officer Dan Kemp says: ‘There are two most likely outcomes on AI; either we’ll find we’ve been underestimating the commercial demand for it and people’s willingness to pay for AI models or we’ll find out that AI companies and providers have over committed to investing.”
Nvidia’s fortunes are likely to hinge on which of these outcomes emerges over the medium term. For their part, analysts remain confident in the story with LSEG data suggesting 23 have it as a ‘strong buy’, 35 as a ‘buy’, six as a ‘hold’ and just one as a ‘sell’.

By Tom Sieber Editor

Approaching or in retirement; here’s your Budget breakdown
Rachel Reeves has now delivered her second Budget, but as I’m writing this column, most of the headlines seem more concerned with the lead up to the speech – government leaks and the future of the Office of Budget Responsibility (OBR) – rather than the smorgasbord of policies announced.
So, what changed for people who are approaching or already in retirement? Taken at face value, not a great deal but, as ever, the devil is in the detail.
The main takeaway is that making the most of tax allowances on offer and blending withdrawals in retirement from different tax wrappers will still prove a good strategy for those who want to stay invested. Those who didn’t make decisions based on rumours before the Budget will have reaped the rewards of not reacting to noise.
Here’s a summary of what was (and wasn’t) announced, with retirement in focus.
What happened to pension allowances?
Let’s start with the good news, we didn’t see any changes to the main pension allowances and reliefs, which are summarised on the next page.
A £2,000 cap on the amount of pay that can be exchanged for pension contributions without being subject to National Insurance (NI) is on the cards, but not until April 2029. According to the Society of Pension Professionals, around one in three private sector workers is in a salary sacrifice scheme, but only around one in 10 in the public sector. Some workers and employers might look to make the most of the NI perks on offer while stocks last, and much depends on individual circumstances, but the key point is that the income tax relief rules have not changed.

Will I end up paying income tax in retirement?
Thanks to the triple lock, it was confirmed the full new state pension will rise by 4.8% in April 2026, to around £12,548 a year and set to breach the taxfree personal allowance by April 2027. If your only source of income is the state pension, and you’re pushed over the £12,570 limit, the government has announced that you will not have to pay any income tax that would otherwise be due.
But millions of pensioners already pay income tax with more than one million already caught in the higher rate band of 40%.
Freezing personal tax allowances and thresholds for another three years until April 2031 will inevitably drag more people into paying more tax as incomes and asset values rise over time, including for those close to or in retirement.
What about income tax rates for savings and investments?
Higher income tax rates on savings and investment income will make ISA and pension wrappers look even more attractive as they shield your returns from taxes.
Savings income tax is due to rise by two percentage points from April 2027 across all bands, and the same two percentage point increase will apply to the ordinary and higher rates of dividend income from April 2026.
Those relying on property income will also see a two percentage point increase in tax rates, again from April 2027.
Lump sum allowance
£268,275
Pension annual allowance Pension tax relief
100%
£60,000
for most people as standard of UK earnings, or £3,600 if higher*
You can usually take up to 25% of the value of your pension(s) tax free, with this allowance capping the monetary value in your lifetime.
This fixed allowance is at risk of being eroded by inflation over the long term for people at or close to the limit already.
Will
I
be affected by Cash ISA cuts?
The amount that can be paid in across all your pensions, per tax year before a tax charge might apply. This includes the money you contribute yourself and anything paid in by a third party or your employer.
You’ll still have a lower £10,000 across your ‘money purchase’ pensions like SIPPs, if you’ve already taken a flexible (income) withdrawal from any of your pots.
There is a potential sting in the tail for people under age 65 looking to shield higher amounts of cash in ISAs, potentially as part of a cash funnel strategy in the run up to retirement or to drip feed in some of their tax-free cash withdrawals. The annual subscription limit for a Cash ISA will be set at £12,000 for investors under the age of 65 from April 2027, but for those 65 and over, the annual limit for a Cash ISA will remain at £20,000.
Were there any changes to inheritance tax on pensions?
The draft legislation is due any day now, and it’s unlikely that we’ll see any major changes to the proposals to include unused pension funds in the value of someone’s estate for deaths after 6 April 2027. But the budget documents did confirm a small tweak to the administration process to ease some of the burden on the personal representative of the pension holder after death. It’s been announced that they’ll also be able to ask the pension scheme to retain funds to meet the IHT bill in certain circumstances. Until now, the
The maximum personal contribution that can qualify for tax relief is the higher of £3,600 or you UK earnings before tax.
Tax relief is granted at your marginal rate, meaning the potential income tax savings on offer are higher the more you earn. *Under 75s.
proposals only gave this power to beneficiaries themselves, potentially creating issues if money then had to be reclaimed by an estate.
The amount everyone can pass on before IHT applies, known as the nil rate band, will remain frozen at £325,000 until 2031.
Who will the ‘mansion tax’ affect?
An extra tax for properties valued over £2 million will be introduced from April 2028. This will start at £2,500 a year for properties in the £2-£2.5million band, stepping up to £7,500 for those worth over £5 million.
Although this won’t affect everyone, those who have lived in the same place for decades and seen house prices soar over that period might review their plans to stay put in retirement. It could even cause people to shift focus from options like equity release towards considering downsizing as an alternative.

Charlene Young Senior Pensions and Savings Expert

How do I find funds which go against the herd?
Ask the experts
Paul Angell is on hand to answer your questions about investments.
If you’d like a question considered for a future edition send it in now.
I’m worried about holding too many of the same sorts of companies in my portfolio. I want to find some funds that invest a bit differently, but they are difficult to identify. How do I pick more diverse funds?
Jack Paul Angell, AJ Bell Head of Investment Research,

says:
Selecting funds that purposely stray from the companies you’d be exposed to in an index is popularly known as ‘contrarian investing’.
These kinds of funds typically focus on value, which means they are searching for stocks that, in the fund manager’s opinion, are priced lower than they should be. It is worth noting that contrarian funds are often more volatile than other funds. When it comes to adding contrarian investments in a portfolio, you’ll likely need to determine what needs to be tweaked from your current allocations. That may mean decreasing exposure to a sector that makes up a large chunk of your portfolio or adding to an area that is currently underrepresented. AJ Bell customers have access to this information in their account, where they can see a breakdown of holdings by sector.
Some markets will be more contrarian by nature, and this can provide a starting point for your search.
For example, the US information technology space leans strongly towards growth

characteristics, focusing on what the potential of a company could mean for returns, while contrarians will tend to have a bias towards lower valued sectors such as energy, utilities, financials and healthcare, where companies are typically more mature.
Contrarian funds typically won’t focus on the most glamorous stocks, but because they aren’t making a big splash in the headlines like Nvidia or Tesla, it means that there’s a chance they are overlooked and therefore trading at a discounted valuation.
Choosing the right fund
You can search for funds that focus on an undervalued sector or region specifically, or if there’s a particular fund that’s caught your interest, you can perform checks to see if it will function well as a contrarian holding, whichever sector or region it is invested within.
Once you get down to choosing a particular fund, there are a few ways you can get a fuller picture of what it holds. If a fund is heavily exposed to the same areas as an index, it may not provide the diversification you’re searching for. The number of holdings in a fund can be another clue. Managers
Ask Paul: Your investment questions answered
that carefully select each stock on its own merits won’t be able to keep tabs on hundreds of companies. So, funds that have between 40 to 100 holdings typically have higher stock specific risk and therefore have a better chance of being more genuinely contrarian.
If you are willing to take a deep dive, reports like Morningstar’s analysis documents, available within the AJ Bell platform, provide further information on a fund’s characteristics with diagrams and metrics showing its positioning with respect to value and growth as investment styles. If you’re searching for contrarian investments, the price to earnings ratio of the fund will typically be less than that of the index. Price to earnings is the ratio of the share price to earnings per share.
It’s important to be aware of value traps. Just because a stock is cheap, does not mean it is good value and there may be very valid reasons for its low price. Assessing how the fund has performed through time can help investors assess if the managers are truly finding good opportunities, or if they have just loaded up on cheap stocks which
Examples of contrarian/value
What is active share?
Active share is a measure of how different a fund’s holdings are from its benchmark, the index against which it measures its performance. So, if a fund had no holdings at all in common with its benchmark, it would have an active share of 100%, and if all its holdings were the same as the benchmark, its active share would be 0%. High active share is considered 80% or more.
are going nowhere. Active share, explained above, can also be useful and is often to be found on fund factsheets.
A few of the strategies on AJ Bell’s favourite funds list that fall into the contrarian/value category include Man Income, Fidelity Special Situations, Invesco Asian, Lazard Emerging Markets, Schroder Global Equity Income, and Lightman European Fund.
Measuring performance of contrarian investments
In recent years, contrarian investors, especially in global or US markets, have struggled to keep up with their performance of major indices. This is predominantly due to companies like Nvidia, which make up such a large part of the indices, having performed so well. Therefore, if a fund doesn’t hold those big winners, it’s very hard for their relative returns to compete.
Notably, this has not been the case for markets in the UK and Europe. Here, value strategies have outperformed growth in recent years, so a contrarian manager underperforming a main index would represent more of a concern.
Source: AJ Bell, Morningstar
Many contrarian funds will still measure their returns against a traditional index, like the MSCI World. But if you’re attempting to see how the strategy has done versus other investments that are focused on value, you may be better off comparing them to another benchmark. One way to do this is to find a passive instrument that tracks an index in that same realm, like the Xtrackers MSCI World Value ETF for a contrarian global fund or the iShares Edge MSCI USA Value Factor ETF for a USfocused fund.
Revealed: a great way to find stocks at a discount

In this article we’re on the hunt for shares which are trading at valuations which are significantly lower than they have historically traded on.
To do this we have screened for companies trading at a discount to their average 10-year forward PE or price to earnings ratio.
The forward PE ratio is a stock valuation measure that uses a company’s projected earnings. It is calculated by dividing the current stock price by analysts’ EPS (earnings per share) forecasts for the next 12 months.
This valuation metric has an advantage over the trailing PE because it incorporates the market’s expectations for a company’s future earnings potential. The downside is that analysts’ forecasts can be wrong.
Despite these limitations, the forward PE can be a useful measure to screen for companies trading at a discount to their long-term average, unearthing potential candidates for further research.
Why are PE ratios volatile?
The large swings seen in PE ratios are typically linked to the price component of the ratio.
Over the short term, investor sentiment can have a significant impact on the share price, while the earnings component has more influence over longer timeframes.
The interplay between these two effects can drive PE ratios some distance from their long-term average.
It is important to note; there is no guarantee PE ratios will move back to the average. However, assuming a business has not changed too much, the average PE can act like a magnet, pulling the ratio back to the norm.
Shares has used ShareScope software to screen
for FTSE 350 stocks with a forward PE at least 30% below the 10-year average. Bear in mind that implicit in adopting a 10-year period is a long-term focus.
Which stocks are trading on the steepest PE discounts?
Specialist media platform Future stands out for a few reasons, not least because its forward PE is sitting a substantial 66% below its 10-year average.
On more than one occasion since the late 1990s Future has been treated as a ‘stock market darling’ growth story.
Source: LSEG
The period from 2017 to 2022 saw Future become a high-growth consolidator of specialist media titles, driven by multiple acquisitions.
This momentum and growth narrative pushed the PE to around 28 times at the peak in late 2021.
The stock got caught up in the sell-off of highly valued shares in 2022 driven by the sharp increase Future (p) 20162018202020222024 0 1,000 2,000 3,000
in interest rates as the Bank of England responded to rising inflation.
This period coincided with a slowdown in digital advertising and investor concerns over the performance of Future’s core businesses, which led to the stock’s de-rating.
The shares now trade on a mid-single digit PE suggesting Future days as a growth business may be behind it.
Though the promise of a return to modest growth in the year to 30 September 2026 delivered alongside full-year results (4 December) did at least give the market a modicum of encouragement.
Multi-brand fashion company and ‘King of
Trainers’ JD Sports Fashion has also fallen from grace as a dependable growth company amid multiple profit warnings and heavy discounting.
The shares trade around two thirds below their 2021 peak, and the forward PE is under half its 10year average.
In a third-quarter trading statement on 20 November the company said it was taking a ‘pragmatic’ approach ahead of the peak festive trading period.
Management guided for full year pre-tax profit to be at the lower end of the current consensus range of £853 million to £888 million, implying a 7% yearin-year fall.
FTSE 350 companies trading at a discount to 10-year forward PE
Source: ShareScope, data to 28 November 2025 Note: excludes property companies, based on forecasts for the
Analysts expect JD Sports to get back to growth over the next few years in line with the firm’s ambition to open 200 new stores a year and achieve an operating margin exceeding 10% by 2028.
How swings in earnings can impact a PE
It might seem surprising to see FTSE 100 oil company Shell trading at a 45% discount to its 10year average forward PE, but this reflects the highly volatile nature of earnings in the oil and gas sector. Weak oil prices translated into years of low profit in the wake of the oil price crash in the mid-2010s and during the pandemic which led to a spike in the PE ratio. Meanwhile, in the boom couple of years seen after the invasion of Ukraine the PE was driven down to a low single digit value as earnings forecasts were rapidly upgraded and the share price didn’t keep pace.
For companies like Shell, it is more meaningful to look at the median PE which excludes outliers. On this basis the PE is 13.4 times, reducing the discount to 17%.
Premium drinks company Diageo saw its shares drop to 12-year lows recently, pushing the forward PE nearly 40% below its 10-year average.
One piece of news which was well received by investors is the recent appointment of former Tesco chief executive Dave Lewis as the new CEO.
Lewis has some strengths to work with to engineer a turnaround. Diageo possesses a collection of iconic brands like Johnnie Walker, Guiness and Smirnoff and enjoys global scale advantages.

The UK’s leading pizza group Domino’s Pizza has faced significant headwinds from the cost-ofliving crisis as consumers cut back on discretionary spending.
The shares trade close to 12-year lows and the forward PE is 43% below its 10-year average.
Domino’s franchisees have faced significant cost increases, resulting in the company recently slowing the pace of new store openings.
Source: LSEG
Diageo has suffered from combination of headwinds including a post-Covid spending hangover, weakness in the US and China, a profit warning due to oversupply issues in Latin America and changing consumer habits.
Despite these hiccups, Domino’s has not abandoned its ambition to grow its estate to 1,600 stores by 2028 and 2,000 by 2033, generating £2.5 billion of system sales.

Portfolio MOT: how to keep your investments ticking over

The one constant everyone can rely on in life and investing is change. Keeping on top of shifts in your portfolio is crucial if you want to remain positioned to reach your long-term goals.
Before considering your investments, it is probably worth taking stock of your personal situation to consider any material changes. Things like getting married, moving home, or starting a family can have a big impact on finances.
Maybe you’ve had an inheritance which could change your attitude to investment risk and financial security. On the other hand, you could be out of work and looking for a new job. Or you might be planning to retire and draw on your pension, looking to dial down investment risk.
Whatever your personal circumstances it is important to make sure your investments and attitude to risk are always aligned to keep your investing on track.
Why you shouldn’t tinker too much
While it is important to have a good handle on your portfolio, it is worth remembering that investing is a marathon and not a sprint. In other words, investments need time to breathe so don’t get too hung up on short-term performance. As a longterm investor you probably don’t need to check your portfolio more than once a month, unless there is a particularly significant development which affects them.
When you do look at performance, the focus should be on monitoring how your investments are doing relative to expectations. In this regard, one challenge for all investors is that stock prices tend to
swing around a lot more than underlying company fundamentals such as cash flow and profits. This can distract investors from what really matters.
To quote Fundsmith founder Terry Smith: “Over the long term, it’s hard for a stock to earn a much better return than the business which underlies it earns.
“The implication is that stock prices tend to follow the underlying company’s profits,” reasons Smith.
This leads us to a key principle of managing a portfolio, which is to focus on the financial performance of the underlying businesses and ignore short-term price movements.
A similarly detached view is necessary when considering fund investments too. Consider how the fund has performed over the long run and don’t be tempted to exit your investment just because it has struggled over a shorter period.
Why is reinvesting dividends so important?
One of the attractions of owning stocks is that they pay dividends, typically twice a year in the UK with some companies paying special dividends as well. Investment trusts also pay out regular dividends. It is important to stay on top of your dividend income and, assuming the income is not required, reinvest them.
This involves buying more shares which, in turn, increases future dividend income, which allows more shares to be purchased and so on, creating a virtuous circle. This is how compounding works.
Bonds also pay interest, again typically twice a year, although there are products which pay
The power of dividend reinvestment
Based on to data from ShareScope, if you had invested £100 in specialist distribution business Diploma at the beginning of this century you would now be sitting on an investment worth £30,500 if you had reinvested your dividends (though this doesn’t factor in fees). Whereas if you just took the income you would have only a little over half as much – £16,400 – in share price gains and dividends.
How much £100 invested in Diploma on 1 January 2000 would be worth today with and without dividend reinvestment
quarterly and even monthly income.
Investors who regularly squirrel away savings into investment plans will also find cash building up as a result, which needs to be put to work.
Investing excess cash and reinvesting income from stocks, bonds and investment trusts are key parts of portfolio maintenance.
If you are investing in an open-ended fund or exchange-traded fund you will usually have the option of buying an accumulation (acc for short) or income (inc) version. The former will automatically reinvest any income for you while the latter pays income out.
What is rebalancing and why does it matter?
One of the advantages of a well-diversified portfolio is that stock prices often diverge with some performing better than others. A similar pattern happens between asset classes, like stocks and bonds.
While this is not important in the short term, over time these moves can change the shape and balance of a portfolio.
Therefore, rebalancing is a good habit to get into to keep your portfolio from getting too out of shape. You may conclude after a review of the portfolio that you are happy with the existing allocations.
Source: AJ Bell, ShareScope
Most investment platforms offer dividend reinvestment services which allow you to elect to automatically reinvest dividends from UKlisted shares, investment trusts and ETFs for a reduced dealing charge.
On the other hand, if the portfolio has become too reliant on one region, sector or fund, you may decide it is time to make some changes. The good news is that taking some cash from your best performers and deploying it into the parts of the portfolio which have lagged means you are buying low and selling high and can help avoid emotional mistakes driven by market exuberance or panic.
It might seem obvious, but the more transactions you make, the more costs you incur, which over time can add up and impact performance. Keeping costs low is an important aspect of successful investing so rebalancing is probably something to consider at most once a year.
Should I sell poor performers?
Selling is one of the hardest disciplines to get right in investing simply because whether we are talking about individual shares, sectors, regions or funds and ETFs, sentiment tends to drive shortterm performance.
A useful starting point is to check the original investment case and reasons you bought are still intact. For individual shares this means assessing how the business is performing relative to expectations.
If a business is not performing, does management have a credible plan to improve the situation? Maybe the company has had a change of leadership, or the strategy has shifted in a different direction.
For funds and trusts, ensure there hasn’t been a change in fund manager or strategy, and if there has, consider whether it’s still fit for purpose. All funds go through bad patches, so try to figure out if that is because the strategy is out of favour or something more serious.
It may be worth considering replacing serially
underperforming active funds with cheaper tracker funds.
Reviewing a portfolio is also a good time to consider new investment ideas, whether that means getting exposure to emerging trends, different sectors or other asset classes such as gold or property.
It is important to consider an investment’s diversification benefits as well as its return potential. This helps to maintain a balanced portfolio and ensure a lower variability of returns.
Martin Gamble Shares and Markets Writer
Disclaimer: These articles are for information purposes and should only be used as part of your investment research. They aren’t offering financial advice, so please make sure you’re comfortable with the risks before investing. Past performance does not guarantee future results. The value of your investments can go up or down.
Earn £50 in John Lewis vouchers by sharing your investing stories
• Just started investing and learning some lessons?
• Experienced the ups and downs of the market over decades?
• Started investing in funds and now dipping your toe in stocks?
Whether you’re a novice or a long-time market enthusiast we want to hear from you about your experiences. Get in touch with your name and a few lines describing your approach to investing. If you’re selected to feature in the magazine we’ll be in touch to get the full story.
TERMS AND CONDITIONS
The offer
Subject to the terms below, the offer is to receive a £50 digital gift voucher when your experiences as an investor are published in Shares magazine (“Case study”). The offer is open between 13 November 2025 and 30 September 2026 (“Offer Period”).
Payment is only made to case studies published in Shares magazine.
Submissions do not guarantee your case study will be published. The Editor decides which case studies to publish and in which format.
Eligibility rules
You must be 18 or over and resident in the UK to qualify for the promotion.
Employees of AJ Bell (the publisher of Shares magazine), its affiliated companies, and the immediate families of any such employees are not eligible for the offer.
Receiving the offer
If your case study is published is valid, a link to download the voucher will be sent to your registered email address within 4 weeks of the article being published. AJ Bell will not take any responsibility for your failure to supply accurate
with the words ‘My portfolio’ in the subject line
DISCLAIMER: Shares/AJ Bell does not provide advice or personal recommendations. The case study articles are for information only. You must do your own research and consider your own personal circumstances before making investment decisions.
information which affects acceptance or delivery of the offer.
Details about how we may process your personal information can be found here.
General
We reserve the right to amend, suspend or withdraw the offer and/or these terms without prior notice and at our sole discretion by posting a notice on our website.
AJ Bell will not be held liable if any unforeseen event means that we are unable to fulfil this offer. In this event, no compensation will be payable by us. By making a claim in the offer, you are deemed to accept the terms and
conditions of our digital gift voucher partner.
The offer is non-exchangeable, nontransferable and no cash alternative is offered.
By participating in the offer, all claimants are deemed to accept these terms and conditions.
The Promoter of this offer is AJ Bell. The Promoter’s principal place of business is at 4 Exchange Quay, Salford Quays, Manchester, M5 3EE. The Promoter may exclude from participation anyone who we believe to be taking unfair advantage of the offer.

The how and why of investing in the pharmaceutical sector
Could investing in pharmaceutical companies get your portfolio in better shape? The pharma sector is, at the very least, difficult to ignore given it represents around a fifth of the MSCI World index. It has also outperformed this global benchmark index over the last 30 years.
In the last three and five years though, pharma stocks have significantly lagged the global market, which has been led by the ‘Magnificent Seven’ and AI-related names.
The sector has also faced headwinds from higher interest rates, rising costs from supply chain issues plus uncertainty on drug prices and, more recently, tariffs.
The pharmaceutical industry is seen as relatively defensive due to the fact people require medical care regardless of economic conditions and government spending on healthcare has increased over time.
There is healthy representation for the pharma sector in the London market. AstraZeneca is the largest company in the FTSE 100 index, with its peer GSK also in the top 10 list of constituents. So, anyone with broad-based exposure to UK stocks will have material exposure to this sector.
Understandably some investors might be wary of putting their money to work in the pharmaceutical space because they might lack the specialist medical knowledge required to fully understand the science and evaluate the risks and opportunities in front of individual businesses.
Fortunately for non-specialists, there are ways to get diversified access through ETFs and actively managed funds, which we discuss later in the article.
What is the outlook for the sector?
The global pharmaceutical sector is a $1.75 trillion industry characterised by rapid technological innovation.
The market is forecast to grow at a compound annual growth rate of between 6% to 8% to reach more than $3 trillion by 2035 with emerging markets showing the fastest growth.
It benefits from structural drivers such as increasing demand for new drugs and therapies related to an aging global population. The World

Health Organisation estimates the proportion of people aged over 60 years will nearly double between 2015 and 2050 to 22% from 12%.
Meanwhile the number of people aged 80 or over is expected to triple by 2050 to reach 426 million. While the shift began in high income countries like Japan, by 2050 80% of older people will live in low and middle-income countries.
These trends contribute to the increasing prevalence of chronic disease like cancer, diabetes, obesity, cardiovascular conditions and neurological disorders.
Cancer treatments remain the largest therapy segment with annual revenues expected to top $275 billion in 2025, growing by low double-digit percentages. Autoimmune and inflammatory diseases are the second largest area worth around $175 billion.
Metabolic diseases, especially diabetes and obesity are another high growth segment being fuelled by GLP-1 (Glucagon-like peptide-1) weight-loss drugs which mimic the body’s natural hormone to regulate blood sugar and appetite.
Danish-based Novo Nordisk and US listed Eli Lilly have carved out a significant lead in the obesity market with their respective weekly injectable treatments Wegovy and Zepbound, which remain the only regulated products on the market.
Analysts project combined sales of Wegovy and Zepbound could top $60 billion in 2025 and Morgan Stanley projects the obesity market could be worth $150 billion by 2035.
Morgan Stanley’s Terrance Flynn writes: “We believe we are now at an inflection point for the broadening of obesity drugs’ use, which will extend beyond the U.S. to larger numbers of patients globally.”
We discuss the obesity market in more detail later in this article.
How does the pharmaceutical industry work?
Drug companies are unusual in the business world because their products only have a few years to generate revenues and make a profit before they face stiff competition from generics.
Generics are copycat versions of branded drugs and are usually sold at a cheaper price, reducing demand for the branded version.
Firms look to protect their intellectual property and new inventions by filing patents, which grant exclusivity, typically for a period of 20 years. Patents tend to be filed in the earlier stages of research to prevent a competitor from discovering the idea.
This means the clock starts ticking on the 20year exclusivity period a long time before a drug candidate has been proven to work and tested for safety through clinical trials.
It can take between eight and 12 years to get a drug approved by a regulator and ready for market, which means the commercial opportunity window is a lot less than 20 years.
The World Health Organisation estimates the proportion of people aged over 60 years will nearly double between 2015 and 2050 to 22% from 12%.
Developing drugs is not only time consuming, but also very expensive and highly uncertain. According to the Tufts Centre for the Study of Drug Development, it can cost between $2.2 billion to $2.8 billion to bring a drug to market.
Data suggests only one in 10,000 compounds in pre-clinical research reach the market and around 10% of drugs entering clinical trials get regulatory approval. Half of the drugs which reach late-stage phase three trials go on to be get approved.
The journey to market for a new drug Lipitor timeline
Let’s look at a real example of a drug’s journey to market.
Pfizer’s blockbuster cholesterol drug Lipitor took around a decade to be researched, tested and approved. The drug achieved peak annual sales of $12.9 billion in 2006, and in 2011 the patent finally expired.
During its life as a patented drug Lipitor generated more than $130 billion in
FDA approval and launch by Warner Lambert in 1996/97
worldwide sales, making it the best-selling drug of all time. Sales are estimated to have totalled around $172 billion by the end of 2022.
Lipitor was discovered by Warner-Lambert which Pfizer acquired in 2000 for $90 billion, largely for Lipitor’s potential, standing out as a rare example of a company buying its way to success.
Sales peak in 2006
Discovery in 1985
Acquired by Pfizer in 2000
What is driving the increase in mergers and acquisitions?
Due to the unique way the industry operates, it is important for companies to develop a strong pipeline of new drugs to replace the lost revenue from those moving off patent.
Analysts call this risk a patent cliff. Big pharma companies face a collective $236 billion patent cliff between 2025 and 2030 according to consultancy
Patent expires in 2011
Deloitte, as patents on blockbuster drugs are set to expire.
Analysts project the top 10 firms could see a two-thirds decline in revenues from their key drugs by 2030 without replacements from the pipeline, which explains the elevated number of acquisitions and licensing deals in 2025 which are running at roughly $70 billion.
Examples include Johnson & Johnson’s $14.6 billion purchase of Intra-Cellular and Merck’s $10 billion acquisition of Verona.
What valuation do the big pharma stocks trade on?
Source: Stockopedia, LSEG, data to 11
What are generics and why do they benefit from patent expiries?
The global generics market is estimated to be worth around $430 billion in 2025 and projected by analysts to grow to $684 billion by 2030.
A key component of growth is expected to come from the increasing number of big-name drugs moving off patent over the next five years.
An adjacent market to generics is biosimilars which refers to drugs based on living cells rather than chemical compounds. Unlike generics, biosimilars are not exact copies of branded drugs due to the complexity and variability of biology.
The US is the largest consumer of generic drugs where over 90% of prescriptions are for generics.
India is the often referred to as the ‘pharmacy of the world’ due to its large production and export of generic drugs.
The largest quoted generics companies include Swiss firm Sandoz, Teva, Viatris, Dr. Reddy’s, Fresenius and India’s largest pharma company Sun Pharma. In the UK, generics specialist Hikma Pharmaceuticals is a constituent of the FTSE 100.

What impact are tariffs having?
With the caveat that the US tariff landscape can change without much notice, the current state of play is a tariff framework which sets a ceiling of 15% for imported pharmaceuticals from the EU and Japan.
The US administration announced an executive order to create ‘Most Favoured Nation’ pricing for US patients, with the goal of reducing prices to the lowest priced drugs in other developed countries.
The world’s biggest drug makers operating in the US must offer MFN prices to every single Medicaid patient, the low-income state insurance programme.
Eli Lilly and Pfizer have inked deals whereby they get a three year pause on tariffs in return lowering certain drug prices to the government. In addition, Lilly said it would invest at least $27 billion while Pfizer said it would spend $70 billion to build factories in the US over the next few years.
AstraZeneca has secured a three-year tariff exemption in return for committing $50 billion in US manufacturing and research and development facilities.
Meanwhile, GSK said it will make a $30 billion investment over the next five years in a similar move.

What about China?
The tariff situation is more nuanced in China because while it does not export many finished pharmaceutical products, it is often a monopoly supplier of APIs (Active Pharmaceutical Ingredients) and intermediates needed to manufacture many generic drugs globally.
Some estimates suggest up to 70% of all APIs used in US generics are sourced from China which, if levies are passed on, could lead to higher prices for patients.
To mitigate the risk, companies are busily diversifying their sourcing to other countries. This is forcing a large scale, expensive global realignment of global production.
How big could the obesity market become?
The US is the biggest obesity market in the world with around eight million patients. It is projected to rise to 30 million patients by 2035, representing a penetration rate of between 20% to 25% of the obese population.
The growth prospects for the rest of the world are even greater with the rate of obesity drug penetration estimated to jump from 1% to 10% over the next decade.
Early data on drug launches outside the US suggest high demand in Brazil and India despite the fact patients must cover the cost themselves.
Morgan Stanley equity analyst Thibault Boutherin says: “We anticipate manufacturers’ focus on Asia’s obesity market will grow, particularly in China and Japan, where penetration is low, and innovation continues to emerge.”
Wegovy and Zepbound enjoy currently high market shares but that could change as the market shifts to next generation drugs which offer fewer side effects and convenience.
So far, the excitement around oral pills has not been backed up by the science with both Novo Nordisk and Eli Lilly revealing disappointing clinical trial results in 2025.
Novo is likely to be the first company to launch an oral weight-loss pill given it has already submitted a New Drug Application in the US with approval expected by the end of 2025 or early 2026.
In clinical trials patients taking the daily pill lost around 14% of their bodyweight over 64 weeks.
Eli Lilly’s oral pill Orforglipron has a different chemistry to the injectable version and in clinical trials patients lost an average 11% of their bodyweight on the highest dose.
The company expects to apply to the US regulator before the end of 2025 with potential approval in 2026.
Pfizer discontinued the development of its oral GLP-1 drug candidate Danuglipron in April 2025 after a patient reported a potential drug-induced liver incident.
The company subsequently agreed to purchase weight-loss start up Metsera for up to $10 billion on 12 November after a short-lived takeover battle with Novo Nordisk.
Both companies were attracted to Metsera’s weight-loss drug pipeline which includes a monthly injectable GLP-1 that induced 14% weight loss in mid-stage clinical trials.
The company also has an oral GLP-1 in early development. Metsera shares have risen 167% since their IPO (initial public offering) in January 2025.
Looking to shore up its obesity pipeline Novo struck an exclusive $2.2 billion collaboration deal with San Francisco-based biotech firm Septerna in May 2025.
Sector Report: Pharmaceutical sector
Other large pharmaceutical groups developing GLP-1s include AstraZeneca and Amgen while smaller biotechnology companies Viking Therapeutics, Zealand Pharma and Structure Therapeutic are also developing weight-loss therapies.
What is biotechnology?
Biotechnology companies focus on biological processes such as genetic engineering and cell research to create ‘biologic’ drugs to improve human life. Whereas pharmaceutical firms tend to concentrate on developing and manufacturing drugs through chemical synthesis, often with more established process and more consistent streams of revenue. The biotech field also includes areas like agriculture and environmental science.
Biotechnology companies are often smaller pre-revenue firms, focused on research and development, which makes them riskier investments.
Share prices can move around a lot, both up and down, especially around the release of clinical trial results.
Biotech companies often rely on external funding from venture capital firms or partnerships with larger pharmaceutical firms to sustain their research and development.
The most used benchmark tracking quoted biotechnology shares is the NBI or Nasdaq Biotechnology Index.
Over the last five years, the NBI has lagged the broad S&P 500 index by a wide margin, gaining just 25% compared with the near doubling for the S&P 500 index.
However, since May 2025 the NBI has seen a significant rally, gaining 37% compared with 17% for the S&P 500 index.
This has been driven by an increase in M&A (mergers and acquisition) activity and the IPO market showing signs of life after many years in the wilderness.
Indicative of rising investor enthusiasm was molecular diagnostics firm BillionToOne whose shares briefly touched $120 on their first day of dealings on Nasdaq after listing at just $60 per share.
In the private markets space, there are an estimated 157 clinical assets being investigated to combat obesity, 43% of which are aimed at the oral pill market with seven in late-stage clinical trials, according to data from industry research specialist IQVIA.

Ways to get passive exposure to the global pharmaceutical sector
The largest and cheapest ETF is the Xtrackers MSCI World Health Care UCITS ETF which has £2.5 billion of assets under management.
The fund seeks to replicate the performance of the MSCI World Health Care index by buying all the index constituents. Dividends are accumulated and reinvested in the ETF.
Around two thirds of the fund is invested in US stocks and top holdings include Eli Lilly, Jonhson & Johnson, AbbVie and AstraZeneca. The ETF has an annual charge of 0.25%.
The largest and cheapest ETF tracking the Nasdaq Biotechnology index is the iShares US Nasdaq Biotechnology UCITS ETF which has just over half a billion pounds in assets under management.
The ETF holds over 250 names and seeks to replicate the performance of the NBI by buying a selection of the most relevant index constituents. Dividends are accumulated and reinvested.
Around 75% of the fund is invested in US companies and the top 10 holdings represent 45% of total assets.

Ways to get passive exposure
iShares Nasdaq US
Source: JustETF, data to 14 November
What about actively managed funds and trusts?
There are specialist actively managed funds and trusts available which aim to give investors diversified exposure to the sector. These vehicles have higher annual charges than ETFs.
The main difference between trusts and funds is that the former, also called closed ended funds, can trade at a premium or discount to the value of the assets in the portfolio.
Investment trusts can borrow money to invest which is not possible for open ended funds. Investment trusts trade like shares while funds are usually priced daily.
The largest trust in the sector is Worldwide Healthcare Trust which has £1.5 billion of assets under management. The trust trades on a 7% discount to net asset value and the annual charge is 0.9% a year.
The fund is managed by Orbimed Advisors, one of the largest dedicated healthcare firms in the world with over $19 billion of assets under management.
The investment team has a global focus and covers the entire spectrum of companies, from early stage to fully integrated biopharmaceutical companies.
The team looks for companies with underappreciated products in the pipeline, and high-quality management teams. Since launch in 1995 the fund has generated an

Actively managed funds and trusts
Source: Morningstar, data to 14 November
return in net asset value of 13.4% a year, compared with an index return of 10.9% a year.
The largest actively managed biotechnology fund is Polar Capital Biotech, which has £1.9 billion of assets under management and an annual charge of 1.1%. The fund typically holds between 40 and 60 positions.
Managed by a team of eight sector specialists with a combined 150 years of industry
experience, the fund looks to invest in cutting edge medical innovation where the team believes the stock market is underappreciating a company’s potential.

Martin Gamble Shares and Markets Writer


What should I do with my first bonus: treat myself, save it or invest it?
Ask the experts
Laura Suter is on hand to answer your personal finance questions.
If you’d like a question considered for a future edition send it in now.
I’ve just received my first-ever work bonus, and I’m not sure what to do with it. Part of me wants to celebrate and splurge on something I’ve wanted for ages, but I also feel like I should be sensible and either save or invest it. What’s the best way to balance enjoying the moment with making a smart financial decision?
Anonymous

Laura Suter, AJ Bell Director of Personal Finance,
says:
The end of the year marks bonus season for a number of companies – great news for anyone fortunate enough to get one. Bonuses will vary hugely depending on your job, how senior you are
and the industry you work in. For some people their bonus can be 100% of their salary (or even more) where for others it will be a few hundred quid bump to their final pay packet of the year (or if you’re Apple boss Tim Cook a few years ago, it’s a $75 million boost to your pay packet). But if you’re fortunate enough to be in the bonus club, here’s your toolkit of what to do with it.
First up, don’t forget tax (and other deductions). You may get a letter from your company confirming your bonus amount but sadly that isn’t how much you’ll actually receive. You need to factor in how much you’ll lose to income tax and national insurance and also whether some will automatically go into your pension. If you have a student loan you’ll also lose some to that payment.
All of these deductions can really add up. Everyone’s situation will be different, but it’s good to bear in mind how much you could lose to various deductions. And watch out for emergency tax – you may be charged extra income tax as often the way PAYE systems work is by assuming that the bonus is regular pay for that month, rather than a one-off payment. But this amount should be refunded automatically in your next payslip or at the end of the tax year.
What about splurging?
Right, now you know how much you have to play with you can work out what to do. First, let’s address the temptation to splurge it all. If you’re financially comfortable and on track with your money then that is a totally valid option. After all, you’ve worked hard to earn the bonus so there’s nothing wrong with treating yourself with it (so long as you won’t regret it later).
But it’s important to check in with your finances as this windfall of money could make a big difference to your financial wellbeing or future. So, do you have expensive debt that you should

How deductions can drastically reduce your bonus
Let’s take the example of a graduate on £40,000 a year who pays 5% into a pension and gets a £4,000 bonus. Of that, you’ll pay £200 into your pension, £760 in income tax, and then another £320 in national insurance. On top of that, the entire amount will be subject to a 9% deduction for student loan, amounting to another £360. All together that means in this example you’ll take home £2,360 of the original £4,000.
pay off, or is your bank account at zero every month with no buffer? If so, this money could be a great cushion. Generally, it’s a good idea to pay off expensive debt first and then build up an emergency fund of easy-access cash that you can access. Typically, this is three to six months of expenses, to cover you if you lose your job or face another emergency. If you’ve already got this sorted then bravo, and you can move on to the spend/save/invest dilemma.
Could a bonus help you achieve a goal?
Next up, think about whether you have a particular goal in mind. Are you saving for a particular thing (like buying a house, or your next holiday) and if so is it planned for the next three to five years or further out? Generally, if it’s a longer-term goal, you should consider investing the money. And we have loads of guides and support on AJ Bell to help you do that.
If you invest the money you will benefit from compound interest, meaning that your bonus will grow over time as it benefits from investment growth and the wonder of compounding. While this might not seem as immediately exciting as spending it, it means you can have a bigger pot in future. For example, if you get a £4,000 bonus and it grows at 5% a year, after five years you’d have £5,105 in your pot – so a gain of more than £1,100. And after 10 years that would have grown to £6,516 – adding more than £2,500 to your total.
Creating a ‘fun budget’
My personal view? I spent the first bonus I got from work on an expensive handbag. I used it lots and had a lot of pride that I’d been able to buy something I’d wanted for ages. It wasn’t the most financially smart move, but I had my ducks in a row when it came to my money and I had no responsibilities. Now I have a family, a mortgage and more financial responsibilities I wouldn’t want to splurge it all. But you can split the money: splurge some and be sensible with the rest. It’s nice to reward yourself for working hard, but you might regret frittering it all away. Instead, you could create a ‘fun budget’, where you allocate a percentage to enjoy now and be sensible with the rest.
Can Indian stocks start firing again after pause for breath?
Despite AI fears, geopolitical conflict, and ever-changing tariff policies, markets have (for the most part) ticked along reasonably well this year. Even after April’s dip, the S&P 500 has recovered, and the FTSE 100 has enjoyed a much more positive year than it has in some time. But one of the world’s top markets over the past decade, India, has quietly sunk down the charts.
Why have Indian shares struggled?
The mysterious thing about investors’ declining enthusiasm for India is that nothing very significant seems to have changed. The demographics of the region have stayed positive for growth, with a large and growing working age population, and the
country has improved corporate governance by introducing fresh regulations on its companies in recent years.
On the flipside, valuations were fairly elevated after a strong long-term showing for Indian shares, so a correction was always a possibility, and India slipped in terms of real GDP growth last year, with the rate easing to about 6.6%. While this was still far faster than even other emerging economies, which averaged 4.2%, it was enough to spook some investors.
Gaurav Narain, principal advisor of the India Capital Growth Fund, says: “One reason was because you had elections last year. You have a three-month period before the election and a three-month period after the election where the
investment cycle comes to a halt. The second reason was self-created.
“This was the central bank, which was very worried that credit was too strong at about 16% and they wanted it around 10%. What they did was really tighten the system, and specific areas like unsecured lending had a lot of regulatory caps.”
This year has so far looked more positive for India’s growth picture. For the April to June period in 2025, year-on-year GDP growth had rebounded to 7.8%, according to Deloitte.
India also felt a bump, like many other nations, from tariff threats. However, this has proved to be mostly inconsequential for businesses there, with a small portion of exports going to the US according to FundCalibre research director Juliet Schooling Latter.
“External risks, including renewed US tariffs, have stirred headlines but not fundamentals. Exports to the US represent only roughly 2.5% of GDP, and India’s growth is powered overwhelmingly by domestic demand, urbanisation and digitalisation,” Schooling Latter says.
India is lagging behind on AI
A clearer explanation of what has held India back this year is what the country doesn’t have. Namely, a meaningful footprint in artificial intelligence. In the past few years, investors have been willing to brave lofty valuations for AI exposure, and while this can be found in other emerging markets, there is little presence in India.
“The only theme India is not playing is artificial intelligence,” Narian says. “We have a thriving services economy but no real AI play, and a lot of people think India has underperformed simply because we don’t have an AI play. As some people say, India is the best ‘anti-AI’ market.”
As Narian hints, amid mounting fears of an AI bubble, this could end up being a positive. The history of strong returns could make it an attractive option to investors that are losing faith in AI.
“Global investors have rotated into AI themes in North Asia, temporarily trimming Indian allocations, although domestic inflows reached a nine-month high in July, underscoring local confidence,” Schooling Latter says.
This local confidence is a key factor. Although global investors have stripped back their India allocations, those in India have poured more into their own market, taking advantage of its relative
The best performing Indiafocused trusts and funds
Source: FE analytics, AIC, 13 November 2025
underperformance. While the past year has been more difficult for Indian markets, this has allowed the market to stay in the black despite waning overseas interest.
And the long-term figures are still strong. MSCI’s India index has returned 8.4% this year, and 114.2% over the past five years, in local currency.
This is better than the S&P 500’s own showing over five years, which sits at 101.2% in US dollar terms. But just like the US, India still has elevated valuations. This may have contributed to investors looking elsewhere in the emerging markets space. However, if AI worries keep building, a resurgence for Indian stocks could be on the cards.

Hannah Williford AJ Bell Content Writer

What is the
Shiller PE
and can it reveal if we’re in a bubble?
Ask the experts
Russ Mould is on hand to answer your queries about the financial markets.
If you’d like a question considered for a future edition send it in now.
There is a lot of noise in the current market about Shiller PE ratio and markets. If you can please explain this I would appreciate it.
Nanda

Russ Mould, AJ Bell Investment Director,
says:
The debate over whether the US equity market is in a bubble continues to rage. The Cyclically Adjusted Price Earnings (CAPE) ratio is one metric that is often cited by the bears and dismissed as past its useful life by stock market bulls. But before investors can assess the validity these respective arguments, they must make sure they know how the CAPE works and what it seeks to achieve.
What is a PE?
One frequently used valuation metric is the price to earnings (PE) ratio. Here the investor divides the share price by historic or forecast earnings per share (EPS). In effect, the multiple reflects how long it will take a company to earn its current stock market valuation in annual after-tax income, assuming no further growth.
Crudely put, the lower the ratio, the cheaper the shares, and vice-versa. Investors can assess the PE in absolute terms, or relative ones – stocks can be judged relative to their own history, the local index of which they are a part or domestic or global peers. Investors tend to use future earnings estimates and base their valuation judgements on

the ‘forward’ PE, to try and capture future growth prospects, since stock markets do not tend to look backward and are forward-looking discounting mechanisms that try to ‘price in’ future events.
However, this is where trouble can start. Cyclicals, or companies whose business is particularly sensitive to GDP growth, show the highest profits, and thus the lowest PE multiples, at the peak of the cycle and their earnings – just before a downturn in their fortunes and probably their share price.
They also tend to look most expensive when the economy and their profits are depressed and things are about to get a lot better, including their share price. Even without those swings and roundabouts, analysts future earnings forecasts tend to be wrong, either because they are too high, or too low, or because they extrapolate current trends which can be easily knocked off course by the unexpected.
Professor Robert J. Shiller devised and compiled the CAPE data in an attempt to iron out some of these wrinkles and take a longer-term view to try and cut through any cyclical noise. The CAPE takes the share price, or index level, and divides it by the average of the past 10 years’ inflation-adjusted earnings.
How CAPE offers a long-term view
Adherents like CAPE, because it takes a long-term view, looks at a company’s or index’s trend earnings power and considers cyclical highs and lows. It also incorporates how capitalism, when it works well, will ensure that supra-normal profits do not last long and revert to the mean, as competition comes looking for its piece of the action and reduces returns on capital over time.
Shiller CAPE can be a good guide to long-term equity returns
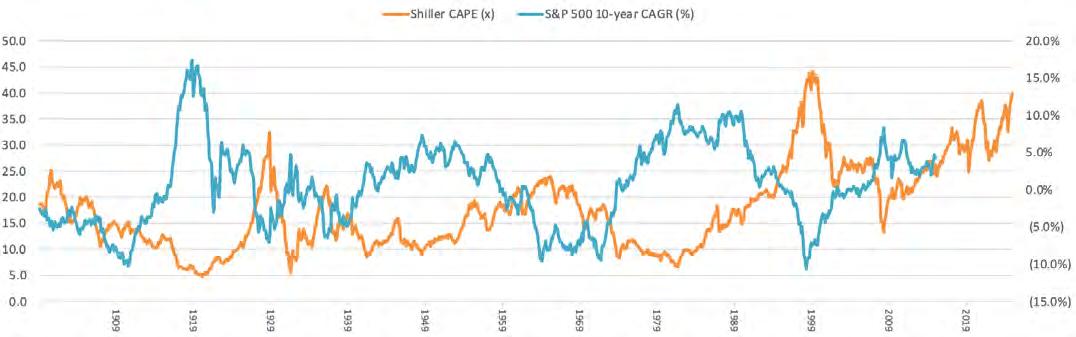
Source: http://www.econ.yale.edu/~shiller/data.htm, LSEG data
Sceptics hate CAPE, because it is backwardlooking. They will also argue the US, and the West, are no longer reliant upon capital-intensive manufacturing industries but asset-light ones, such as social media networks, software and artificial intelligence, as exemplified by the likes of Alphabet, Amazon, Apple, Meta Platforms, Microsoft, Nvidia and Tesla, who, generally, have dominant positions in their chosen areas and generate phenomenal profits and formidable cash flow as a result.
This then takes us to the debate about the current CAPE multiple for the S&P 500, which is around 40 times. The S&P 500 has only previously traded above 30 times on two prior occasions. Those bull runs were fun while they lasted, but neither episode ended well for investors. The first was in summer 1929, just before the October Wall Street Crash and the second in 1999-2000, just as the technology, media and telecoms (TMT) bubble reached its peak and got ready to pop.
Is CAPE still relevant?
In this respect, it seems like an open-and-shut case that the Shiller CAPE is warning of danger. After the initial collapse in autumn 1929, the CAPE multiple contracted to barely six times in summer 1932, to show the extent of the pain inflicted upon those who bought into the new-era thinking of the late 1920s, when technological advancement (in this case wireless radio, best captured by Radio Corporation of America stock) combined with arguments that valuation did not matter.
However, the S&P 500 bottomed on a CAPE rating of around 21 in spring 2023 once the TMT bubble burst and it hit a low of 15 times when sentiment was washed out in 2009 at the end of the bear market caused by the Great Financial Crisis. These much higher ‘trough’ ratings, the current dominance of a handful of seemingly impregnable stocks and the long bull market, whose origins go back some 16 years, prompt bulls to assert the CAPE is no longer relevant. Since 2013 the CAPE has barely dipped below 25, a level previously associated with market tops.
The battle lines are drawn. Shiller himself freely acknowledges that the CAPE is not meant to be a tool for timing the near-term movements of markets. Decade-long arguments that the US equity market is overvalued based on the methodology are indeed leaving many bears redfaced and out of pocket.
But the CAPE does have a good history of giving investors a feel for what long-term returns from US equities may be, as the chart suggests.
Simply put, the higher CAPE goes, the lower the compound annual growth rate (CAGR) over the next decade, and the lower CAPE goes, the better the 10-year returns. This is the iron law of maths and valuations, although it gives no clue as to the trajectory or degree of volatility over the decade. Taking Shiller’s work at face value, it seems unlikely that US stocks will do as well for investors in the next 10 years as they have the last 10, but only time will tell.

Why bonds matter to all investors
When people talk about investing, shares usually steal the spotlight. But behind the scenes, there’s a much bigger player quietly shaping everything from mortgage rates to pension deficits to taxes. That’s the bond market. Worth around £150 trillion globally, bonds form the bedrock of the world’s financial system. So what exactly are they, and why do they matter so much?
How do bonds work?
At its simplest, a bond is a loan. When you buy a bond, you’re lending money to the issuer, usually a government or company, in exchange for regular interest payments (known as the coupon) and the promise that your original investment will be repaid at the end of a fixed period.
As an example, imagine the UK government issues a 10-year bond for £100 with a £5 annual coupon. You’ll receive £5 each year for 10 years, then get your £100 back at the end (assuming the government doesn’t default on its debt). Sounds straightforward, but there’s a twist: while the coupon is fixed, the price of the bond is not. Bond prices move up and down in the market, and that movement affects the yield you can expect. When bond prices rise, yields fall; when prices fall, yields rise. This inverse relationship can seem weird at first, but it’s a core feature of how bonds behave.
In the above example, suppose the bond’s price falls to £90. The regular coupon is still £5 a year, so someone buying in at this level receives an annual income yield of 5.56% (£5 divided by £90). In addition, if held until maturity, the investor can expect to receive £100, also therefore bagging a £10 capital gain.
Why
do bond prices change?
There are several reasons bond prices fluctuate. The most important is interest rates, or more exactly, interest rate expectations. When central banks like the Bank of England raise rates, that makes the coupons on existing bonds less attractive. Their prices fall accordingly. Conversely, when rates drop, existing bond coupons become

more appealing, investors buy in, and prices rise. Other factors also come into play too. Inflation is the nemesis of conventional bonds, which pay a fixed income, so unexpected inflationary periods can cause bonds to sell off. Investors also assess the ability of bond issuers to pay back their debt, be they governments or companies. A rise in the perceived risk of default can lead to bond yields rising.
Bond supply also matters. If a government is borrowing lots of money, and issuing lots of bonds, that increases supply and will push down prices, other things being equal. The appeal of other assets is another factor. In times of market stress, investors often flock to government bonds in what’s known as a flight to safety, pushing prices up and yields down.
The main types of bonds
The bond market is both vast and varied. At the heart of it lie government bonds, which are issued by national governments to fund spending that isn’t covered by taxes and other income. In the UK these bonds are known as gilts. The UK government has never formally defaulted on its debt, so gilts are considered very low risk. Other governments also issue bonds, from the ultra-safe US treasuries to riskier emerging market debt from developing nations. The latter typically offers higher yields to compensate for the greater chance of default.

Companies issue bonds too, allowing them to borrow directly from investors rather than just banks. These are divided into two broad groups. Investment-grade bonds are issued by financially solid companies with strong credit ratings, a score which reflects an evaluation of a company’s ability to pay back its debt by agencies like S&P and Moody’s. These bonds offer lower yields but come with less risk than the second category, high-yield bonds, which are issued by firms with weaker credit ratings. As the name suggests, higher yields have to be offered by these companies to compensate investors for the higher risk involved. There are other types of bonds like inflationlinked bonds, supranational bonds and assetbacked bonds which are huge markets, but which are more specialist or complex.
Why do bonds matter so much?
Bonds underpin almost everything in finance. Government borrowing costs directly affect taxes, spending, and economic policy. Corporate bonds influence how businesses fund themselves. Pension funds, insurers, and banks rely on bond markets to generate stable returns.
The mini-Budget turmoil in 2022 showed just how powerful bonds can be. When gilt yields spiked, borrowing costs surged, mortgage rates jumped, and pension funds were forced to sell assets to cover losses. Our chancellor and prime minister were forced out of office. What happens in the bond market rarely stays in the bond market.
Why invest in bonds?
For UK retail investors, bonds can play several roles; generating income, providing diversification from an equity portfolio, and serving as a potential safe haven in turbulent times. But they’re not risk-free. Prices fluctuate with interest rates, inflation, and the financial health of borrowers. That said, if you hold to maturity, you get your promised interest and capital back, as long as the issuer doesn’t default.
Bonds may seem dull compared to the drama of the stock market, but they’re a vital part of the financial system, and now yields have risen way above the near zero interest rates we saw in the 2010s; they may be worth more than just a casual look.

By Laith Khalaf AJ Bell Head of Investment Analysis

Listen for more on bonds
You can access a free AJ Bell Money & Markets Deep Dive podcast in the usual places which delves into the world of bonds in more detail.

Ask Rachel: Your retirement questions answered
What will happen to my pension if I move abroad?
Ask the experts
Rachel Vahey is here to answer questions on pensions.
If you’d like a question considered for a future edition send it in now.
Three years ago, we bought property in Spain, and since our retirement last year, my husband and I are currently dividing our time between the UK and Spain. However, this is a temporary arrangement, and we want to move out there permanently in the next two to three years.
We know this is a big move, and have been speaking to different tax advisers about the consequences for our finances
I took my tax-free cash from my main work private sector defined benefit pension scheme last year and started to take an income from the pension scheme. I also have a SIPP that I haven’t touched yet.
What should I be thinking about when working out how and when I could access my SIPP?
Thanks, Alison

Rachel Vahey, AJ Bell Head of Public Policy,
says:
Moving permanently to Spain will, as you have already identified, have a massive effect on your personal finances, and you are right to be approaching this change by getting the right information and advice you need at this difficult time.
Becoming tax resident in another country is a fiendishly complicated process. You should

be talking about your whole range of financial concerns to a professional adviser who has experience with both UK and overseas tax law and other matters and can help you through this process.
What will it mean for your pension specifically?
As part of this information gathering process, you will need to think about implications for your pensions. You are already receiving a pension from your defined benefit scheme. They will continue to pay this, but most schemes will want to pay in UK sterling into a UK bank account. It may be worth asking the scheme if they would be prepared to pay into an overseas bank account. Either way, you will have to bear the risk and cost of converting the sterling into euros.
If you want to take an income from your SIPP, then it’s likely the provider will want to pay it into a UK bank account, but again you should check their position.
In both situations, usually, the pension scheme deducts any UK income tax before paying out the pension income. However, if you become

resident overseas for tax purposes, the taxation of the payment will be determined by the double taxation agreement in force between the two countries.
You should complete a DT-Individual form to arrange the correct taxation. In some situations, this may mean your pension scheme pays the income gross and it’s taxed in the country of residence. You will need to make sure you fill in the correct HMRC form – P85 – and that this results in an NT code being issued to your pension providers.
An alternative is to transfer your SIPP to a provider that offers more options to overseas residents; whether that is regarding payment or managing funds while you are not in the UK.
What is a QROPS and why is it relevant?
In theory, you may also be able to transfer your SIPP to a Qualifying Recognised Overseas Pension Scheme (QROPS). This is an overseas pension scheme that operates in a similar way to UK schemes and is registered with HMRC. Transfers to a QROPS could be subject to an ‘Overseas Tax Charge’ of 25% of the transfer value.
However, you might be able to avoid this if the QROPS is based in the same country as you are. Unfortunately, there is only one Spanish scheme which is registered with HMRC so this may not be an option for you. Generally, if someone is thinking about using a QROPS then before they transfer they should check how the
QROPS works – the features it offers, and the charges involved.
You say you have not yet accessed your SIPP. You therefore have a choice whether to access it here or when you are resident overseas. If you access it when you are non-resident then be aware that generally many overseas territories don’t recognise pension tax-free payments, and you may lose the advantage of your tax-free cash. If that’s the case, it will make more sense to take your tax-free cash before you move.


Shares magazine is published by AJ Bell, authorised and regulated by the Financial Conduct Authority. It’s here to inform, not to give personal advice. Please don’t base your investment decisions on it alone. If you’re unsure, speak to an independent adviser. And remember: past performance isn’t a guide to the future. Tax benefits depend on your circumstances and tax rules may change.