Second Annual Report
Water Quality and Marine Ecosystem Health Indicators: Developments of Statistic Models for Integral Assessment.
Juan G. González. Ph.D.
Resource Center for Science and Engineering. University of Puerto Rico. Mayagüez Campus.
Daniel L. McGee. Ph.D.
Department of Mathematics. University of Puerto Rico. Mayagüez Campus.
Alfredo E. Sanjuan. Ph.D.
Department of Marine Science. University of Puerto Rico. Mayagüez Campus.
1. INTRODUCTION
Anthropogenic disturbances of coastal waters and its associated increase in eutrophication have resulted in worldwide changes in coastal ecosystems (Paerl, 2000). Eutrophication of coastal ecosystems generally triggers ecological changes that decrease the biological diversity of bays and estuaries. Its effects include Nutrient overenrichment detrimental to the health of coral reefs and the diversity of life supported by seagrass and kelp communities. These changes in primary producers alter ecosystem physical structure, food webs, and higher trophic level production and can represent a severe threat to the health of coastal ecosystems (Nixon, 1995).
The ecosystem of La Parguera in the Western Caribbean contains some of the richest and most varied tropical marine habitat in the Caribbean area. It is home to the Bioluminescent Bay of Puerto Rico, coral reefs, sea grass beds, and some of the most extensive mangrove bays and channels in the world. The diversity of marine fauna associated with this unique area is well documented (Margalef, 1961). Recently, changes have been observed in this tropical marine ecosystem indicating that more research is
needed if we are to preserve this invaluable and unique ecosystem. In order to proceed with this research, systematic studies of ecosystem health indicators in this environment are needed.
Sensitive and cost-effective tools to measure ecosystem changes due to human activities have been developed and indicate that the region may be at risk. However, an appropriate statistical study of these tools and of the distribution of ecosystem health indicators throughout the region has not yet been done. Such a study would be an important aid to researches in this field.
A comprehensive program of monitoring, interpretation, and modeling should be coupled to eutrophication management strategies. The results of a statistical modeling in tropical marine ecosystems would be first of value for their content and secondly for the development of designs to produce unbiased estimates of the condition of ecological resources and comparative ranking of anthropogenic stress to resources (EMAP, 2001)
As a first step toward achieving this model, uring the first year of this project we have used bioinformatics and statistics methodology to significantly reduce the number of variables needed to measure eutrophication and health of tropical coastal marine ecosystems. This will allow us to significantly reduce the number of tests that need to be performed when conducting environmental studies in La Parguera.
This reduction of the number of variables we need to measure will greatly improve our capability to produce models associated with these variables as we will not need to perform nearly as many tests at a given location. Furthermore, this reduction in the number of tests that need to be done may impact many other studies in tropical regions. More extensive studies over wider areas, which were formerly impossible due to the number of tests required, may become possible and existing studies may be able to expand the number of data samples they can incorporate. The models and the maps such studies may produce should provide particularly sensitive and telling indicators of ecological disturbances in coastal ecosystems.
2. OBJECTIVES
Based on previous studies (GESAM, 1996) the likely causes for environmental changes that have been documented in La Parguera are:
1.Excessive nutrients, which may come from sewage discharged from the regional waste treatment plant (Corredor and Morell, 1994). Sewage has been identified as one of most significant pollutants affecting the coastal environment (Ludwig, 1990). The ecological and public health problems posed by discharges of sewage needs to be examined on a short and longterm basis for its mitigation and eventual control.
2.Sedimentary material, a considerable amount of particulate material is introduced every year into the coastal area by run-off; most of the suspended and dissolved materials carried by this method are controlled by natural geochemical process. However, these loads have been
drastically increased by deforestation, urbanization, and agricultural activities (Hunter and Arbona, 1995).
3.Oil discharges that may come from vastly increased boat usage in the region (Nemeth, 1998).
All of these factors can affect the homeostatic capacity of tropical coastal ecosystems. They can induce increased algal growth and exacerbate hypoxia or anoxia in the water column (Libes, 1992). The ecological effects of this phenomenon include increased turbidity, shifts in macroalgal communities, shift in phytoplankton community composition, loss of submerged aquatic vegetation, potentially harmful algal blooms, loss of organisms through death, reduced diversity, abundance and biomass, and in some instances loss of fishery resources (Rabalais, 2000). However, to fully know the effects, the appropriate ecological data from the carefully designed process of sampling and analyses that this project will produce will be very helpful.
There are two sets of variables that we use in our project: Indicators of anthropogenic eutrophication and indicators of the ecological health of a tropical marine ecosystem. Our project uses standard variables to monitor the ecological effects of overenrichment in a coastal environment (GESAMP, 1996).
The basic goals for the entire project can be summarized with the following:
4.Find the minimum number of variables needed measure eutrophication and ecosystem health of tropical marine environments.
5.Create models and maps which will allow assessment of eutrophication and health of tropical waters, with the minimum number of observations and measurements.
6.Assess the environmental and public health hazards (i.e. chemical eutrophication) of The Phosphorescent Bay in La Parguera and provide this information to the community
7.Improve the training and experience for young scientific in the methods and techniques of modern oceanography and environmental statistic with directly impact to students in SEM fields that they will become scientists and pursue graduate studies.
During The second year of our study our goal was to create maps of ecological indicators for the phosphorescent bay of Puerto Rico.
3. METHODOLOGY
3.1 Overview
During the first year of the project, we established the minimum necessary requirements to assess the ecological health of a coastal marine ecosystem and created the necessary models to map indicators of contamination to indicators of eutrophication.
During the second year of the project, we created maps for environmental variables in the phosphorescent bay of Puerto Rico.
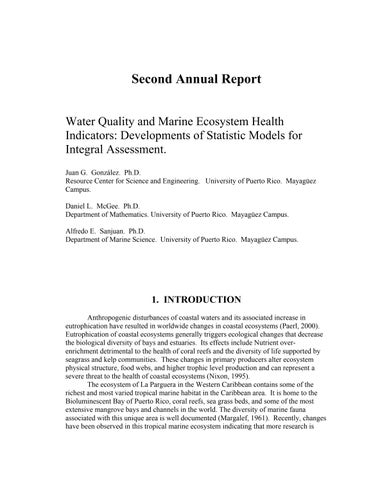
3.2 Selection of Testing Sites
The testing sites for our maps of ecological indicators were selected using a standard hexagonal scheme (Ripley, 1981). Practical considerations and drift created a certain variance from the designed scheme when the tests were taken on site. The locations selected for the sites ended up being the following.
It should be noted that test site 13 was taken independently of the design scheme at the approximate center of the phosporescant bay. However, while it was not part of the design scheme, the addition of data from an extra location cannot hurt the quality of our maps, so it was correspondingly included.
3.3 Laboratory Analysis
In order to assess the water quality of a test site, we followed the following procedures. Sediment cores were taken at each test site using plastic core (30-cm long and 6.0-cm diameter) liners capped with no return valves. Organic matter and calcium carbonate and porosity content were determined by the ignition method described by
Dean (1974). Total nitrogen (TN) was determined according to Kjeldahl procedure (AOAC, 1990). Additional cores were extruded by means of centrifugation and interstitial water was used to determine dissolved ammonia according with methodology described by Strickland and Parsons (1972). Water column samples were collected from the surface and bottom of the water at each test site using a Van Dorn bottle. These samples were stored in sterile polyethylene bottles, transported to the laboratory, filtered and analyzed for ammonium as described above. We measured the temperature, salinity, pH and dissolved oxygen of each test site using a bucket thermometer, a refractometer (Biomarine, Inc. California), an Orion 801 pH/mV meter, and polarographic oxygen electrode (YSL industries). Extracted chlorophyll was measured by fluorometer techniques (Welchmeyer, 1994). Recommendations on the shelf life of samples for nutrient analyses from APHA (1998) were followed.
3.3 Mapping Ecological Variables
To map isolines for the ecological indicators in the phosphorescent bay, we placed the values for a given ecological indicator at a given longitude and latitude in three space. Cubic interpolation based on a Delauney triangulation was then used to obtain a smooth surface that passes through all of the data points. From this surface the contour maps in this report were obtained. It should be noted that we did not extrapolate data. For this reason, isolines will end abruptly in our contour maps. While extrapolating data is rather simple, we preferred to maintain the highest possible degree of confidence in our maps and correspondingly did not complete contour lines although at times the nature of the complete contour line was obvious..
4. RESULTS
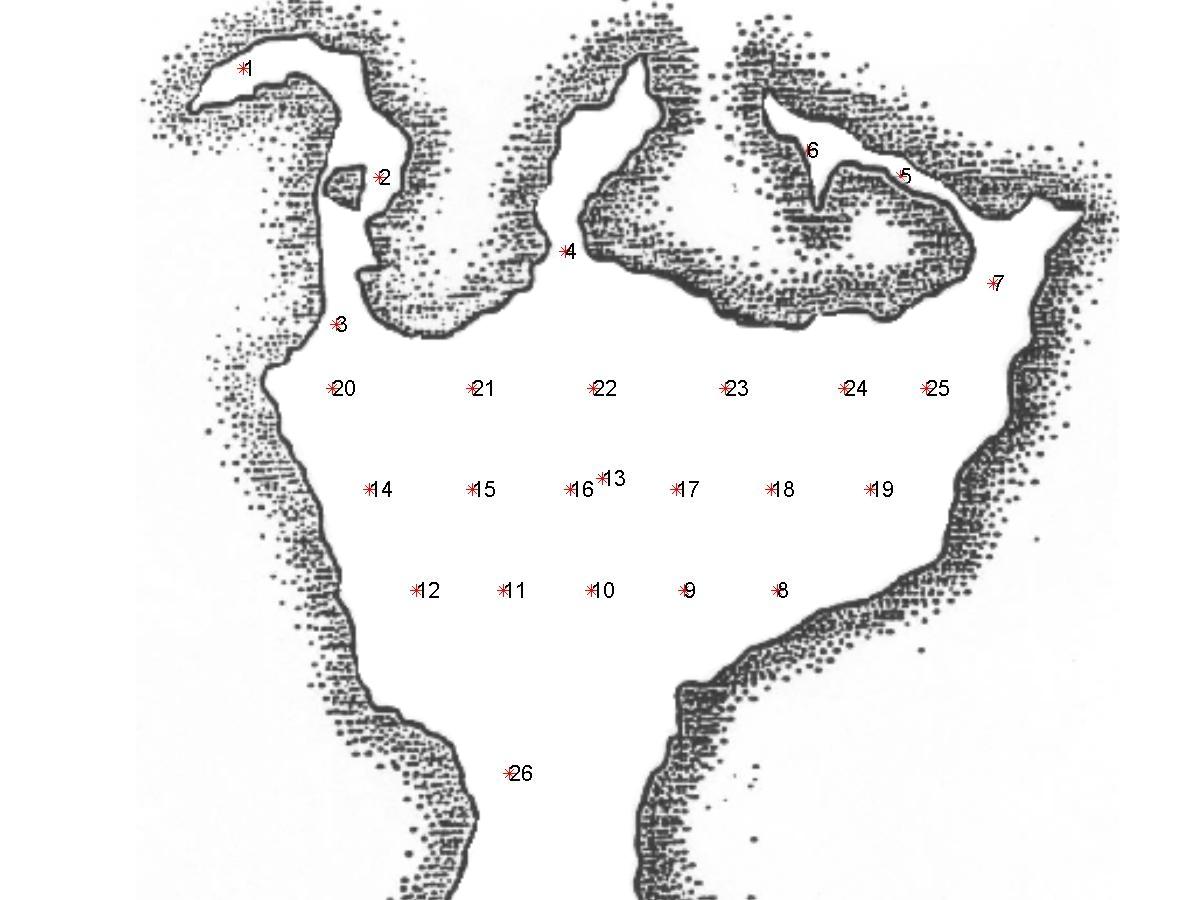
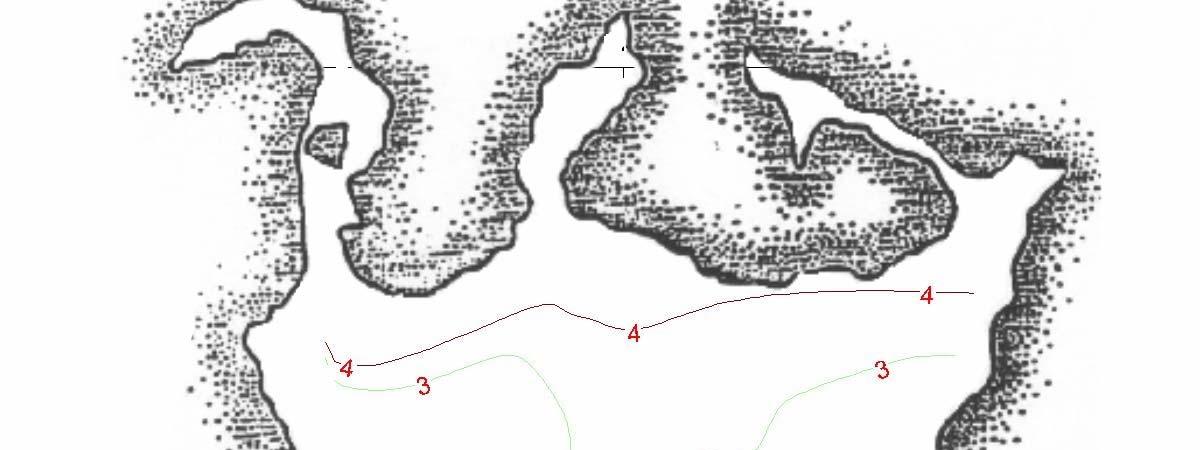
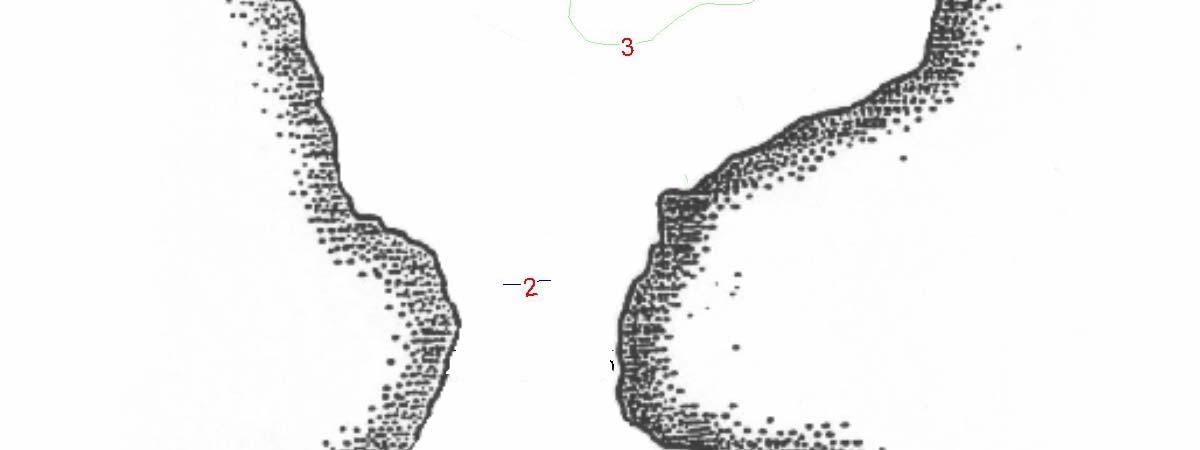
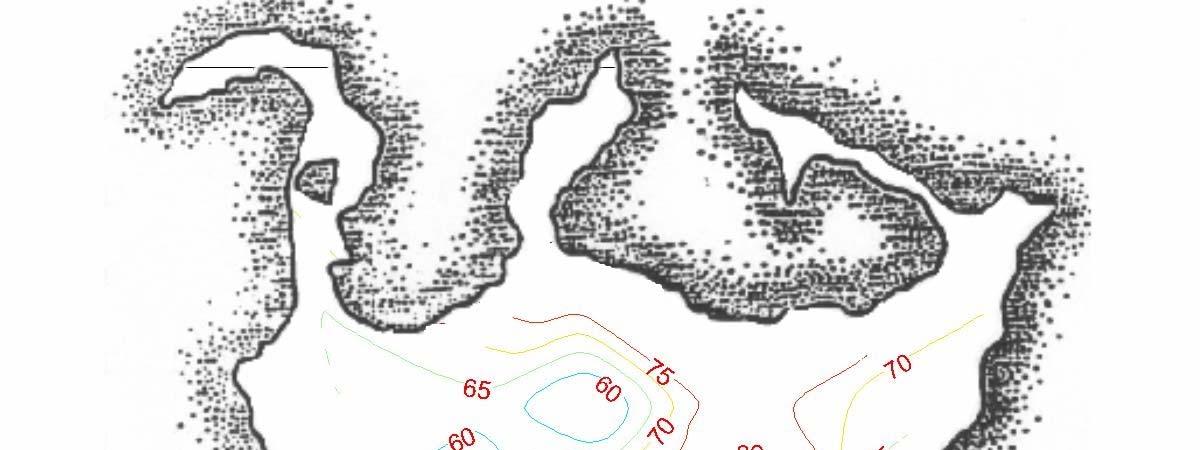
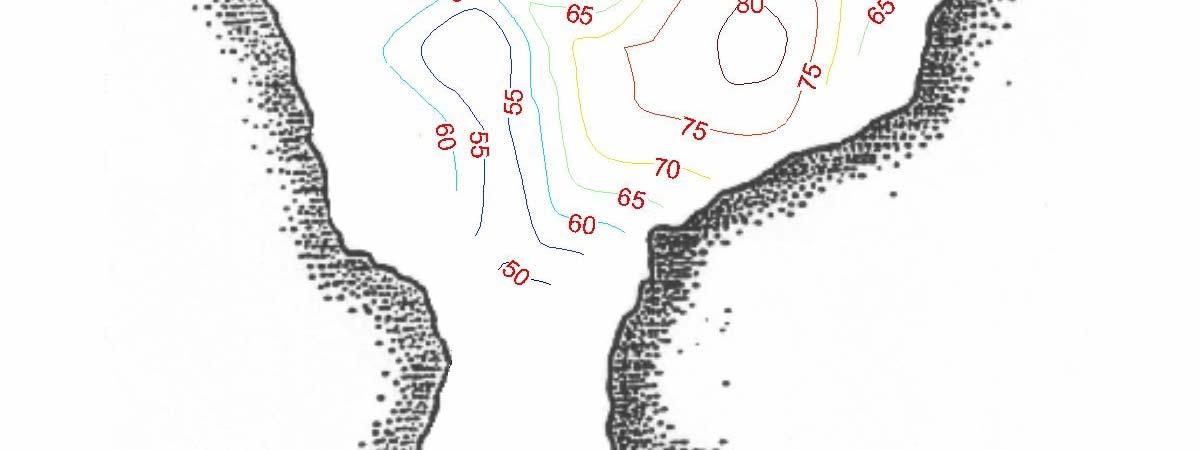
The following displays the depth of water throughout the Phosphorescent Bay. It should be noted that the commercial boats enter the bay and do a loop around the East half of the bay where the water is deepest. This is rather important as it appears to effect some of the ecological indicators that are measured below.
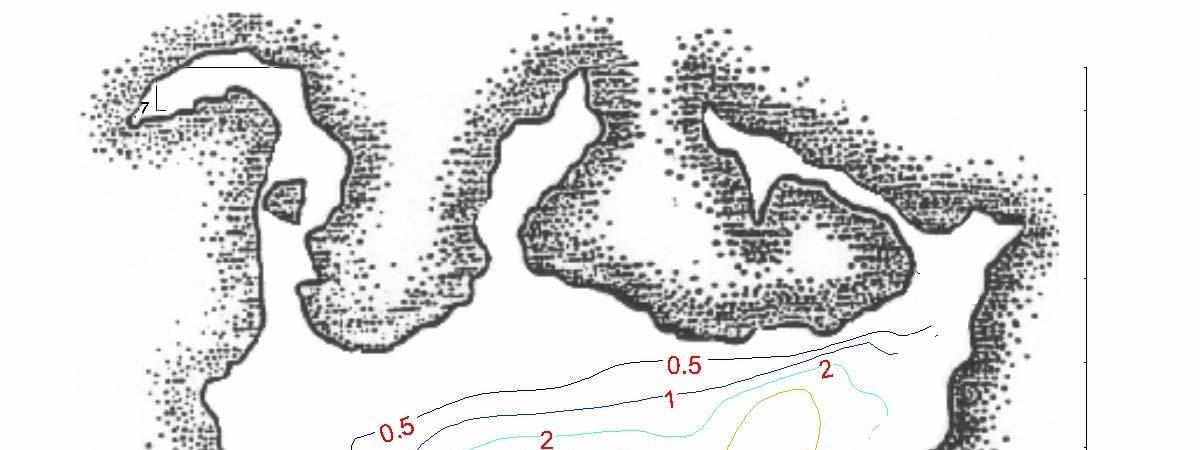
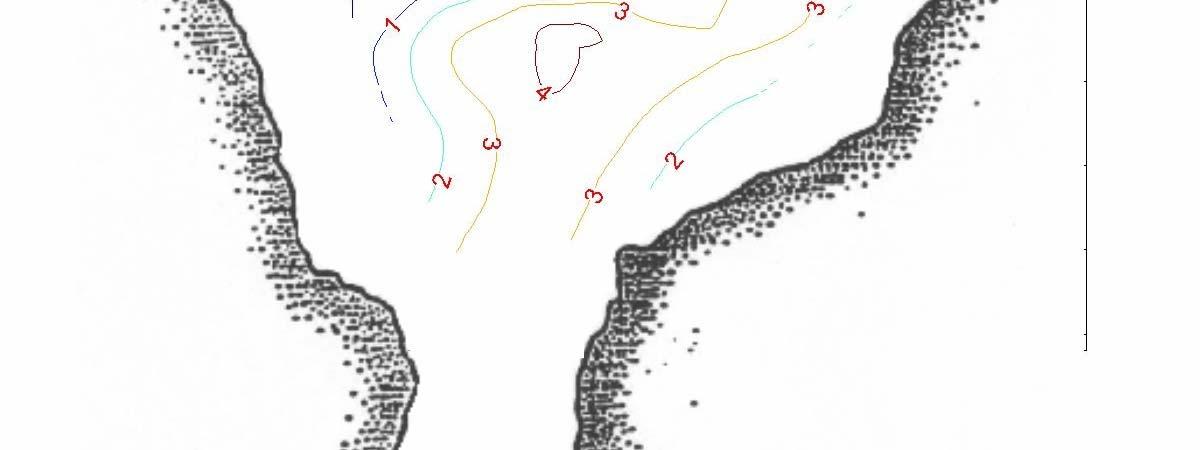
Depth of Water in the Phosphorescent Bay
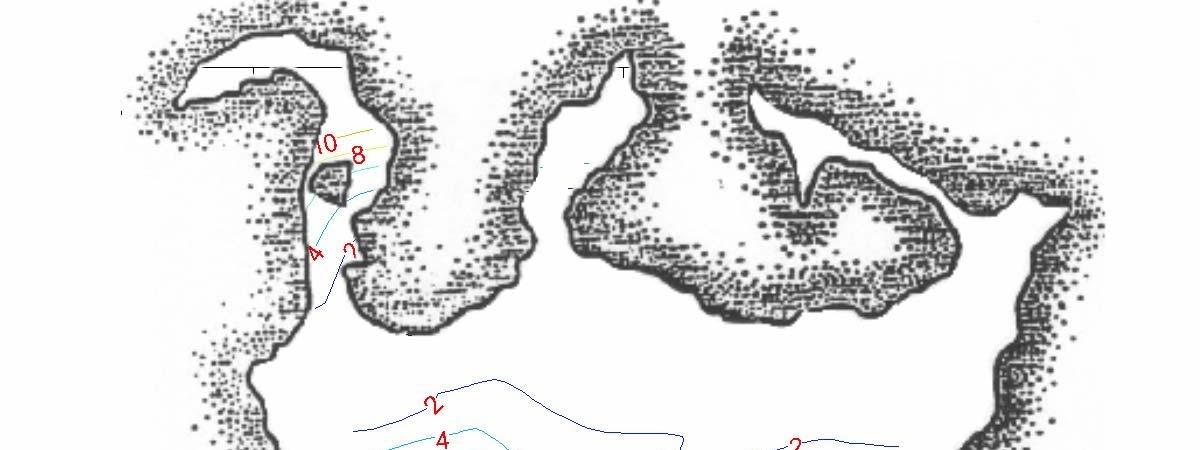
As can be seen from the following contour diagram, ammonia is densest near the north shore of the Phsphorescent Bay where there is greatest runoff and mangrove growth.
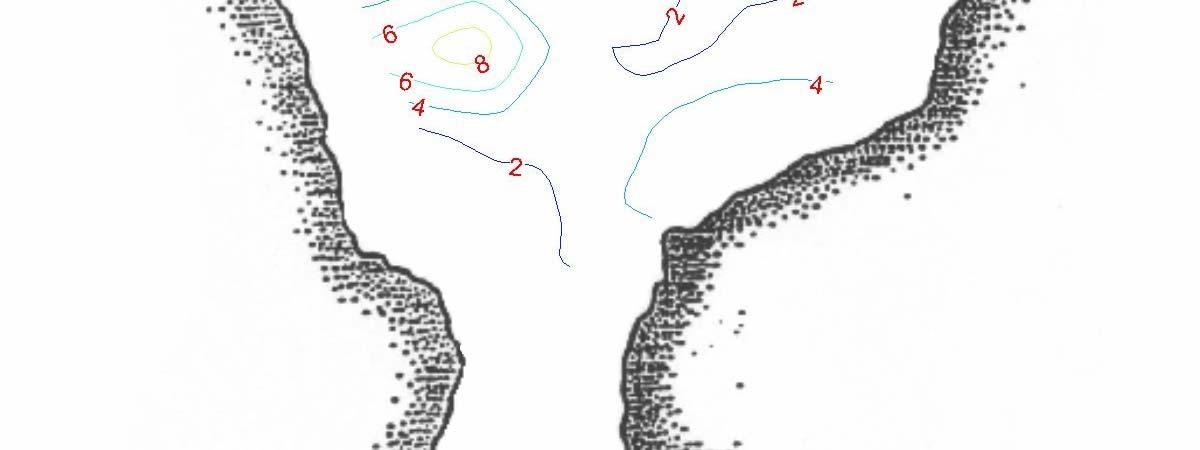
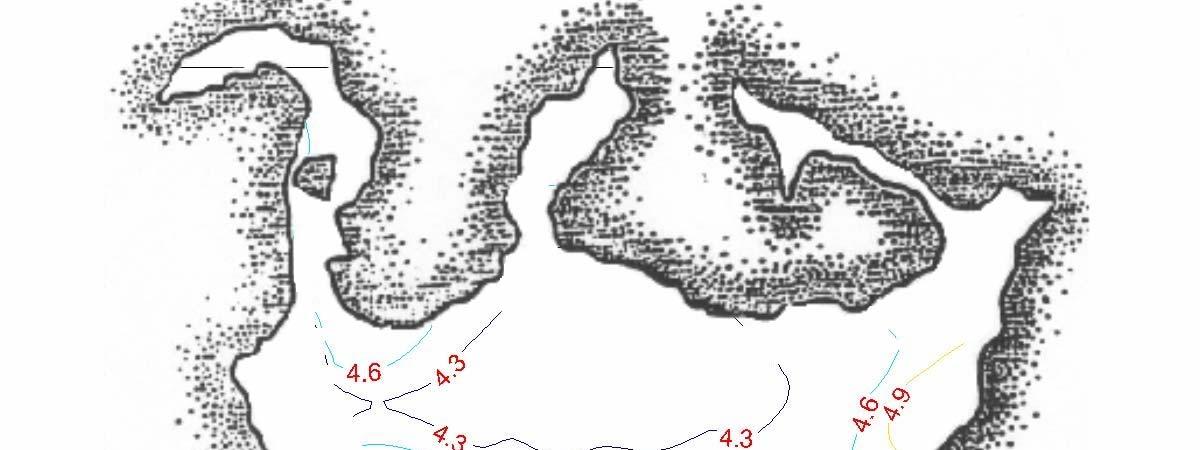
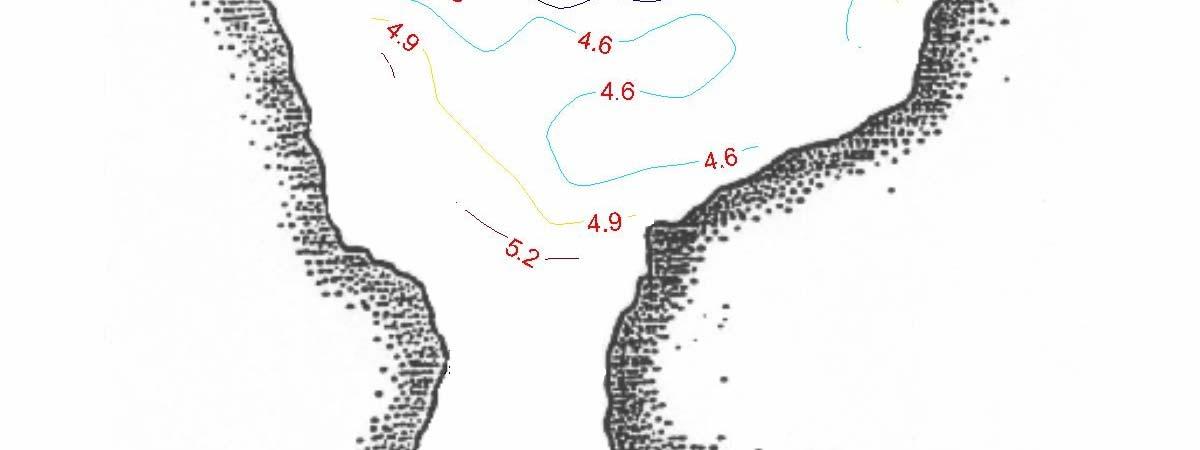
The concentration of carbonate is lowest along the trajectory of the commercial boats and along the northeast shore of the bay.
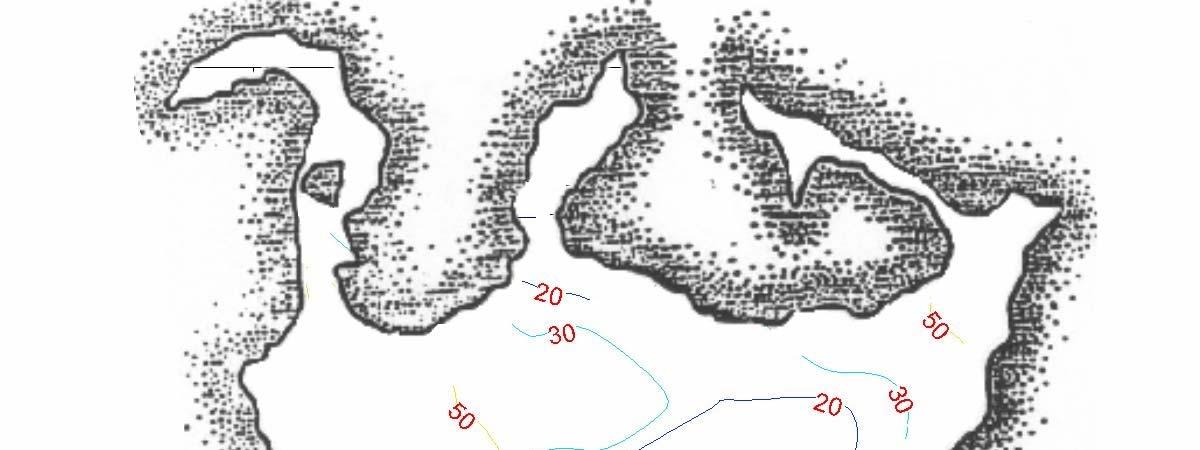
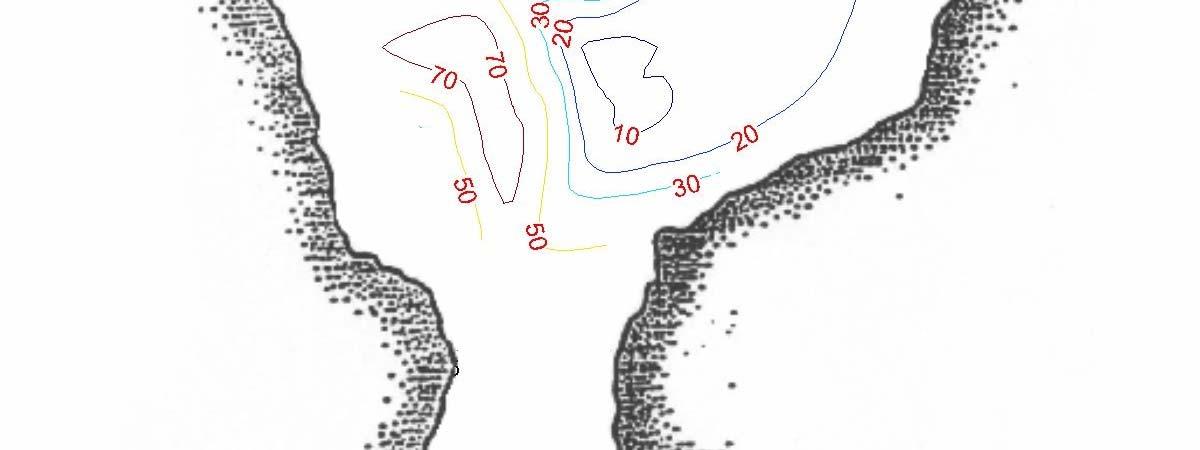
Figure: Concentration of Calcium Carbonate in the Phosphorescent Bay
The following is the concentration of chlorophyll in the Phosphorescent Bay.
Concentration of Chlorophyll in the Phosphorescent Bay
As can be seen from the following contour diagram, nitrogen is densest where there is heaviest boat traffic. It is also dense near the north shore of the Phsphorescent Bay where there is greatest runoff and mangrove growth.
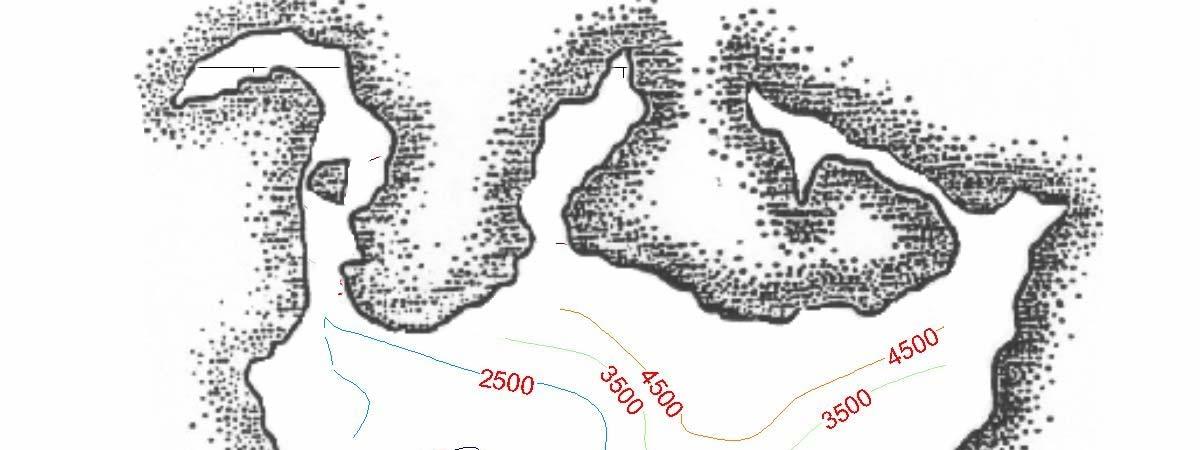
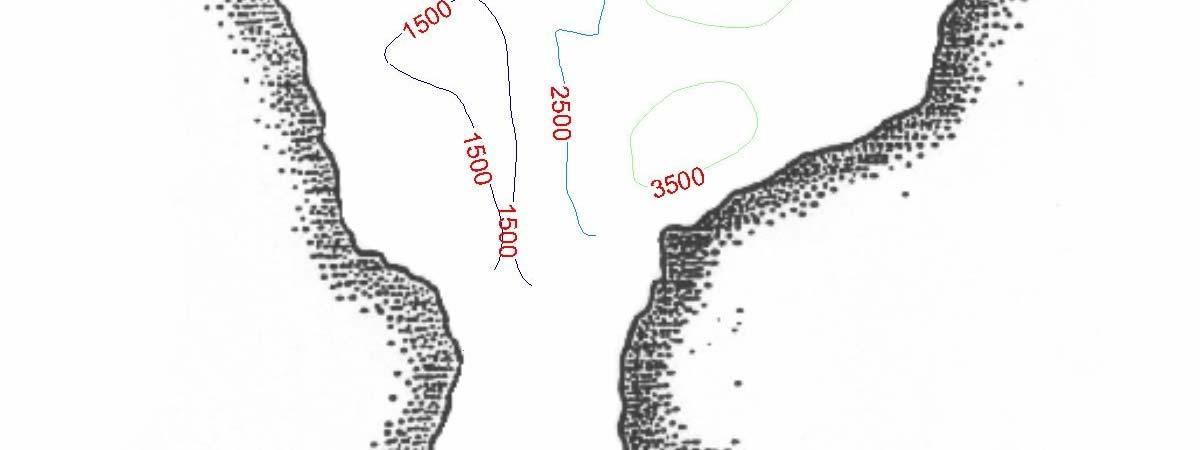
Concentration of Nitrogen in the Phosphorescent Bay
As can be seen from the following contour diagram, organic material is densest where there is heaviest boat traffic. It is also dense near the north shore of the Phsphorescent Bay where there is greatest runoff and mangrove growth.
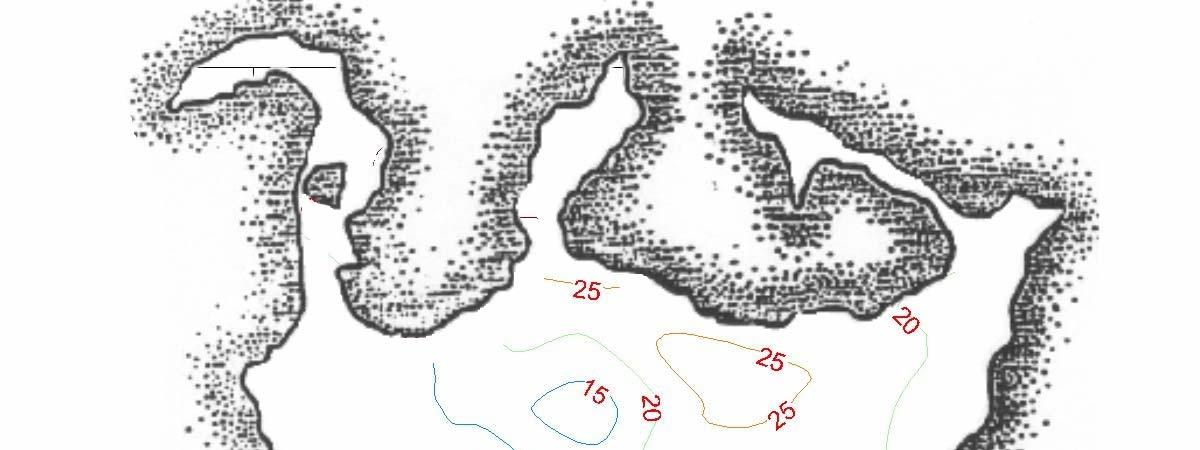
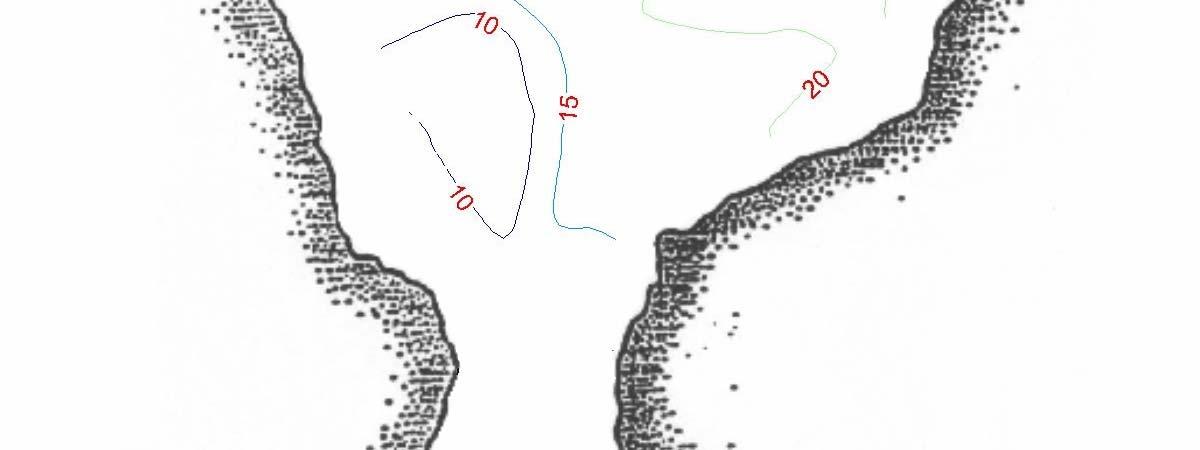
Figure: Concentration of Organic Material in the Phosphorescent Bay
The following is the concentration of oxygen in the Phosphorescent Bay.
Concentration of Oxygen in the Phosphorescent Bay
As can be seen from the following contour diagram, porosity is greatest where there is heaviest boat traffic. It is also high near the north shore of the Phsphorescent Bay where there is greatest runoff and mangrove growth.
5. CONCLUSION
We expect to continue analysis and to add temporal considerations in the coming year however the spatial data we have obtained in this phase of the project allow us to reach several important conclusions.
One of the most important elements of this data is that Nitrogen, Organic Material and Porousness are all significantly elevated along the trajectory of commercial boats and along the north shore of the phosphorescent bay where there is greatest runoff and mangrove growth.
The recent accumulation of matter in sediment that augmented porousness measurements suggest is a serious development in the ecosystem of the Parguera. Many chemical processes depend on this parameter. Along with permeability and temperature, porousness is key to remineralization of organic material, altering the diffusion rate of inorganic nutrients throughout the sediment column (Mosquera, 1998). SanJuan and Gonzalez (1999) found a similar correlation between elevated concentrations of inorganic
nutrients in sediment and significant accumulations of organic material in the Phosporescent Bay.
The alteration and resuspension of sediment due to uncontrolled motor traffic can accelerate the process of Eutrophication in the Phosphorescant Bay (Hilton and Phillips, 1992). These can obstruct feeding systems for native species and provide greater nutrients for opportunistic foreign species (Nemeth, 1998). These can provoke Harmful Algal Blooms with devastating consequences to coastal ecosystems (Anderson, 2000).
The hipoxia and other signs of Eutrophication such as growth of toxic algae and loss of marine grasses are the greatest symptoms of significant changes to coastal ecosystems (Bricker et al, 1999). The fact that the nitrogen content is greatest and the calcium carbonate content smallest along the trajectory of commercial boats is significant. Greater nitrogen content is a significant indicator of Eutrophication and diminished biodiversity (CENR, 2000) and lower Calcium Carbonate content is an indication of fewer skeletal remains and lesser biodiversity (NRC, 2000) Recent reports indicate the presence of Microcoleus lyngbyaceus in the Phosphorescent Bay (Sanjuan and González, 2000), This is also considered a primary indication of Eutrophication.
The Strategic Plan 2000-2010 of Sea Grant Program has established water quality on coastal and marine environments as a research priority. The implementation of the methodology and data obtained in our study will be a valuable tool towards achieving this goal. Our data indicate that human intervention is having a considerable impact on the Phosphorescent Bay in La Parguera and this is a cause for considerable concern. The maps that this project has produced allow us to effectively interpret and analyze the contamination and eutrophication that is occuring throughout The Phosphorescent Bay in La Parguera.
REFERENCES
Afifi, A, and V. Clark. 1996. Computer-Aided Multivariate Analysis. Chapman & Hall. CRC Press, Boca Raton, FL. 455 p.
APHA. 1998. Standard Methods for the Analysis of Water and Wastewater. American Public Health Association, American Water, Works Association, and the Water Environment Federations. Washington , D.C. 1220 p.
Association of Official Analytical Chemists. (AOAC), 1990. Officials Methods of Analysis. Williams, J. (ed.). Association of Official Analytical Chemists, Arlington, VA, 1114 p.
Bricker S., Clement, C., Doug, E., Pirhalla, S. and D Farrow. 1999. National eutrophication assessment: Effects of nutrient enrichment in the nations’s estuaries. Silver Spring, MD: NOAA National Ocean Services. 71p.
Corredor, J. and J. Morell. 1994. Nitrate depuration of secondary sewage effluents in mangrove sediments. Estuaries, Vol. 17, No. 1B. 295-300.
Corredor, J., Albaiges, J., Grimalt, J., Morell, J., Acuña, J y Gold, G. 1987. Manual Caripol Para el Análisis de Hidrocarburos de Petróleo en Sedimentos y Organismos Marinos. 24p.
Corredor,J. Morell, J., Nieves, F. and Otero E. 1985. Estudios de eutroficación en el ecosistema de La Parguera. San Juan. 12 Simposio de Recursos Naturales, 12: 15-37.
Dean, W.R. 1974. Determination of carbonate and organic matter in calcareous sediment and sedimentary rock by loss on ignition: Comparison with others methods. J. Sed. Pet. 44: 242-248.
Draper, R. and N. Smith. 1998. Applied Regression Analysis. Wiley Series in Probability and Statistics. 3rd edition John Wiley & Sons. 158p.
GESAMP (Joint Group of Experts on the Scientific Aspects of Marine Pollution). 1996. Monitoring the Ecological Effects of Coastal Aquaculture Wastes. Rep. Stud. GESAMP, (57), 38p.
Ham, F. and Kostanic. 2000. Principles of Neurocomputing for Science and Engineering. McGraw-Hill Higher Education. New York. 576 p.
Hunter J. and S. Arbona. 1995. Paradise lost: An introduction to the geography of water pollution in Puerto Rico. Soc. Sci. Med. Vol. 40, No.10:1331-1355.
Kamlet, K. 1981. The ocean as waste space: The Rebuttal. Oceanus, 24 (1): 10-17.
Libes, S. 1992. An Introduction to Marine Biogeochemistry. John Wiley & Sons, Inc. New York. 734p.
Ludwig, M. 1990. Sewage Sludge: The aquatic environmental impacts. Proc. Sewage Disposal. Ireland. 6: 16-25.
Nemeth, M. 1998. The impact of boat wakes on mangrove root epibiota. M.S. Thesis. University of Puerto Rico. RUM. 54p.
Nixon, S. 1995. Coastal marine eutrophication: A definition, social causes, and future concerns. Ophelia, 41: 199-219.
Margalef, R. 1961. Hidrografía y fitoplancton de un área marina de la costa meridional de Puerto Rico, Inv. Pesq. 18: 33-96.
McGee D, Tharp H., and R. Roemer. 1994. Feasibility of using neural networks to estimate the minimum tumor temperature and perfusion values. International Journal of Hyperthermia. 10:675-689.
Morelock, J. and L. Williams. 1988. Computer assisted coral reef survey technique. Proceedings of the Association of Island Marine Laboratories of the Caribbean 21: 65-78
Pao, Y. 1989. Adaptive Pattern Recognition and Neural Networks. Addison Wesley. Reading, MA, 222 pp.
Paerl, H. 2000. Atmospheric deposition of nitrogen Implications for nutrient overenrichment of coastal waters. Symposium on Nutrient Over-enrichment of coastal Waters: Global Patterns of Cause and Effect. National Academy of Sciences Building, Washington , DC. October, 2000. Pag. . 37.
Perez, J. 2000. A su propio riesgo la laguna del condado. El Nuevo Día. San Juan, Puerto Rico. Marzo 5 de 2000. Año XXIX. No. 10794. Pag. 8.
Rabalais, N. 2000. Multiple effects of nutrient enrichment: An overview. Symposium on Nutrient Over-enrichment of coastal Waters: Global Patterns of Cause and Effect. National Academy of Sciences Building, Washington , DC. October, 2000. Pag. 39.
Richmond, R. 1993. Coral reefs: Present problems and future concerns resulting from anthropogenic disturbances. Am. Zool. 33: 524-536.
Steindinger, K., Tomas, C., Zimba, P., Sargent, W. and R. Zondervan. 1995. Microalgaes Blooms in Florida Keys. Edge B. (ed) Proc. Coastal Zone’95: 189-190.
Strickland, J. and T. Parsons. 1972. A Practical Handbook of Seawater Analyzes. Fisheries Research Board of Canada, 310p.
Swanson, R., Champ, M., O’Connor, P., Pork, P., O’Connor, J., Mayer, G. and J. Verber. 1985. Sewage-Sludge dumping in the New York Bight Apex: A Comparation with other proposed ocean dumping sites. Wiley-Interscience, New York. In: Wastes on the Ocean, Vol. 6., 461-488
Welschmeyer, N. 1994. Fluorometric analysis of chlorophyll a in the presence of chloropyll b and pheopigments. Limnol. Oceanogr. 39 (8): 1985-1992.