remote sensing
Article

CanopyDensityandRoughnessDifferentiateResistanceofa TropicalDryForesttoMajorHurricaneDamage
QiongGaoandMeiYu*
Citation: Gao,Q.;Yu,M.Canopy
DensityandRoughnessDifferentiate ResistanceofaTropicalDryForestto MajorHurricaneDamage. Remote Sens. 2021, 13,2262. https://doi.org/ 10.3390/rs13122262
AcademicEditor:EileenH.Helmer
Received:4May2021
Accepted:7June2021
Published:9June2021
Publisher’sNote: MDPIstaysneutral withregardtojurisdictionalclaimsin publishedmapsandinstitutionalaffiliations.

Copyright: ©2021bytheauthors. LicenseeMDPI,Basel,Switzerland. Thisarticleisanopenaccessarticle distributedunderthetermsand conditionsoftheCreativeCommons Attribution(CCBY)license(https:// creativecommons.org/licenses/by/ 4.0/).
DepartmentofEnvironmentalSciences,UniversityofPuertoRico,RioPiedras,SanJuan,PR00936,USA; q.gao@ites.upr.edu
* Correspondence:meiyu@ites.upr.edu;Tel.:+1-787-764-0000
Abstract: Tropicaldryforestisvulnerabletoincreasedclimatevariabilitywithmorefrequentand severestorms.Studiesofhurricaneimpactontropicaldryforestoftenfocusedonindividualtreetraits. Howtreesintropicaldryforestsworktogethertocombatwinddamageisstillunclear.Toaddressthis, weintegratedground-observedecosystemstructurefromNationalEcologicalObservationNetwork (NEON)withairborne-LiDARimagesandanalyzedresistanceinforeststructureofGuánicadry forestinPuertoRicotomajorhurricanesin2017attheforest-standlevel.Usingeachplotinstead oftheindividualtreeasthebaseunit,weregressedmeanchangesinstemheightandfractionsof lostordamagedstemsat15plotsonmeanstemdiameter,meanandstandarddeviationofstem height,stemdensity,andtopography.Meanwhile,usingtheLiDAR-derivedcanopyheights,we comparedthechangesincanopyheightbeforeandafterthehurricanesandregressedspatiallythe canopyheightchangeonprior-hurricanetreecover,canopyheight,andrugosity.Wefoundthatthe damagewassmallinplaceswithhighstemdensityorhightreecover.Ground-observeddamage intermsofheightreductionsignificantlyincreasedwiththestandarddeviationofstemheight, anindexofroughness,butdecreasedwiththemeanstemdiameteroftheplots.LiDAR-detected damageintermsofreductionincanopyheightwasalsofoundtodecreasewithtreecoverandmean canopyheightwhenthecanopyheightwassmallormoderatebutincreasewiththerugosity.The fractionofloststemssignificantlydecreasedwiththestemdensity,andthefractionofdamaged stemssignificantlyincreasedwiththeroughnessandtheplotelevation.Thecollectiveparametersof foreststandquantifiedfromground-observationandLiDAR,suchasstemdensity,treecover,and canopyroughnessorrugosity,highlightedmutualsupportsoftreesandplayedimportantrolesin resistingdamagestothetropicaldryforestduringmajorhurricanes.
Keywords: majorhurricane;tropicaldryforest;canopydensity;surfaceroughness;canopyheight model;LiDAR;Caribbean
1.Introduction
Tropicalandsubtropicaldryforestaccountsfor42%oftheglobaltropicalandsubtropicalforestcover[1]andspansclimateregionswithannualrainfallrangingfrom250to 2000mm,annualmeanbio-temperaturegreaterthan17 ◦C,andtheannualratioofpotentialevapotranspirationtoprecipitationgreaterthan1[2].TheCstockoftropicaldryforest accountsfor8–9%oftheglobalestimate,yetthenetprimaryproductionwas620gCm 2 , whichisonlylowerthanthatofthetropicalwetforest[3,4].Therearealways2–6months ofdryseason,andthewater-limitednaturemakestropicaldryforestsespeciallysensitive toclimatevariabilityandextremeclimateeventssuchasdroughtandstorms[5–8].
Thestructureofthetropicaldryforestissubstantiallydifferentfromthatofthetropical wetandmoistforests.Thedryforesthas,ingeneral,lowertreerichnessthanwetforest, andthelowdiversityisespeciallyfoundinislandforests[1].Accordingtothenegative exponentialrelationshipbetweenroottoshootratioandannualrainfall[9],thetropical dryforesthasalargerroot:shootratio(0.57–0.71)thanmoistandwetforests(0.17–0.35)to
facilitatewaterandnutrientuptake[10],whichmighthelpresistroot–soilfailureduring strongwinds[11,12].Limitedbythehydraulictransportingcapacity,thetropicaldry forestalsohasasmallerstemheighttodiameterratiothanwetandmoistforestshave. Fordiametersintherangesof10–20cmand21–40cm,themeanheightswere11.8and 18.1mforthetropicaldryforest,14.7and23.3mforthemoistforest,and16.7and25.6m forthewetforest,respectively[13].Lowerdiversity,largerroot:shootratio,andlower height:diameter(taper,lowerslenderness)ratiomaketropicaldryforestsdifferfromwet ormoistforestsinresponseandresistancetotropicalstorms.
Resistancetotropicalstormsandrecoveryofthetropicaldryforestafterdisturbance alsodependonotherstructuralandfunctionaltraits.Forexample,wooddensitycorrelates torupturemodulusandelasticitymodulus,andhighwooddensity,associatingwith mechanicalstrength,mightindicatelesslikelythewindsnap(e.g.,trunkbreakage)but morelikelythewindthrown(e.g.,uprooting)[14].Atreespecieswithagreaterspecific leafarea(SLA)mayinterceptmorewinddragforcestorupturethestemsandbranches; however,thinnerleavesarealsoeasilytornbythewindandmaybemoreadvantageousto avoiddamagetobranchesandtrunks.Ontheotherhand,aspecieswithasmallerSLAhas alongerleaflifespan,strongerleaves,strongertieswithbranchesandtwigs,andlesslikely tosheditsleaves[15].Sincewind-inducedloadcanbeincreased2–3timeswithfoliage, comparedtothatwithoutfoliage,mechanicallystrongleavesmakethemhardtoshedand mayleadtoseveredamagetobranchesandtrunksduringstorms[16].Afterhurricane disturbance,treespecieswithgreaterSLAhaveahigherrelativegrowthrate[17].SLAand maximumheightarepositivelyassociatedwithresproutingandrecovery,whereaswood densityandslendernessarenegativelyassociatedwithresproutingandrecovery[7].
Recentstudiesemphasizedtheimportantroleofstand-levelparametersinwind damagestoforests[11,18].Hartetal.[18]foundthattherandomforestmodelsonwind damagetoforestsprovidedhighaccuracyandthediscriminatorypowerremainedhigh withtheremovalofindividual-levelcharacteristics;however,theaccuracyandthediscriminatorypowerwouldbelostifthestand-levelinformationisremoved.Compared toasingle-treesituation,treesinaclosedforeststandprovideshelteringeffectand/or mechanicallymutualsupportsduringwinddisturbance[11].MooreandLin[19]reported thatstanddensityandheight:diameterratioarethemostimportantfactorsassociatedwith winddamageintermsofbasalarealoss.Comparedtodensestands,windsinsideastand withwidelyspacedtreesarehigher[11].Foreststructurealsoaffectsitsvulnerabilityto winddamage[12].ByanalyzingtheimpactsofTyphoonSongdainnorthernJapanusing therandomforestalgorithm,Morimotoetal.[20]reportedthatthenaturalmixedforest standwithacomplexstructurewaslessvulnerabletothecatastrophicwindcomparedto the Abies plantationwithasimplestructure.
Monitoringwinddamageinforestsismostlybasedonsmall-scalegroundobservations[7,21,22]andlarge-scaleopticalremote-sensedimages[23,24].Basedonthefused vegetationindexfromSentinel-2andLandsat-8,thedynamicofforestgreenness,indicatingecosystemfunctions,wasassessedtoexplorehowtopography,drainagecapability, andlegacyofdroughtdifferentiatedtropicalecosystemresponsetoandrecoveryfrom majorhurricanes[24].Comparedtoecosystemfunctions,ecosystemstructuresshowed muchslowerrecoveryafterhurricanes[22]anddivergence[25];thus,structuralchanges arebetterindicatorsofhurricaneimpactsintheshorttolongterm.However,structural changesespeciallyatscaleslargerthanplotsarestillrareinexistingstudies.Therecent rapidadvanceinremotesensingtechnology,particularlyLiDAR,providesusnecessary dataandmetricssuchascanopyheight,cover,orrugosity[26,27]tomonitorstructural changesatalargerscaleandtoexploreunderlyingmechanismsofforestsinresponse tostorms.
TheCaribbeanregionispronetotropicalstorms.InSeptember2017,twosuccessive majorhurricanesimpactedtheregion[24,28].Recentresearchmostlyfocusedontheimpact ofhurricanesonwindwardwetandmoistforests[21],whilethestudyoftheimpacton theleewardtropicaldryforestislargelyleftuntouched.Ontheotherhand,comparedto
thetrait-basedindividual-levelstudiesmentionedabove,thequantitativerolesofstandlevelparametersoftropicaldryforest,suchasstemdensityandcanopyroughness,inthe ecosystemresistancetotropicalstormsremainunclear.
Thisstudyaimstoexplorehowthetwomajorhurricanesimpactatropicaldryforest atstandlevelbyintegratingdamagestotreesbasedontheNationalEcologicalObservation Network(NEON)groundobservationswithchangesincanopyheightwithintheforest viatheairborneLiDARobservations.Weassociatedtheimpactofthehurricanestothe ground-measuredstemdensityandstemdiameter,unevennessofthestemheight,and topographysuchaselevation,aspect,ortopographicposition,aswellastotheLiDARsensedcanopyheight,treecover,andrugosity.Wehypothesizedthatmoreunevenness ofthecanopyorrugosityandhigherplotelevationtendtobringmoredamage,whereas highertreecover,higherstemdensity,andlargerstemdiametertendtoresistthedamage. Ontheotherhand,therainbroughtbyhurricanesmayalleviatethedroughtstressduring theyearsbeforethestorms.
2.MaterialsandMethods
2.1.StudyArea
NEONGuánicasite( 66.86◦W,17.97◦N,Figure 1)islocatedwithinthedry-forestlife zoneinsouthwestPuertoRiconearthecoastoftheCaribbeanSea.Thesitehasamean annualprecipitationof860mmandameanannualtemperatureof25 ◦C[1].Guánica dryforestwasdesignatedasastateforestin1919andaUNESCOInternationalBiosphere Reservein1981.In2017,HurricaneIrmapassedbythetropicalislandPuertoRicoon 6Septemberwiththesustainingwindspeedof298kmh 1,andHurricaneMariatraversed theislandon20Septemberwith249kmh 1 atitslandfall,incurringenormousdamageto thetropicalecosystemovertheisland(Figure 1).Priortothetwohurricanes,PuertoRico experiencedaseveredroughtin2014–2016withtheisland-widewaterrationinglasting formonths[29].Historically,HurricaneGeorgesin1998andHurricaneSanFelipein1928 affectedthestructuresoftheGuánicadryforest[30].
2.2.NEONPlotGroundDataAnalysis
NEONstartedtheforeststructureobservationin2015atscatteredplots(Figure 1). The20NEONtowerplotsaredistributedclosetotheinstrumenttower,andeachplotis 40m × 40m withtwosubplotssampled,eachofwhichis20m × 20m.The20distributed plotsof20m × 20meacharescatteredinthefartherdistancebutaroundthetower.We acquiredtheforeststructureobservationsfromtheNEONsites[31],andthedatashowed thatamongthe40plots,only10distributedand5towerplotshadmeasurementsboth beforeandafterthehurricanes.Thedistributionoftheseplotsalmostcoveredallthe elevationrangesfromlowland,midslope,totopofthehill(Figure 1,Table 1).
NEONwoodyvegetationstructuralmeasurementincludesstemheight,diameter (mostlyDBH ≥ 10cm,diameteratbreastheight, https://data.neonscience.org/dataproducts/DP1.10098.001,accessedon8June2021),crowndiameter,etc.Forthisparticular sitewithsmalltreesanddensecanopyofthedryforest,i.e.,greaterthan3000stemsper hectare,stemdiameter ≥ 0.8cmweremeasured.Amongthesemetrics,stemheightand diameterweremostlymeasured.
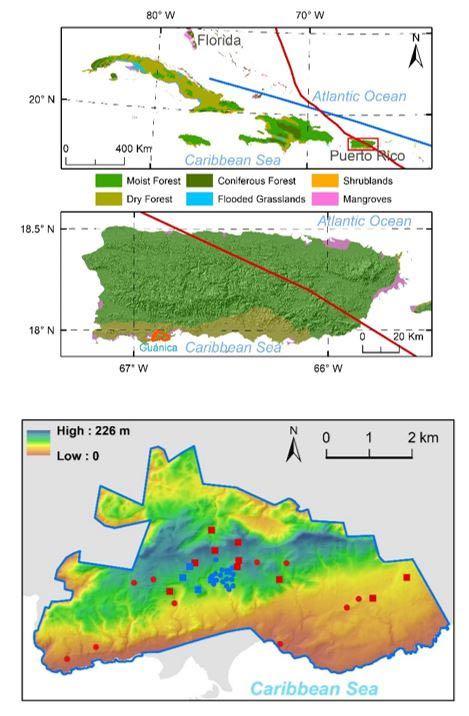
Figure1. LocationofNEONGuánicadryforestsite(upperpanel).Redandbluelinesindicatethe pathsofHurricaneMariaandHurricaneIrmainSeptember2017,respectively.Guánicadryforest siteislocatedinthesouthwestoftheisland.Distributionof20NEONtowerplots(bluedots)and 20distributedplots(reddots)ontopoftheelevationmap(lowerpanel).Squaresareplotsthathave observationsbothbeforeandafterthehurricanesin2017.
Figure 1. Location of NEON Guánica dry forest site (upper panel). Red and blue paths of Hurricane Maria and Hurricane Irma in September 2017, respectively. site is located in the southwest of the island. Distribution of 20 NEON tower plots 20 distributed plots (red dots) on top of the elevation map (lower panel). Squares observations both before and after the hurricanes in 2017.
NEON woody vegetation structural measurement includes stem (mostly DBH ≥ 10 cm, diameter at breast height, https://data.neonscience.org/data-prod-
Table1. The15plotsusedforvegetationstructuralchangeassessmentbeforeandafterthemajor hurricanesinSeptember2017.
PlotIDPlotTypeTimeBeforeTimeAfterAltitude(m)
GUAN_002DistributeAugust2015January201889.1
GUAN_003DistributeApril2016December2017182.9
GUAN_004DistributeFebruary2016January2018133.5
GUAN_008DistributeMarch–April2016January201865.8
GUAN_009DistributeMay2016January2018116.5
GUAN_010DistributeMay2016January2018177.6
GUAN_011DistributeMay2016February2018201.2
GUAN_015DistributeApril2016December2017207.8
GUAN_018DistributeFebruary2016January2018162.6
GUAN_019DistributeMay–June2016February2018131.7
GUAN_042TowerApril2017February2018146.9
GUAN_043TowerApril2017February2018115.9
GUAN_044TowerApril2017February2018147.5
GUAN_045TowerApril2017February2018145.3
GUAN_046TowerMarch2017February2018168.0
Foreachplot,weselectedthoseindividualstemslabeledwith“Live”astheplant statusandstemheightmeasuredbeforethehurricanesandcomparedwiththeirplant statusandstemheightafterthehurricanes.Wethenanalyzedthesechangesinplant statusandstemheightforeachofthe15plotsandexploredtheunderlyingmechanisms thatleadtothechanges.Theplantstatusafterthehurricanescanbegroupedintothree categories:“Live”,“Lost”,and“Damaged”,andthelattertworeflectachangeinstatus. The“Lost”categoryincludedplantstatusmarkedas“Standingdead”,“Removed”,“Lost, fateunknown”,“Dead,brokenbole”,and“Lost,presumeddead”;andthe“Damaged” categoryincludedthosemarkedas“Live,brokenbole”,“Live,physicallydamaged”,and “Live,otherdamage”.Thefivetowerplotsweremeasuredinearly2017andearly2018 (Table 1).Nineoutofthetendistributedplotsweremeasuredin2016andtheendof2017 toearly2018,andtheremainingone(GUAN_0002)wasmeasuredin2015andearly2018. Weassumethecomparisonbetweenthemeasurementsbeforeandafterismostlycaused bythemajorhurricanesinSeptember2017,buttoalessextent,bythegrowthafterthe pulserainfallbroughtbythehurricanes.
Multipleandlogistic(quasibinomial)regressionswereappliedtoexplorethepossible factorsthatcontributetothelossand/ordamageofstemsandthechangeinstemheight. Quasibinomialisoftenusedtoeliminatetheoverdispersionofageneralizedlinearmodel. Theexplanatoryvariablesareplotelevationandtopographicposition,thedensityof stems,themeanandstandarddeviationofstemheight,andmeanstemdiameter.The topographicpositionindex,representingthetopographicposition,wascalculatedasthe elevationminustheaverageelevationofacircularneighborhoodwitharadiusoffivecells.
2.3.CanopyHeightChangebyAirborneLightDetectionandRanging(LiDAR)
ChangesincanopyheightwereexaminedwiththeLiDAR-derivedcanopyheight model(CHM).TheNASAG-LiHTmissioncollectedtheLiDARimagesalongafewtransectsacrosstheGuánicadryforeston8March2017[32],andtheNEONAirborneObservationPlatform(AOP)collectedtheLiDARimagescoveringthewholesiteon28May2018. WeselectedthetransectofPR_8March_2017_45_46,whichcrossestheforestandspansall theelevationrange(Figure 2).ThesectionofthetransectwithintheNEONGuánicasitewas chosenforfurtheranalyses.TheverticalandhorizontalaccuraciesofbothNEON[33,34] andG-LiHTimages(glihtdata.gsfc.nasa.gov/,accessedon8June2021)arewithin1m. AsidefromtheCHMimages,wealsousedthedigitalsurfacemodel(DSM),digitalterrain model(DTM),topographicalslopeandaspect,andrugositybasedontheDSM.Allimages haveaspatialresolutionof1m.WeobtainedthedatafromtheNEONdataportalwiththe
“neonUtilities”RPackageandfromtheG-LiHTsite(glihtdata.gsfc.nasa.gov/,accessedon 8June2021).
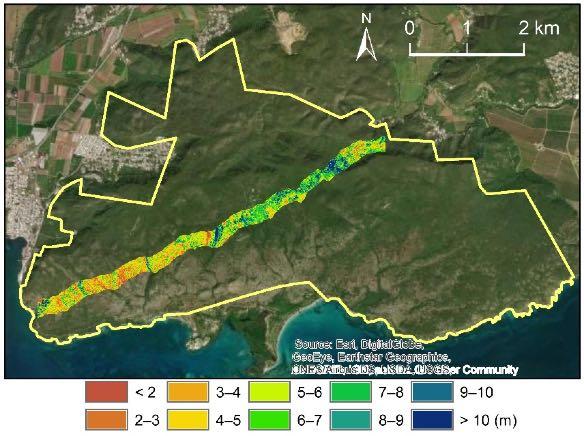
Figure2. Locationofthetransectof“PR_8March2017_45_46”flewbytheNASAG-LiHT,about7km longand280mwide.Thegreennessindicatesthecanopyheightmeasuredbeforethehurricanes.
Figure 2. Location of the transect of “PR_8March2017_45_46” flew by the NASA G-LiHT, about 7 km long and 280 m wide. The greenness indicates the canopy height measured before the hurricanes.
BoththeNEONandNASACHMwerecalibratedwiththeground-measuredstem heightoftheNEONplotslocatedwithinthetransectbeforeperformingthestatistical comparison.Stemheightsmeasuredinearly2017andearly2018(from1Januaryto 30May)wereusedtocalibratetheCHMofG-LiHTbeforethehurricanesandtheCHM ofNEONafterthehurricanes,respectively.Changesincanopyheightwereobtainedby subtractingthecalibratedCHMbeforethehurricanesfromthecalibratedCHMafterthe hurricanes.Wealsocalculatedthetreecoverastheproportionofpixelswithcanopyheight above2m.Changesincanopyheight,togetherwiththeprior-hurricaneCHM,DSM,slope, aspect,treecover,andrugosity,wereaveragedforagridof50mwithinthetransect.
Aspatialerrormodelwasthenappliedtofindwhetherandhowthecanopyheight changedependsontheprior-hurricanecovariablesincludingtopography.Thespatial errormodel[35]considersthespatialautocorrelationoferrorofalinearregressionmodel asfollows:
Both the NEON and NASA CHM were calibrated with the ground-measured stem height of the NEON plots located within the transect before performing the statistical comparison. Stem heights measured in early 2017 and early 2018 (from 1 January to 30 May) were used to calibrate the CHM of G-LiHT before the hurricanes and the CHM of NEON after the hurricanes, respectively. Changes in canopy height were obtained by subtracting the calibrated CHM before the hurricanes from the calibrated CHM after the hurricanes. We also calculated the tree cover as the proportion of pixels with canopy height above 2 m. Changes in canopy height, together with the prior-hurricane CHM, DSM, slope, aspect, tree cover, and rugosity, were averaged for a grid of 50 m within the transect.
A spatial error model was then applied to find whether and how the canopy height change depends on the prior-hurricane covariables including topography. The spatial error model [35] considers the spatial autocorrelation of error of a linear regression model as follows:
= + = +
y = xβ + uu = λWu + where y isthedependentvariablerepresentedasann × 1matrix(n,numberofcasesin thedataset), x isoneormultiple(m)independentvariablesrepresentedbyann × pmatrix withp=m+1, β isap × 1coefficientmatrixtobeestimated,and u isann × 1spatialerror matrix. W isann × nweightmatrixdeterminedbytheneighborhoodstructure, λ isthe spatialautocorrelationcoefficient,and ε isthenormali.i.d.(independentandidentically distributed)residual.
Beforeproceeding,weaveragedallthesevariablesovera50m × 50mgrid.Wethen dividedcanopyheightchangebythecanopyheightpriortothehurricanestoobtainthe relativeheightchange(∆hcr),calculatedafunctionofaspectas
where y is the dependent variable represented as an n×1 matrix (n, number of cases in the dataset), x is one or multiple (m) independent variables represented by an n × p matrix with p = m + 1, β is a p × 1 coefficient matrix to be estimated, and u is an n × 1 spatial error matrix. W is an n × n weight matrix determined by the neighborhood structure, λ is the spatial autocorrelation coefficient, and ε is the normal i.i.d. (independent and identically distributed) residual.
f (α) = cos(α π/4)
Before proceeding, we averaged all these variables over a 50 m × 50 m grid. We then divided canopy height change by the canopy height prior to the hurricanes to obtain the relative height change (Δℎ ), calculated a function of aspect as
=−cos − /4
with α astheaspectangle,andnormalizedrugosity(r),elevation(Z),andcanopyheight(h) to[0,1]range.Treecoverisalreadyintherange,andcosineofaspectisintherangefrom 1to1.Wethenregressedspatiallytherelativecanopyheightchangeonthenormalized covariateswiththespatialerrormodel.Thespatialcorrelationoferrorswasdefinedwithin eightnearestneighboringgridcells.VariableswereselectedwiththeANOVAmodel
with α as the aspect angle, and normalized rugosity (r), elevation (Z), and canopy height (h) to [0,1] range. Tree cover is already in the range, and cosine of aspect is in the range from 1 to 1. We then regressed spatially the relative canopy height change on the normalized covariates with the spatial error model. The spatial correlation of errors was defined within eight nearest neighboring grid cells. Variables were selected with the ANOVA model comparison. Data preparation and analyses were performed in ArcGIS
comparison.DatapreparationandanalyseswereperformedinArcGIS(ESRI,Redlands, CA,USA)andR[36].ErrorassessmentwasperformedusingR2 forthemultivariate regressionandthespatialerrormodelandusingtheresidualdevianceversusthenullmodel(modelwithinterceptonly)devianceforthequasibinomialregression.
3.Results
3.1.MeanChangeinStemHeightatPlotLevel
(ESRI, Redlands, CA, USA) and R [36]. Error assessment was performed using R2 for the multivariate regression and the spatial error model and using the residual deviance versus the null-model (model with intercept only) deviance for the quasibinomial regression.
3. Results
3.1.
Mean Change in Stem Height at Plot Level
Themeanheightchangeinthe15plotsshowedthatthereduction(negativechange) prevailed(Figure 3)overthestimulatedgrowthbythepulserainfallbroughtbythe hurricanes,11outof15plotsexhibitingareductioninmeanstemheightand7ofthem beingsignificant(t-testat α =0.05).Theaveragemeanheightchangeatplotlevelwas 0.14mwithastandarddeviationof0.22m.Theregressionofthemeanheightchangeon topography,stemdensity,meanstemdiameter,meanstemheight,andstandarddeviation ofthestemheightmeasuredbeforethehurricanesresultedintheequationviaastepwise selectionofindependentvariablesasfollows:
h = 0.27(
The mean height change in the 15 plots showed that the reduction (negative change) prevailed (Figure 3) over the stimulated growth by the pulse rainfall brought by the hurricanes, 11 out of 15 plots exhibiting a reduction in mean stem height and 7 of them being significant (t-test at α = 0.05). The average mean height change at plot level was 0.14 m with a standard deviation of 0.22 m. The regression of the mean height change on topography, stem density, mean stem diameter, mean stem height, and standard deviation of the stem height measured before the hurricanes resulted in the equation via a stepwise selection of independent variables as follows:
where ∆h isthemeanstemheightchangewithnegativevaluesfordamage, sh isthestandarddeviationofstemheightwithintheplot,and D isthemeanstemdiameter.Standard errorsoftheestimatedparametersareshownintheparentheses.Theregressionyieldedan R2 of0.59,andallthecoefficientsandtheF-statisticweresignificant (p-value<0.05) sh is ameasurementofcanopyunevennessconnectingtothesurfaceroughness.Theequation impliesthattheroughnessofthecanopytendstobringmorereductioninstemheight, whereasplotwithtreeshavinggreaterstemdiameterstendstoresistthereductionin stemheight.Poolingtheindividualstemsfromallthe15plots,wefoundasignificant correlationcoefficientof0.157betweentheheightchangeandthestemdiameterbeforethe hurricanes,whichmeansthelargerthestemdiameter,thelessreductionwasobservedin height.Positivechangesinplots04,08,43,and44showedthatthepost-hurricanegrowth benefitedfrommoisturebroughtbythestormsexceededtheminorhurricanedamagein theseplots(Figure 3).
=−0.27 ±0.112 −0.264 ±0.1 +0.094 ±0.022 (1) where Δℎ is the mean stem height change with negative values for damage, is the standard deviation of stem height within the plot, and is the mean stem diameter. Standard errors of the estimated parameters are shown in the parentheses. The regression yielded an of 0.59, and all the coefficients and the F-statistic were significant (p-value < 0.05). is a measurement of canopy unevenness connecting to the surface roughness. The equation implies that the roughness of the canopy tends to bring more reduction in stem height, whereas plot with trees having greater stem diameters tends to resist the reduction in stem height. Pooling the individual stems from all the 15 plots, we found a significant correlation coefficient of 0.157 between the height change and the stem diameter before the hurricanes, which means the larger the stem diameter, the less reduction was observed in height. Positive changes in plots 04, 08, 43, and 44 showed that the posthurricane growth benefited from moisture brought by the storms exceeded the minor hurricane damage in these plots (Figure 3).
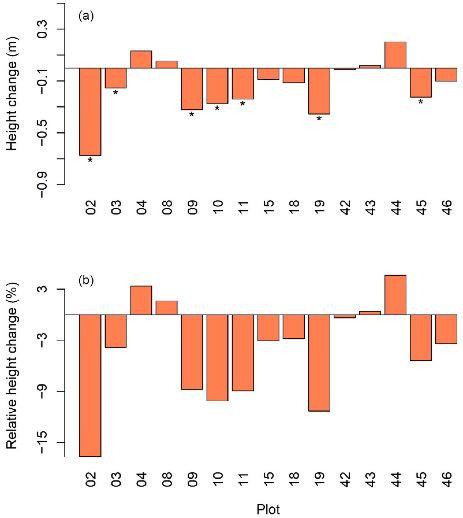
Figure3. (a)Meanchangesinstemheightinthe15plots.The“*”underthebarindicatessignificant decreaseat α =0.05;(b)relativemeanheightchange.
Figure 3. (a) Mean changes in stem height in the 15 plots. The “*” under the ba decrease at α = 0.05; (b) relative mean height change.
3.2. Lost and Damaged Stems
3.2.LostandDamagedStems
Thenumberofaffectedstems(Figure 4),includingthecategoriesof“Lost”and “Damaged”,showedawiderangeofvariationwiththemean ± standarddeviationas 4 ± 3.7 forthenumberofloststemsandas4.6 ± 4.1forthenumberofdamagedstems.The meanofthelostplusdamagedstemswas8.6(±4.9).Theproportionoflostordamaged stems,thatis,thenumberoflostordamagedstemsdividedbythetotalnumberofstems oftheplot(Figure 4 lowerpanel),showedthatthemean ± standarddeviationofthe fractionoftheloststemandthatofthedamagedstemwere2.2% ± 1.7%and2.3% ± 1.9%, respectively.Onaverage,4.5%ofplantstemswereaffectedbythehurricanes.
The number of affected stems (Figure 4), including the categories “Damaged”, showed a wide range of variation with the mean ± standard 3.7 for the number of lost stems and as 4.6 ± 4.1 for the number of damaged mean of the lost plus damaged stems was 8.6 (± 4.9). The proportion stems, that is, the number of lost or damaged stems divided by the total of the plot (Figure 4 lower panel), showed that the mean ± standard deviation tion of the lost stem and that of the damaged stem were 2.2% ± 1.7% respectively. On average, 4.5% of plant stems were affected by the hurricanes.
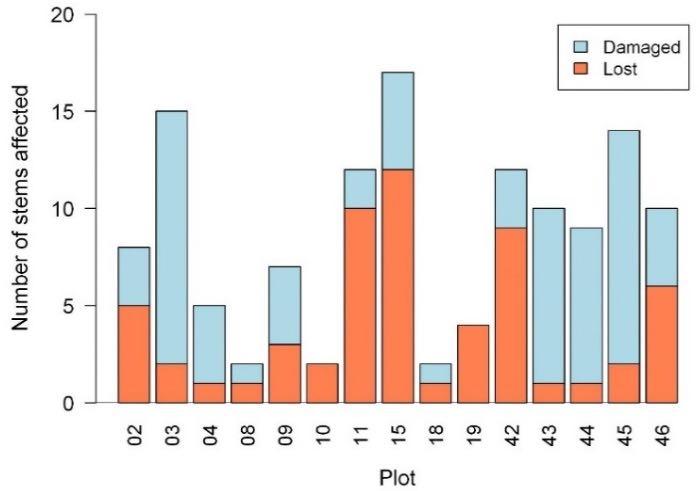
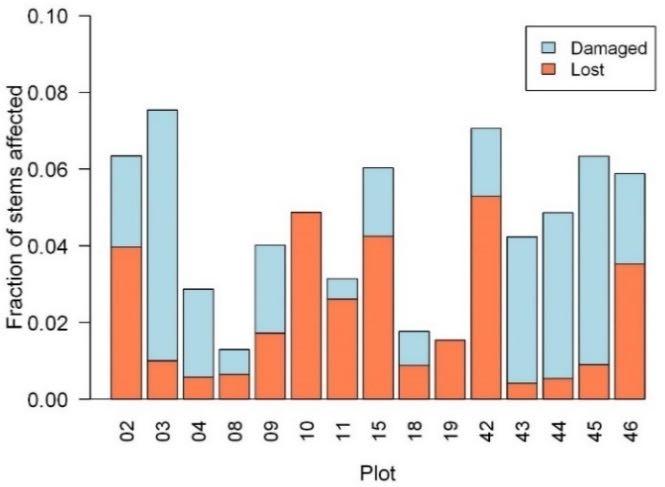
Figure4. Thenumber(upper)andthefraction(lower)ofaffectedplantstemsinthe15plots, includingthecategoriesofLostandDamaged.
Figure 4. The number (upper) and the fraction (lower) of affected plant stems cluding the categories of Lost and Damaged.
After regressing the fraction of lost stems in the plots on pertinent ing plot topography, the density of stems, the mean and standard height, and mean stem diameter with assumed quasibinomial
Afterregressingthefractionofloststemsintheplotsonpertinentcovariatesincluding plottopography,thedensityofstems,themeanandstandarddeviationofstemheight, andmeanstemdiameterwithassumedquasibinomial(logit)distribution,weobtainedthe followingequationafterstepwiseselectionofthecovariates:
where pLost isthefractionofloststems,and d isthestemdensity.Theregressionyielded residualdevianceEquation(2)of8.56,incomparisonwiththenulldeviance(thenullmodel withinterceptonly)of16.88.Allthecoefficientsweresignificant(p-value<0.01).Therefore, theproportionofloststemsdecreasedsignificantlywiththestemdensity.Similarly,the regressionofthefractionofdamagedstemsgave,
where pDamage isthefractionofdamagedstemsand Elev istheelevationattheplotcentroid. Theregressionhadresidualdevianceof22.68,incomparisonwiththenulldevianceof46.4. Allcoefficientsweresignificantat α =0.01,exceptthecoefficientinfrontof Elev whichhad a p-valueof0.21.Therefore,greatercanopyunevennessandhigherelevationweremore likelytoresultinmoredamage.
3.3.ImpactatSpeciesLevel
Table 2 liststhespeciesnameswithstemseitherlostordamaged(affected),thenumberofstemsforeachaffectedspeciesinthesite,thenumberofaffected,andthepercent ofaffectedcalculatedasthenumberofaffecteddividedbythenumberofstems.One ofthespeciesismarkedasanunknownplant,andtwoofthemhaveonlytheirgenus known.Duetothelackofcompleteinformationaboutthestructuralandfunctionaltraits, wecouldnotanalyzetherelationshipbetweenimpactandtraits.However,themost affectedspeciessuchas Gymnantheslucida Sw., Eugeniafoetida Pers., Bucidabuceras L., Crotonlucidus L., Thouiniastriata,and Guaiacumsanctum L.arerecordedashardwood species(http://tropical.theferns.info/,accessedon8June2021).Thesixspeciesconstitutedmorethan52%ofalltheaffectedstems.Fromtheglobalwooddensitydatabase[37], wefoundthewooddensityof10majorspeciesincluding Burserasimaruba (L.)Sarg., Cocolobadiversifolia Jacq., Exostemacaribaeum (Jacq.)Schult., Guaiacumofficinale L., Guaiacumsanctum L., Gymnatheslucida Sw., Leucaenaleucocephala (Lam.)deWit, Pictetia aculeata (Vahl)Urb., Swieteniamahagonia (L.)Jacq.,and Thouiniastriata.However,thepercentofaffected(fourthcolumninTable 2)didnothaveasignificantcorrelationwiththe wooddensityofthe10species.InthestudyoftheimpactofHurricaneGeorgesonthe Guánicadryforestin1998,vanBloemandMurphy[38]alsofoundwooddensitydidnot playasignificantroleinresistinghurricanedamage.However,theyfoundthepioneer speciesintheforestweredamagedmore.
Table2. Theaffectedspecies(encounteringlostor/anddamagedstem),numberofstems,numberof affected,andproportionofaffectedinthe15plotsatNEONGuánicadryforestsite.
ScientificName#Stems#Affected%Affected Gymnantheslucida Sw.1714181.1 Crotonlucidus L.537152.8 Bucidabuceras L.610132.1 Eugeniafoetida Pers.99780.8
ThouiniastriataRadlk.var.portoricensis (Radlk.)Votava&Alain
49081.6
Leucaenaleucocephala (Lam.)deWit48761.2
Table2. Cont.
ScientificName#Stems#Affected%Affected
Pisoniaalbida (Heimerl)BrittonexStandl.54161.1
Pithecellobium unguis-cati(L.)Benth.17163.5
Burserasimaruba (L.)Sarg.30551.6
Guaiacumsanctum L.18152.8
Coccolobamicrostachya Willd.22331.3
Acaciafarnesiana (L.)Willd.8222.4
Bunchosiaglandulosa (Cav.)DC.3925.1
Capparisflexuosa (L.)L.5423.7
Colubrinaarborescens (Mill.)Sarg.2926.9
Crotonbetulinus Vahl6233.3
Guaiacumofficinale L.26220.8
Pictetiaaculeata (Vahl)Urb.17321.2
Poiteaflorida (Vahl)Lavin4224.8
Rochefortiaacanthophora (DC.)Griseb.2528.0
Schaefferiafrutescens Jacq.5823.4
Swieteniamahagoni (L.)Jacq.56220.4
Capparishastata Jacq.11210.9
Capparisindica (L.)Druce2214.5
Coccolobadiversifolia Jacq.20710.5
Comocladiadodonaea (L.)Urb.3512.9 Crotonflavens L.7114.3 Croton sp.4012.5
Eugeniaxerophytica Britton3013.3
Exostemacaribaeum (Jacq.)Schult.6611.5
Guapiraobtusata (Jacq.)Little10110.0
Guettardakrugii Urb.12210.8
Guettarda sp.3213.1
LantanaexarataUrb.&Ekman8111.2
Reynosiauncinata
3.4.LiDAR-DerivedCanopyHeightChangealongtheTransect
Averagingthepixelsacrossthewidthdirectionofthetransect,wefoundthatcanopy heightchangewascorrelatedwithbothprior-hurricanecanopyheightandtreecover. Canopyheightchangewasmostlynegativeinthelowerleftofthetransectwithrelatively lowertreecoverandaveragecanopyheightbutpositiveinpartoftheupper-rightsection withgreatertreecoverandaveragecanopyheight(Figure 5a,b).Onaverage,thecanopy heightdecreasedby0.23m,incomparisonwitha0.14mdecreaseinstemheightfromplot measurement,probablybecausegroundstemheightonlymeasuresthetopheightofthe stems,whereasLiDAR-derivedcanopyheightincludesbothtreetopandcanopyfoliage. At50m × 50mgridscale,spatialregressionoftherelativecanopyheightchange(∆hcr),
i.e.,canopyheightchangedividedbythecanopyheightpriortothehurricanes,onthe normalizedcovariatesresultedinthefollowingEquation:
where C and hc areprior-hurricanetreecoverandnormalizedcanopyheight,respectively, f (α) = cos(α π/4) with α astheaspectangle,and r isnormalizedrugosity.Themodel hadaregressionstandarderrorof0.03,incomparisonwiththerangeofrelativecanopy heightas[–0.6,0.17].Allthecoefficientshad p-valueslessthan0.01.Thespatialerror modeldidnotprovideastatisticsimilartothatof R2;however,wecalculatedasimilar valueof0.81basedonthedefinitionoftheordinarylinearmodel(Figure 5d).Thespatial autocorrelationcoefficient, λ,wasestimatedas0.79.Theregressionshowedthat ∆hcr increasedwithCand hc inasecond-order(squared)fashion;however,decreaseswith r derivedfromthedigitalsurfacemodel.Asnegative ∆hcr indicatesdecreasedcanopy heightordamagedcanopy,theresultimpliedthatcanopyheightreductionwasresisted bythetreecover,canopyheightwhenthecanopywaslowormoderate,butpromotedby therugosity,canopyheightwhenthecanopywashigh.Theaspectfunction f (α) made southwestas+1andnortheastas 1,sothattheresultshowedthatslopesfacingsouthwest experiencedmoredamagethanslopesfacingnortheast,usingEquation(4).
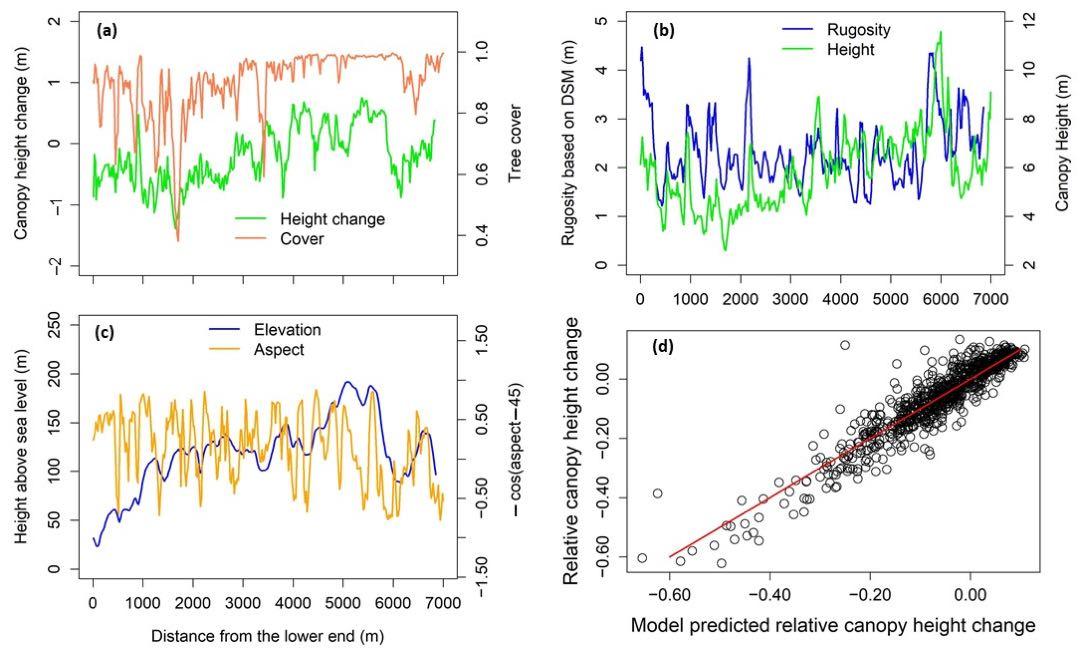
Figure 5. The canopy height change calculated by subtracting the LiDAR-derived canopy height model on 8 March 2017 from the LiDAR-derived canopy height model on 28 May 2018 along the transect within the Guánica forest (a): tree cover (a), rugosity based on digital surface model (DSM) (b), canopy height (b), elevation (c), and cosine function of aspect (c) were derived from the G-LiHT LiDAR data, indicating the status before the hurricanes. The predicted versus monitored relative canopy height change is shown in (d).
Figure5. ThecanopyheightchangecalculatedbysubtractingtheLiDAR-derivedcanopyheightmodelon8March2017 fromtheLiDAR-derivedcanopyheightmodelon28May2018alongthetransectwithintheGuánicaforest(a):treecover(a), rugositybasedondigitalsurfacemodel(DSM)(b),canopyheight(b),elevation(c),andcosinefunctionofaspect(c)were derivedfromtheG-LiHTLiDARdata,indicatingthestatusbeforethehurricanes.Thepredictedversusmonitoredrelative canopyheightchangeisshownin(d
4. Discussion
4.Discussion
Instead of using the individual-level tree traits to explain the hurricane damage, we integrated the NEON ground observations of vegetation structure and the airborne LiDAR-derived continuous structural information, which allowed us to use forest stands as base units to explore the underlying mechanisms of ecosystem resistance to hurricanes. Our analyses of the response of the tropical dry forest in Guánica to major hurricanes highlighted the importance of stand-level parameters such as stem density and rugosity. At the stand level, trees function interactively to resist wind damage. The results are
Insteadofusingtheindividual-leveltreetraitstoexplainthehurricanedamage, weintegratedtheNEONgroundobservationsofvegetationstructureandtheairborne LiDAR-derivedcontinuousstructuralinformation,whichallowedustouseforeststands
asbaseunitstoexploretheunderlyingmechanismsofecosystemresistancetohurricanes. OuranalysesoftheresponseofthetropicaldryforestinGuánicatomajorhurricanes highlightedtheimportanceofstand-levelparameterssuchasstemdensityandrugosity.At thestandlevel,treesfunctioninteractivelytoresistwinddamage.Theresultsarealigned withrecentmodelingstudiesreportingthatstand-levelcharacteristicsplaymoreimportant rolesinwinddamagetoforests,comparedtotheindividual-levelcharacteristics[11,18].
Atthestandlevel,stemdensityisoneoftheprimaryparametersasseenin Equation(2) Aforestcanbeviewedasawindbreaksystem.Ingeneral,thedenserthestemsare, thedenserthecanopy,andthemoresupportamongtreeswiththeinteractionoftheir branchesandleavesinthewind.Thebendingofstemsandbranchesandfrictionamong leavesdissipatethewindenergy.Stemdensityisespeciallyimportantfortropicaldry forestswithsmalltreestoresistwinds.TheNEONGuánicadryforesthasameandensity of 3990 ± 2250stemsha 1 inthe15plots,whereastheestimatedmeandensityforthe tropicalmoistforestisaround800globally[39]and2278ha 1 foramoistforestinthesame island[40].Evenforaforestwithlargetreesandlowapparentdensity,twoormultiple treesgrowingtogethercansupporteachother[41].Forastandwithlowdensity,wind speedinsidethecanopywillbehigherthanthatofadenserstand[11],thusleadingto moreseverewinddamage.
Meanstemdiameterisanotheressentialparametertoresistforestheightreduction asseeninEquation(1).Windforceatthecanopyconstitutesaturningmomenttosnap oruproottrees.IntheAmazonforest,thestrengthtosustainalargeturningmoment ispositivelycorrelatedtotheDBHoftheexperimentaltrees[11,42].Treeswithlarger DBHaremoreresistanttosnappingoruprooting.Arecentstudyoftreeadaptationand acclimationtowindbasedonlong-termwindthrowdatasetsalsorevealedthattaperor lowerheight:diameterratiowasrelatedtoreducedwinddamage[12,19].Theforestrisk modelForestGALES[43]indicatesthatcriticalwindspeedtorupturestemsisproportional totheorderof3/2ofstemdiameterandtothestemdensity,alignedwithourfindingsin thetropicaldryforestasseeninEquations(1)and(2).
Thestandarddeviationofstemheightsisanindexforunevennessofthecanopyheight reflectingsurfaceroughnessorrugosityasderivedfromthedigitalsurfacemodel (Figure 5) Wefoundthattherugosityisimportantinexplainingthereductionofstemheightorcanopy height(Equations(1)and(4))andtheproportionofdamagedstems(Equation(3))during majorhurricanes.Stormintensityincreaseswithsurfaceroughness[44],whichimplies thathighersurfaceroughnesstendstobringmoredamage.Moresurfaceroughnessmakes aboundarylayerthinner[45]sothatstormwindscantraversetheforestwithafaster speedatthelowerheighttobringmoredamage.Hence,aforestwithauniformstem heightisresistanttohurricanedamage.Surfaceroughnesscanbeenhancedbyforests withemergenthightreesorexceedinglylowstemdensitywithheterogeneousheight arrangements,whichmaycreategaps.Duringstrongwinds,emergenthightreesmightbe knockeddownfirstduetothenegativecorrelationbetweencriticalwindspeedtotopple treesandtreeheight,andthengreaterwindpenetrationintothestandthroughthenewly createdgapsmightinducehigherwindloadtotheremainingtrees[11].Therefore,more damagesareexpectedasgapspropagate.Astoaspecificcaseofplantations,ingeneral, theyhaveuniformstemheightandsimplestructure.Whenthestormwindislowerthan thecriticalwindspeedtotoppletrees,plantationsareexpectedtoresistwinddamagedue tolowsurfaceroughness.However,duetotheirsimplestructure,plantationtreeshave similarcriticalwindspeedtotoppletrees.Therefore,whenthewindexceedsthecritical windspeedtotoppleplantationtrees,fewtreescouldresistthewinds,andthestructure mightcollapse[20].
Topography-relatedfactors,suchaselevation,topographicposition,andaspect,reflect theexposureofforeststodifferentwindspeedsduringstorms.Thehighertheelevation, thestrongerthehurricanewindsencountered,thusmoredamage,e.g.,Equation(3)[46].
TheGuánicadryforest,locatedattheleftsideofhurricanesIrmaandMaria,which spuncounterclockwiseandmovedtowardthenorthwest,mightencounterthestrongest
windscomingfromthewesttosouthwest,andourresultsshowedthatmoredamages (Equation(4))wereassociatedwithareasfacingsouthwest.
OurmodelforLiDAR-detectedchangeincanopyheightalongatransect Equation(4) basicallyconfirmsthefindingwiththegroundplotmeasurementsinEquations(1)–(3). Treecovermaybeassociatedwithstemdensityifthecrownsizeisrelativelyuniform, whichisapproximatelythecaseinthisdryforestwithdensestemsofsmalltrees.Higher treecovermightimplyhigherstemdensityandfewergapssothattreeshelpeachotherto resistdamage.Highertreecovermightalsoindicateahigherleafareaindex(LAI),whereas gustwindisnegativelyrelatedtoLAI[11,47].Therefore,alargertreecovermightweaken gustwindandreducewinddamage.CanopyrugosityderivedfromDSMEquation(4) andstemheightunevennessEquations(1)and(3)bothtendtoenlargewinddamage.We foundasignificantPearson’scorrelationcoefficientof0.65betweenstemdiameterand stemheightintheNEONgroundmeasurements.Hence,agreatermeancanopyheightin thelowandmoderaterangemayindicateagreatermeanstemdiameter.Wealsofounda significantcorrelationof0.63betweentreecoverandmeancanopyheightderivedfrom LiDAR.Therefore,ahighercanopymayalsomeangreatertreecovertoresistwinddamage. Meancanopyheightisnegativelycorrelatedtothegustwindprofile[11,47]andthus tendstoprotecttheemergenttrees,whichagreeswiththeroleofmeancanopyheightin Equation(4).
Onaverage,4.5%ofstemsintheGuánicaforestwereaffectedbythehurricanesin 2017,similartotheimpactofHurricaneGilbertonthesubtropicaldryforestinJamaica in1988with5%structuraldamage[48]andthatofHurricaneDavidonadryforestin Dominicain1979with4%[49].HurricaneGeorgesin1998caused12.4%structuraldamage totheGuánicaforest[38],probablybecausethepathofGeorgeswasmuchclosertothe forestthanthehurricanesin2017;however,the2%ofloststemsinthisstudyiscloseto the2%mortalityninemonthsafterHurricaneGeorges[30].IntheGuánicadryforest,the conspecificpercentageofaffectedstemswasonaverage2.7%whenonlytheknownspecies havingatleast10stemswerecounted(Table 2).
PuertoRicoexperiencedaseveredroughtin2014–2016,andthelargepulserain broughtbythemajorhurricanesin2017mightreleasethedroughtstress(e.g.,positive heightchangeinFigure 3)andhelptherecoveryofthedryforest[24].Climatemodels predictintensifiedclimatevariability[50,51],andtropicaldryforestsmightfaceincreasing extremeclimateevents[52].Whiletropicaldryforestshaveadaptedtomoisture-deficit environmentsandmightshowresistancetofurtherdrought,arecentreviewstillpointed outthatalteredspeciesdistributionandecosystemprocessesarelikelyinthealteredrainfall regime[8].Agreatchallengetobeaddressedbyfuturestudieswouldbetheresistanceand resilienceoftropicaldryforestsinresponsetoalternatingseveredroughtandmajorstorms.
5.Conclusions
Tropicaldryforestsarevulnerabletohurricanedisturbancesandfunctiondifferently fromtropicalmoistorwetforestsintheirresponse,resistance,andrecoveryafterthe disturbances.Asindividuals’functionaltraitsprevailintheliteratureonhurricanes’impact, weherebyaddresseditatforeststandlevelandtriedtoanswerhowtreesintropicaldry forestworktogethertocombatthewinddamage.Toachievethis,weintegratedtheNEON groundobservationsofecosystemstructurewiththeairborne-LiDAR-derivedcontinuous structuralinformation,whichallowedustouseforeststandasabaseunittoexplorethe underlyingmechanismsofecosystemresistanceoftheNEONGuánicadryforesttothetwo majorhurricanesofIrmaandMariain2017.Ourresultshighlightedthemutualsupports amongtreesduringstormsandtheimportantrolesofstand-levelcollectiveparameters suchasstemdensityandrugosityinresistingwinddamagestothetropicaldryforest.At thestandlevel,treesfunctioninteractivelytoresistwinddamage,especiallyinthecase oftropicaldryforestswithlowprofilebutdensecanopy.Theconclusiononthetropical dryforestreemphasizesthefindingfromrecentmodelingstudies,namely,thatstandlevelcharacteristicsaremoreessentialinexplainingwinddamagetoforests,comparedto
theindividual-levelcharacteristics.Couplingremotesensingwithgroundobservations providesaneffectiveandpromisingapproachtoadvancingourmechanisticunderstanding ofecosystemresponsestodisturbances.
AuthorContributions: Conceptualization,Q.G.andM.Y.;methodology,Q.G.andM.Y.;formal analysis,Q.G.andM.Y.;writing—originaldraftpreparation,Q.G.;writing—reviewandediting,Q.G. andM.Y.Bothauthorshavereadandagreedtothepublishedversionofthemanuscript.
Funding: ThisresearchissupportedbyNASAEPSCoRandNOAAPuertoRicoSeaGrant.
InstitutionalReviewBoardStatement: Notapplicable.
InformedConsentStatement: Notapplicable.
DataAvailabilityStatement: Publiclyavailabledatasetswereanalyzedinthisstudy.Thisdatacan befoundhere: https://data.neonscience.org/data-products/explore,accessedon8June2021,and https://glihtdata.gsfc.nasa.gov/,accessedon8June2021.
Acknowledgments: WeacknowledgeNEONforprovidingtheecosystemstructuredataandthe LiDARafterthehurricanes,publiclyavailableattheNEONdataportal(https://data.neonscience. org/data-products/explore,accessedon8June2021),andNASAforprovidingtheLiDARdatabefore thehurricanes,publiclyaccessibleatNASAG-LiHT(https://glihtdata.gsfc.nasa.gov/,accessedon 8June2021).
ConflictsofInterest: Theauthorsdeclarenoconflictofinterest.Thefundershadnoroleinthedesign ofthestudy;inthecollection,analyses,orinterpretationofdata;inthewritingofthemanuscript,or inthedecisiontopublishtheresults.
References
1. Murphy,P.G.;Lugo,A.E.EcologyofTropicalDryForest. Annu.Rev.Ecol.Syst. 1986, 17,67–88.[CrossRef]
2. Holdrige,L.R. LifeZoneEcology;TropicalScienceCenter:SanJose,CoastRica,1967.
3. Holm,J.A.;VanBloem,S.J.;Larocque,G.R.;Shugart,H.H.Shiftsinbiomassandproductivityforasubtropicaldryforestin responsetosimulatedelevatedhurricanedisturbances. Environ.Res.Lett. 2017, 12,025007.[CrossRef]
4. Schlesinger,W.H.;Bernhardt,E.S. Biogeochemistry—AnAnalysisofGlobalChange;AcademicPress:Boston,MA,USA,2013.
5. Stan,K.;Sanchez-Azofeifa,A.TropicalDryForestDiversity,ClimaticResponse,andResilienceinaChangingClimate. Forests 2019, 10,443.[CrossRef]
6. Powers,J.S.;Feng,X.;Sanchez-Azofeifa,A.;Medvigy,D.Focusontropicaldryforestecosystemsandecosystemservicesinthe faceofglobalchange. Environ.Res.Lett. 2018, 13,090201.[CrossRef]
7. Álvarez-Yépiz,J.C.;Martínez-Yrízar,A.;Fredericksen,T.S.SpecialIssue:Resilienceoftropicaldryforeststoextremedisturbance events. For.Ecol.Manag. 2018, 426,1–6.[CrossRef]
8. Allen,K.;Dupuy,J.M.;Gei,M.G.;Hulshof,C.;Medvigy,D.;Pizano,C.;Salgado-Negret,B.;Smith,C.M.;Trierweiler,A.; VanBloem,S.J.;etal.Willseasonallydrytropicalforestsbesensitiveorresistanttofuturechangesinrainfallregimes? Environ. Res.Lett. 2017, 12,023001.[CrossRef]
9. Waring,B.;Powers,J.Overlookingwhatisunderground:Root:shootratiosandcoarserootallometricequationsfortropical forests. For.Ecol.Manag. 2017, 385,10–15.[CrossRef]
10. Qi,Y.;Wei,W.;Chen,C.;Chen,L.Plantroot-shootbiomassallocationoverdiversebiomes:Aglobalsynthesis. Glob.Ecol.Conserv. 2019, 18,e00606.[CrossRef]
11. Peterson,C.J.;Ribeiro,G.H.P.d.M.;Negrón-Juárez,R.;Marra,D.M.;Chambers,J.Q.;Higuchi,N.;Lima,A.;Cannon,J.B.Critical windspeedssuggestwindcouldbeanimportantdisturbanceagentinAmazonianforests. For.Int.J.For.Res. 2019, 92,444–459. [CrossRef]
12. Gardiner,B.;Achim,A.;Nicoll,B.;Ruel,J.-C.Understandingtheinteractionsbetweenwindandtrees:Anintroductiontothe IUFRO8thWindandTreesConference(2017). For.Int.J.For.Res. 2019, 92,375–380.[CrossRef]
13. Feldpausch,T.R.;Banin,L.;Phillips,O.L.;Baker,T.R.;Lewis,S.L.;Quesada,C.A.;Affum-Baffoe,K.;Arets,E.J.M.M.;Berry,N.J.; Bird,M.;etal.Height-diameterallometryoftropicalforesttrees. Biogeosciences 2011, 8,1081–1106.[CrossRef]
14. Curran,T.J.;Brown,R.L.;Edwards,E.;Hopkins,K.;Kelley,C.;Mccarthy,E.;Pounds,E.;Solan,R.;Wolf,J.Plantfunctional traitsexplaininterspecificdifferencesinimmediatecyclonedamagetotreesofanendangeredrainforestcommunityinnorth Queensland. AustralEcol. 2008, 33,451–461.[CrossRef]
15. Reich,P.B.;Uhl,C.;Walters,M.B.;Ellsworth,D.S.Leaflifespanasadeterminantofleafstructureandfunctionamong23 amazoniantreespecies. Oecologia 1991, 86,16–24.[CrossRef]
16. Angelou,N.;Dellwik,E.;Mann,J.Windloadestimationonanopen-grownEuropeanoaktree. For.Int.J.For.Res. 2019, 92, 381–392.[CrossRef]
17. Antúnez,I.;Retamosa,E.C.;Villar,R.Relativegrowthrateinphylogeneticallyrelateddeciduousandevergreenwoodyspecies. Oecologia 2001, 128,172–180.[CrossRef][PubMed]
18. Hart,E.;Sim,K.;Kamimura,K.;Meredieu,C.;Guyon,D.;Gardiner,B.Useofmachinelearningtechniquestomodelwind damagetoforests. Agric.For.Meteorol. 2019, 265,16–29.[CrossRef]
19. Moore,J.;Lin,Y.Determiningtheextentanddriversofattritionlossesfromwindusinglong-termdatasetsandmachinelearning techniques. For.Int.J.For.Res. 2019, 92,425–435.[CrossRef]
20. Morimoto,J.;Nakagawa,K.;Takano,K.T.;Aiba,M.;Oguro,M.;Furukawa,Y.;Mishima,Y.;Ogawa,K.;Ito,R.;Takemi,T.;etal. ComparisonofvulnerabilitytocatastrophicwindbetweenAbiesplantationforestsandnaturalmixedforestsinnorthernJapan. For.Int.J.For.Res. 2019, 92,436–443.[CrossRef]
21. Uriarte,M.;Thompson,J.;Zimmerman,J.K.HurricaneMaríatripledstembreaksanddoubledtreemortalityrelativetoother majorstorms. Nat.Commun. 2019, 10,1362.[CrossRef][PubMed]
22. Beard,K.H.;Vogt,K.A.;Vogt,D.J.;Scatena,F.N.;Covich,A.P.;Sigurdardottir,R.;Siccama,T.G.;Crowl,T.A.Structuraland functionalresponsesofasubtropicalforestto10yearsofhurricanesanddroughts. Ecol.Monogr. 2005, 75,345–361.[CrossRef]
23. Miller,P.W.;Kumar,A.;Mote,T.L.;Moraes,F.D.S.;Mishra,D.R.PersistentHydrologicalConsequencesofHurricaneMariain PuertoRico. Geophys.Res.Lett. 2019, 46,1413–1422.[CrossRef]
24. Yu,M.;Gao,Q.Topography,drainagecapability,andlegacyofdroughtdifferentiatetropicalecosystemresponseandrecoveryto majorhurricanes. Environ.Res.Lett. 2020, 15,104046.[CrossRef]
25. Lugo,A.E.Visibleandinvisibleeffectsofhurricanesonforestecosystems:Aninternationalreview. AustralEcol. 2008, 33,368–398. [CrossRef]
26. Stovall,A.E.L.;Shugart,H.;Yang,X.Treeheightexplainsmortalityriskduringanintensedrought. Nat.Commun. 2019, 10,4385. [CrossRef]
27. Atkins,J.W.;Bohrer,G.;Fahey,R.T.;Hardiman,B.S.;Morin,T.H.;Stovall,A.E.L.;Zimmerman,N.;Gough,C.M.Quantifying vegetationandcanopystructuralcomplexityfromterrestrialLiDARdatausingtheforestrrpackage. MethodsEcol.Evol. 2018, 9, 2057–2066.[CrossRef]
28. Eisemann,E.;Dunkin,L.;Hartman,M.;Wozencraft,J.JALBTCX/NCMPemergency-responseairborneLidarcoastalmapping& quickresponsedataproductsfor2016/2017/2018hurricaneimpactassessments. ShoreBeach 2019, 87,31–40.[CrossRef]
29. Herrera,D.A.;Ault,T.R.;Fasullo,J.T.;Coats,S.J.;Carrillo,C.M.;Cook,B.I.;Williams,A.P.Exacerbationofthe2013-2016 Pan-CaribbeanDroughtbyAnthropogenicWarming. Geophys.Res.Lett. 2018, 45,10619–10626.[CrossRef]
30. VanBloem,S.J.;Murphy,P.G.TheinflluenceofhurricanewindsonCaribbeandryforeststructureandnutrientpools. Biotropica 2005, 37,571–583.[CrossRef]
31. NationalEcologicalObservationNetworks. NEONDP1.10098.001;Battelle:Boulder,CO,USA,2020;Availableonline: http://data. neonscience.org (accessedon15January2020).
32. Cook,B.;Corp,L.;Nelson,R.;Middleton,E.;Morton,D.;McCorkel,J.;Masek,J.;Ranson,K.;Ly,V.;Montesano,P.NASA Goddard’sLiDAR,HyperspectralandThermal(G-LiHT)AirborneImager. RemoteSens. 2013, 5,4045.[CrossRef]
33. NationalEcologicalObservatoryNetworks. EcosystemStructure(DP3.30015.001);NationalEcologicalObservatoryNetwork (NEON);Battelle:Boulder,CO,USA,2021.[CrossRef]
34. NationalEcologicalObservatoryNetworks. Elevation—LiDAR(DP3.30024.001);NationalEcologicalObservatoryNetwork (NEON);Battelle:Boulder,CO,USA,2021.[CrossRef]
35. Anselin,L.;Griffith,D.A.DoSpatialEffecfsReallyMatterinRegressionAnalysis? Pap.Reg.Sci. 1988, 65,11–34.[CrossRef]
36. RCoreTeam. R:ALanguageandEnvironmentforStatisticalComputing;RFoundationforStatisticalComputing:Vienna,Austria, 2017;Availableonline: https://www.gbif.org/tool/81287/r-a-language-and-environment-for-statistical-computing (accessed on8June2021).
37. Chave,J.;Coomes,D.;Jansen,S.;Lewis,S.L.;Swenson,N.G.;Zanne,A.E.Towardsaworldwidewoodeconomicsspectrum. Ecol.Lett. 2009, 12,351–366.[CrossRef]
38. VanBloem,S.J.;Lugo,A.E.;Murphy,P.G.StructuralresponseofCaribbeandryforeststohurricanewinds:Acasestudyfrom GuanicaForest,PuertoRico. J.Biogeogr. 2006, 33,517–523.[CrossRef]
39. Crowther,T.W.;Glick,H.B.;Covey,K.R.;Bettigole,C.;Maynard,D.S.;Thomas,S.M.;Smith,J.R.;Hintler,G.;Duguid,M.C.; Amatulli,G.;etal.Mappingtreedensityataglobalscale. Nature 2015, 525,201–205.[CrossRef]
40. Frangi,J.L.;Lugo,A.HurricanedamagetoafloodplainforestsintheLuquillomountainofPuertoRico. Biotropica 1991, 23, 324–335.[CrossRef]
41. Duryea,M.L.;Kampf,E. WindandTrees:LessonsLearnedfromHurricanes;InstituteofFoodandAgriculturalSciencesExtension, UniversityofFlorida:Gainesville,FL,USA,2017.
42. Ribeiro,G.H.P.M.;Chambers,J.Q.;Peterson,C.J.;Trumbore,S.E.;MagnaboscoMarra,D.;Wirth,C.;Cannon,J.B.;Négron-Juárez,R.I.; Lima,A.J.N.;dePaula,E.V.C.M.;etal.MechanicalvulnerabilityandresistancetosnappinganduprootingforCentralAmazon treespecies. For.Ecol.Manag. 2016, 380,1–10.[CrossRef]
43. Hale,S.E.;Gardiner,B.;Peace,A.;Nicoll,B.;Taylor,P.;Pizzirani,S.Comparisonandvalidationofthreeversionsofaforestwind riskmodel. Environ.Model.Softw. 2015, 68,27–41.[CrossRef]
44. Zhu,P.Impactofland-surfaceroughnessonsurfacewindsduringhurricanelandfall. Q.J.R.Meteorol.Soc. 2008, 134,1051–1057. [CrossRef]
45. Nilsson,E.D.PlanetaryboundarylayerstructureandairmasstransportduringtheInternationalArcticOceanExpedition1991. TellusB 1996, 48,178–196.[CrossRef]
46. Hu,T.;Smith,R.B.TheImpactofHurricaneMariaontheVegetationofDominicaandPuertoRicoUsingMultispectralRemote Sensing. RemoteSens. 2018, 10,827.[CrossRef]
47. Santana,R.A.S.d.;Dias-Júnior,C.Q.;Vale,R.S.d.;Tóta,J.;Fitzjarrald,D.R.ObservingandModelingtheVerticalWindProfileat MultipleSitesinandabovetheAmazonRainForestCanopy. Adv.Meteorol. 2017, 2017,5436157.[CrossRef]
48. Wunderle,J.J.;Lodge,D.;Waide,R.Short-TermEffectsofHurricaneGilbertonTerrestrialBirdPopulationsonJamaica. Auk 1992, 109,148–166.[CrossRef]
49. Lugo,A.E.;Applefield,M.;Pool,D.J.;McDonald,R.B.TheimpactofHurricaneDavidontheforestsofDominica. Can.J.For.Res. 1983, 13,201–211.[CrossRef]
50. Cai,W.J.;Wang,G.J.;Santoso,A.;McPhaden,M.J.;Wu,L.X.;Jin,F.F.;Timmermann,A.;Collins,M.;Vecchi,G.;Lengaigne,M.;etal. IncreasedfrequencyofextremeLaNinaeventsundergreenhousewarming. Nat.Clim.Chang. 2015, 5,132–137.[CrossRef]
51. Cai,W.J.;Borlace,S.;Lengaigne,M.;vanRensch,P.;Collins,M.;Vecchi,G.;Timmermann,A.;Santoso,A.;McPhaden,M.J.; Wu,L.X.;etal.IncreasingfrequencyofextremeElNinoeventsduetogreenhousewarming. Nat.Clim.Chang. 2014, 4,111–116. [CrossRef]
52. Feng,X.;Porporato,A.;Rodriguez-Iturbe,I.Changesinrainfallseasonalityinthetropics. Nat.Clim.Chang. 2013, 3,811–815. [CrossRef]
