Sea Grant Annual Report 2009
Title: Effects of water quality on seagrass community productivity and biodiversity
Project Number: R104106
Name: Loretta Roberson, University of Puerto Rico – Rio Piedras
Note: I have received an extension until November 2009 to complete the proposed study. Research was delayed by poor field sampling conditions in 2008, lack of departmental support (I did not receive release time for research during the 2008-09 school year), and lack of graduate student assistance.
Results
The goal of this study was to characterize nearshore habitats and the accompanying watersheds to provide resource managers with policy recommendations based on scientific data. The work quantified both physical and biological characteristics of seagrass habitats. There were six main methodological components to this work, three physical and three biological. Physical components include coastal water sampling, quantification of watershed characteristics, and measurement of physical forces. Biological components include seagrass demographics, community biodiversity, and seagrass productivity.
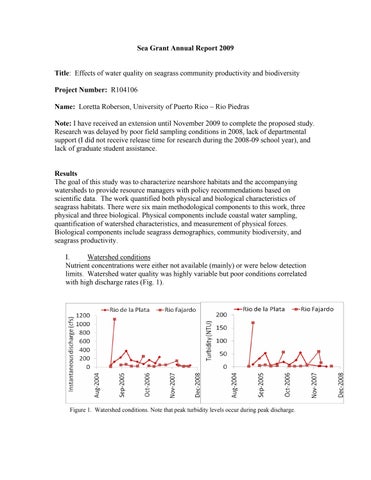
I. Watershed conditions
Nutrient concentrations were either not available (mainly) or were below detection limits. Watershed water quality was highly variable but poor conditions correlated with high discharge rates (Fig. 1).
II. Nearshore conditions
Nutrient concentrations were below detection limits and coliform tests were highly variable therefore water quality assessments were based primarily on turbidity and the light level reaching the substratum.
a. Water quality
Turbidity was highly variable at most sites and relatively low (generally less than 10 NTU) but was significantly higher at impacted sites (CGR and LC) than non-impacted sites (Fig. 2). Total coliforms also were highly variable but were not significantly different between sites, although there was a trend towards higher values in impacted areas (especially CGR).
b. Physical forcing
The north coast of Puerto Rico is highly energetic, especially during 2008 and the first half of 2009, with waves over 2 m occurring almost continuously throughout the year and often reaching heights over 4 m (Fig. 4). In 2008,
Figure 4. Maximum monthly significant wave heights. ANOVA based on yearly averages between Nov-March (peak periods). Data acquired from the National Data Buoy Center (NOAA).
three-quarters of the year received waves greater than 2 m 80% of the time or more (Fig. 5). This translated to large wave event durations between 10 and 30 days per month (Fig. 6).
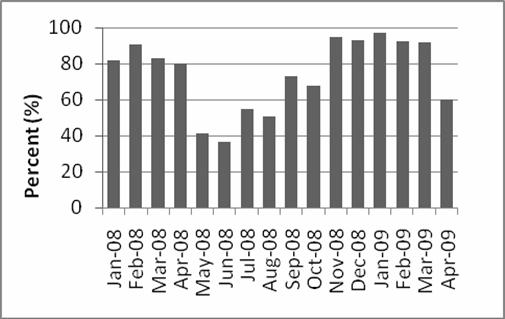
Figure 5. Wave events 2008-2009. Bars indicate the percent of time in days that waves were higher than 1.5 m per month from January 2008 to April 2009.
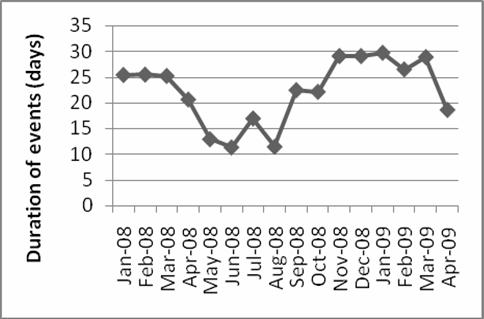
Figure 6. Duration of wave events 2008-09. Points represent total consecutive days per month with wave heights 1.5 m or greater.
In contrast, mean temperatures showed little monthly variation (Fig. 7)
7.
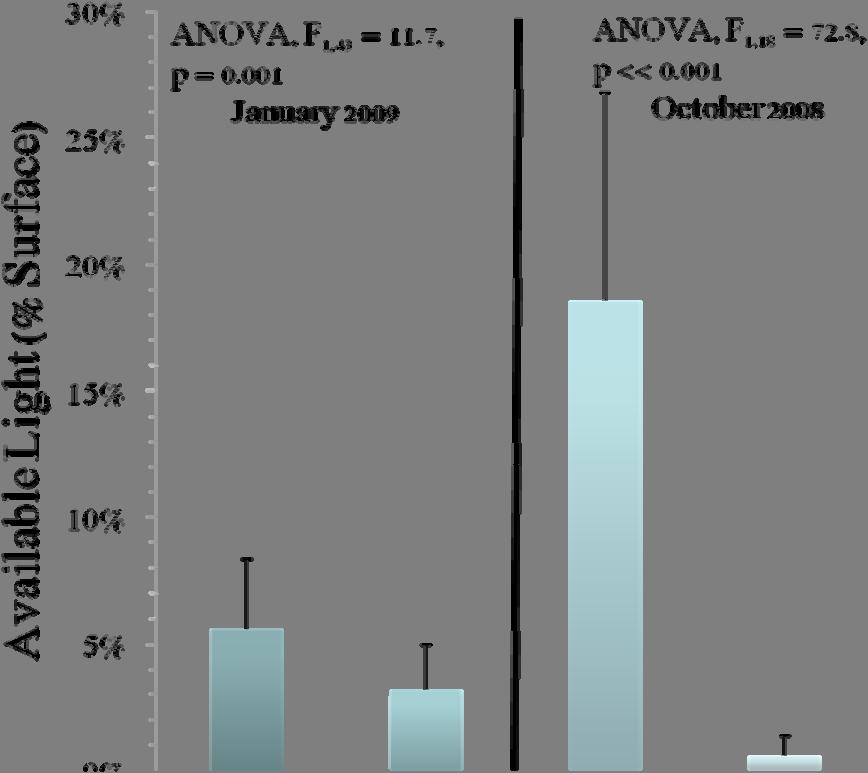
Light levels were significantly lower at impacted versus non-impacted sites, but light levels at all sites were below minimum requirements (generally >20% surface irradiance), even during good weather conditions (Fig. 8).
Figure 8. Mean daily light levels as percent of surface irradiance in nonimpacted (CG) and impacted (CGR) sites. Light levels were below minimum requirements at all sites especially during storm evens (January 2009) but were within the range at non-impacted sites during calm periods (October 2008).. Error bars = 1 SD.

During large wave events (wave heights >2 m)(Fig. 9B), light levels decreased dramatically (Fig. 9A).
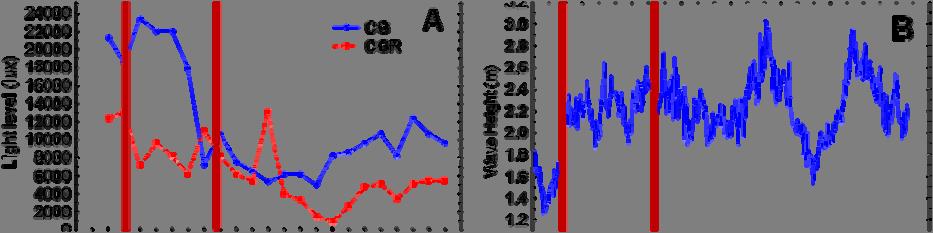
Figure 9. Effect of large wave events on nearshore light levels. (A) Light levels at non-impacted (CG) and impacted (CGR) sites. (B) Wave heights measured at the Southwest Atlantic Buoy (NDBC, NOAA) January 2009. Red boxes indicate the same sampling period.
III. Biological characteristics
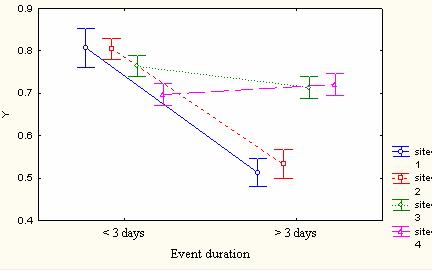
Photosynthesis did not vary significantly between sites (Fig. 10) but decreased significantly at most sites when large wave events impacted the region for more than 3 consecutive days (Fig. 11). Species diversity was significantly higher at non-impacted than impacted sites (Figs. 12-15).
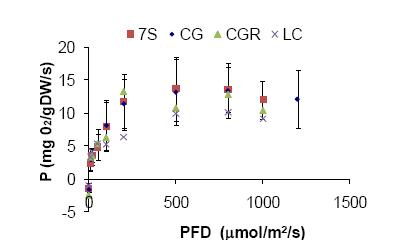
10. Photosynthesis versus light curves for
at four sites. Error bars = 1SD.
Figure 11. Photosynthetic rates measured as fluorescence yield (Y) for calm (< 3 days) versus energetic wave conditions for Thalassia testudinum at four sites. Site 1 – CG, Site 2 = CGR, Site 3 – 7S, and Site 4 = LC. Energetic wave conditions are defines as wave events > 2m. Error bars = 1SD.
Total
Figure 12. Fish species diversity. All sites exhibited lower diversity than Guadalupe Island.
Invertebrates
Figure 15. Total species diversity. Impacted sites exhibited lower diversity than nonimpacted sites.
As part of the analysis of physical forces impacting seagrass communities I developed a database of storm event duration using wave heights and rainfall as indicators. These data will be shared with the San Juan Bay Estuary Program and published in a peerreviewed manuscript to be submitted in September 2009.
Maps are being created of benthic cover and land use (including local population density) at all sites.
The project was used to train undergraduate students at the University of Puerto Rico-Rio Piedras in how to conduct environmental research. In both 2008 and 2009, a total of 35 students received hands-on experience in how to conduct field research (Figs. 16 and 17) and learned how to prepare a scientific poster of their research. Due to the success of the training, the project is now a permanent component of the Environmental Science curriculum.
In addition, I established collaborations with researchers at the San Juan Bay Estuary Program (Jorge Bauza), US EPA (Marirosa Molina, microbiology), USGS (Pedro Diaz, water quality), Horn Point Laboratory in Maryland (Dr. Evamarie Koch, seagrass monitoring), Dauphin Island Sea Lab in Georgia (Dr. Ken Heck, seagrass productivity measurement), Virginia Institute of Marine Science (Dr. Robert Orth, habitat restoration), and the Global Seagrass Monitoring Network (http://www.seagrassnet.org/) (two permanent SeagrassNet sites were established in Puerto Rico in 2008).
Methods
1. Water quality analysis:
(1) turbidity – portable nephelometric meter;
(2) total suspended solids – standard filtration technique,
(3) nutrient levels (total dissolved Nitrogen, phosphorus, and particulate organic carbon) – ion chromatograph (Cornell University Nutrient Analysis Lab);
(4) chlorophyll a – standard filtration and spectrophotometric techniques;
(5) total and fecal coliforms – Coliscan Easygel (Micrology Labs);
(6) salinity – portable refractometer;
(7) pH – laboratory pH meter;
(8) water temperature – digital thermometer;
(9) long-term stream data – USGS water quality data for Puerto Rico.
2. Seagrass demographics:
(1) Seagrass density and productivity – biomass core sampler;
(2) Species assemblages and percent cover – photo quadrats along permanent 50m transects;
(3) Macroinvertebrate and fish biodiversity estimates – Roving Diver fish and invertebrate surveys;
(4) Photosynthesis – oxygen electrode chambers (Rank Brothers) and PAM fluorescence.
3. Physical variables
(1) light levels – LiCor and Onset Hobo light meters;
(2) water temperature –Onset Hobo temperature loggers;
(3) wave height – NOAA National Data Buoy Center;
(4) rainfall – NOAA National Weather Service, Puerto Rico
Objectives
1. What is the impact of watershed characteristics on coastal water quality? Watershed water quality directly affects coastal water quality but the degree of affect (high or low quality) is highly variable and is significantly impacted by storm events that vary in duration and recovery time needed to return to pre-storm conditions. In addition, the time-dependant variables vary significantly by site. The principle water quality parameters that were examined include: (1) turbidity; (2) total suspended solids, (3) nutrient levels (total dissolved Nitrogen, phosphorus, and particulate organic carbon); (4) chlorophyll a; (5) total and fecal coliforms; (6) salinity; (7) pH; and (8) water temperature. Of these, only 5-8 were monitored after several months of initial sampling.
Sampling for parameters 1-4 did not continue because either values were below the level of detection (nutrients and chlorophyll a) or required high frequency sampling (time scale of hours instead of months). In addition, the USGS in San Juan did not and could not provide stream water quality and streamflow data necessary due to budget cuts. Archived rainfall data from the National Weather Service were not available until 2009. In addition, theft and vandalism of sampling gear was prevalent at all sites and resulted in months of lost data plus the inability to sample for extended periods for fear of theft.
2. What are the current levels of biodiversity and productivity in the seagrass communities of NE Puerto Rico?
Seagrass community biodiversity and productivity are significantly higher in nonimpacted versus impacted sites. These data require long-term monitoring to understand the complex interactions between seagrass species composition and associated organism biodiversity. A shift in species composition was noted in 2009 at all sites towards higher percentages of Syringodium and algae (mainly cyanobacteria and Sargassum) but only long-term data can reveal whether this is a phase shift due to environmental conditions or part of a long-term cycle.
3. What are the key factors affecting seagrass productivity and biodiversity?
It appears that for seagrass communities in NE Puerto Rico, large wave events play a major role in community productivity and biodiversity. Presumably, impacted sites have more silt available for resuspension by wave action, resulting in longer periods of low light, however, further sampling is necessary to fully test this hypothesis.
Other products
Benthic and land use maps will be completed in November 2009.
Students
supported (9 total)
Name Email
Brenda Castro brendaicv@gmail.com
Diana Martinó dlj_pr@yahoo.com
Ileana Freytes black_butterfly17@hotmail.com
Neidibel Martinez chicanely18@hotmail.com
Melissa Melendez melissamelendez@hotmail.com
Norberto Quiñones norb0964@hotmail.com
Efrén Rodríguez pigmeogris@hotmail.com
Mayra Sánchez lluviamagenta@yahoo.com
Jennifer Toledo odelotjr@yahoo.com
Thesis and dissertations
None completed to date (Brenda Castro, Diana Martinó, Melissa Melendez, Norberto Quiñones, Mayra Sanchez, and Jennifer Toledo in progress)
Presentations, technical reports and special awards
Benthic Ecology Meeting, Corpus Christi, TX, March 2009
1. Poster presentation authors and title: Mayra Sánchez García and Loretta Roberson, Sustained large wave events adversely affect photosynthesis in Thalassia testudinum
2. Oral presentation author and title: Loretta Roberson, Effects of water quality on seagrass community productivity and biodiversity in NE Puerto Rico
Benthic Ecology Meeting, Québec, Canada, March 2006
1. Poster presentation authors and title: Diana Martinó and Loretta Roberson, RNA editing of the ndhB gene in manatee grass, Syringodium filiforme
Earth Day, School of Education, UPR-Rio Piedras April 2009
1. Oral presentation title: Técnicas y Metodologías sencillas de investigación ambiental
Publications
Sánchez, M. and L. Roberson, In prep. Sustained large wave events adversely affect photosynthesis in Thalassia testudinum
Roberson, L. In prep. Effects of water quality on seagrass community productivity and biodiversity in NE Puerto Rico
Roberson L.M. 2007. Materials: Strength. In: Gaines, S.D. and M.W. Denny (eds.) Encyclopedia of Tidepools and Rocky Shores, University of California Press
Roberson L.M. and J.J.C. Rosenthal. 2006. An accurate fluorescent assay for quantifying the extent of RNA editing. RNA. 12:1-6.