Submittedto: UPRSeaGrantProgram
Preparedby:
MiguelCanals
Submittedto: UPRSeaGrantProgram
Preparedby:
3.1SchematicoftheCariCOOSNearshoreWaveModelgridandboundaryforcing.The bluelinerepresentstheextentofthemodelgridat1kmspatialresolution,andthe reddotsrepresentlocationsatwhichfulltwo-dimensionalspectralwavedatafromthe NOAANCEPMultigridWaveWatchIIIModelChawlaetal.(2013)isprovidedas boundaryconditionstotheSWANmodel.Thefourbuoylocationsshownrepresent thesitesatwhichthemodelwasvalidated........................ 11
3.2Locationandextentofthe11high-resolutionnestedgridsoftheCariCOOSNearshore WaveModeldevelopedaspartofthepresentproject.AsofMarch2015thesegridsnow covereverysinglemeterofinhabitedcoastlineinPuertoRicoandtheUSVI...... 16
3.3Comparisonbetweenobserved(blueline)andsimulated(redline)significantwave height(leftcolumn)andpeakperiod(rightcolumn)atthefourCariCOOSbuoys:Rinc´on (toprow),SanJuan(secondrowfromtop),Ponce(thirdrowfromtop)andUSVI(bottomrow).......................................... 17
3.4Leftcolumn:Scatterplotsofobservedvs.simulatedsignificantwaveheightatthefour CariCOOSbuoys:Rinc´on(top),SanJuan(secondfromtop),Ponce(thirdfromtop) andUSVI(bottom);thecolorofeachdatapointrepresentstheobservedpeakperiodat thatinstance.Rightcolumn:Sameastheleftcolumnbutforthepeakwaveperiod;the colorofeachdatapointrepresentstheobservedsignificantwaveheightatthatinstance. Thesolidblacklineineachplotrepresentsthelinearregressionwhichbestrepresents themodel-datarelationship,whilethegraydashedlinerepresentsaperfectfit...... 18
3.5LocationofthesensorsduringthevalidationexperimentconductedattheTresPalmas MarineReserveinJanuary-February2013......................... 19
3.6Approximatelocationofthesensorsusedduringthevalidationexperimentduringa largewinterswellonJanuary14,2013.Thesensorswereinthewateronthissameday andsuccessfullysampledthiswaveevent......................... 20
3.7ComparisonbetweenSWANpredictionsandobservedwaveheightatthefoursensors. 21
3.8Comparisonbetweenmodelestimatedbreakerheights(Hb1/10 inblueand Hb1/100 in cyan)andthevisuallyestimatedbreakerheights(redpoints)inferredfromtheRinc´on SurfReportdatabase(http://rinconsurfreport.com/)............ 27
3.9Scatterplotshowingtherelationshipbetweenthevisuallyestimatedbreakerheights fromRSRandthemodelestimatedbreakerheights(Hb1/10 inblueand Hb1/100 inred) andthecorrespondingleastsquareslinearfit.thegraydashedlinerepresentsahypotheticalperfectfit.Itisevidentthatboth Hb1/10 and Hb1/100 overestimatethebreaker heightsforsmallereventsandunderestimatethebreakerheightsforlargerevents.However,giventhehighlysubjectivenatureofvisuallyestimatedbreakerheights,theseresultsshouldbetreatedwithcaution............................
3.10SampleoutputofthebreakerheightvirtualbuoyforJobosBeach.Besidestherangeof expectedbreakerheights,thevirtualbuoyalsoprovideswaterlevelandwindpredictions foreachbeach.Similarpredictionsareavailablefor84beachesinPR/USVIintheCariCOOS-SeaGrantNearshoreBreakerModelwebpage: http://www.caricoos. org/Nearshore_Breaker_Model/
3.11SnapshotoftheCariCOOS-SeaGrantNearshoreBreakerModelwebpage: http: //www.caricoos.org/Nearshore_Breaker_Model/
3.12Top:LocationofJobosBeachandCariCOOSBuoyB,whichprovidedthewavedata usedtoforcedthewavemodel.Bottom:AerialimageofJobosBeachshowingdangerouslocationsforbeachgoers................................
3.13ComparisonbetweenthecurrentssimulatedbyBOUSS2D(coloredvectors)andthe trajectoryoftheGPStrackeddrifterforthefieldexperimentcarriedoutonFebruary7, 2011............................................
3.14ComparisonbetweenthecurrentssimulatedbyBOUSS2D(coloredvectors)andthe trajectoriesoftwoGPStrackeddriftersforthefieldexperimentcarriedoutonMay27, 2011............................................
3.15PreliminarydraftofwarningsigndevelopedforJobosBeachbasedonthefieldobservationsandconversationswithexperiencedlocalsurfersandbeachgoers.Itshouldbe notedthatthisdraftiscurrentlyundergoingchangesbasedonrecommendationsfrom personnelfromUPRSeaGrantandfromthemunicipalityofIsabela.Theappearance ofthewarningsigntobeinstalledwilllikelybeverydifferentfromthisversion.....
3.16AerialimageofDomesBeachinRinc´on,PuertoRico.................. 41
3.17Comparisonbetweenthesimulatedwave-inducedcurrents(coloredvectors)andthe trajectoryofadrifter(coloreddots)atDomesBeach...................
3.18PreliminarydraftofwarningsigndevelopedforDomesBeachbasedonthefieldobservationsandconversationswithexperiencedlocalsurfersandbeachgoers.Itshouldbe notedthatthisdraftiscurrentlyundergoingchangesbasedonrecommendationsfrom personnelfromUPRSeaGrantandfromthemunicipalityofRinc´on.Theappearance ofthewarningsigntobeinstalledwilllikelybeverydifferentfromthisversion.....
Projecttitle: DevelopmentofthePuertoRicoBeachandSurfzoneCurrentsWarningSystem
Date: March30,2015
ProjectNumber: R-124-1-12
Investigatorsandaffiliation:
MiguelCanals,DepartmentofEngineeringScienceandMaterials
JulioMorell,DepartmentofMarineSciences
DatesCovered:February2012throughDecember2014
Asspecifiedintheoriginalproposal,themainobjectivesofthepresentprojectwereasfollows:
• Developmentofanoperational,veryhighresolutionnearshorewavemodelcapableofpredictingnearshorebreakerheights: Thisobjectivewassuccessfullycompleted,andthemodelis fullyoperational(http://caricoos.org/drupal/swan),andhasbeenvalidatedextensively.
• DevelopmentofaBeachHazardsWarningSystemforPR/USVI: Thisobjectivechanged slightlyfromdevelopingaBeachHazardsWarningSystemtothedevelopmentofaNearshore BreakerHeightPredictionSystem.ThischangewastheresultofconversationswiththeNational WeatherService,whosustainedthattheNWSshouldbetheofficialagencytoemithazardouscurrentswarninglevels.NegotiationsbetweenthePIs,NWSandSeaGrantledtotheagreementthat theNWSwouldusethehigh-resolutionwavemodelsandthenearshorebreakerpredictionsystem developedaspartofthepresentprojectinordertoemittheirofficialwarnings,giventheunique numericalandcomputationaladvantagesofthesystemdevelopedbythePIs.Theculminationof
thiscollaborationoccurredonOctober302014,whentheNWSSanJuanissuedapressrelease describingtheNWS-CariCOOS-SeaGrantcollaborationonthisissue.TheNearshoreBreaker PredictionSystemincludes87beaches(asofMarch2015)andisoperationalandavailableat: http://www.caricoos.org/Nearshore_Breaker_Model/
• Developmentofcustomizedhazardouscurrentswarningsigns: Thisobjectivewassuccessfullycompleted,andcustomizedsurfzonecurrentmapsweredevelopedforJobosBeachinIsabela andDomesBeachinRinc´on.
Theworksupportedbythepresentprojecthasresultedinanunprecedentedcapabilitytosimulate,in anoperationalfashion,thenearshorewaveclimateofPuertoRicoandtheUnitedStatesVirginIslands. Beyondprovidingaccuratepredictionsoftherangeofexpectedbreakerheights,theapplicationsofthe wavemodelarenumerous.Ithasalreadybeenusedforavarietyofpurposesincludingunderstanding coastalerosion,analysisoftherenewablewaveenergyresource,understandingtheinteractionbetween coralreefsandwaves,etc.
Mostoftheprojectgoalsweremetwithoutanyproblems.However,oneoftheoriginalgoalswas todevelopawarningsystemwhichwouldalertbeachgoersofthelevelofriskassociatedwithwaveinducedsurfzonecurrents.Asmentionedabove,thisobjectivewaschangedbasedonnegotiationswith theNationalWeatherServiceSanJuanWeatherForecastOffice,whoexpressedtheirconcernthatits istheNWSwhoshouldemitofficialwarningsandalerts.NegotiationsbetweenthePIs,NWSandSea GrantledtotheagreementthattheNWSwouldusethehigh-resolutionwavemodelsandthenearshore breakerpredictionsystemdevelopedaspartofthepresentprojectinordertoemittheirofficialwarnings, giventheuniquenumericalandcomputationaladvantagesofthesystemdevelopedbythePIs.
Themostimportantimpactsoftheoutcomesofthisresearchprojectareasfollows:
• ThisprojectledtothedevelopmentofaveryhighresolutionoperationalwavemodelforPR/USVI. Thisproject,incoordinationwiththeCaribbeanCoastalOceanObservingSystem,helpedachieve
animportantmilestone:asofMarch2015,everymeteroninhabitedcoastlineinPR/USVIiscoveredbyahighresolutiongridwithintheoperationalCariCOOSNearshoreWaveModel.Thishas allowedforaccuratepredictionsofthenearshorewaveclimatewhichnotonlyallowsforaccurate predictionofnearshorebreakersforbeachsafetypurposes,buthasalsoprovidedanoperational wavepredictiontoolforusebyboaters,recreationalandcommercialfishermen,harborpilots,etc.
• ThisprojecthasledtoanunprecedentedagreementbetweenNWSandCariCOOS/SeaGrantin whichNWSSanJuanwillusethewavemodelsdevelopedunderthepresentprojecttoemittheir ripcurrentforecastsandwarnings.
• Therehasbeenconstantengagementwithstakeholdersandpotentialusersofthebreakermodel. InJanuary2015,SeaGrantandtheprojectPI’sofferedatrainingworkshoptoemergencymanagementofficialsfromthe44coastalmunicipalitiesonhowtousethenearshorebreakerprediction system.Inaddition,emergencypersonnelwereaskedtoaddbeachestothesystemattheirdiscretion.Asaresultoftheworkshop,17additionalbeacheswereaddedtothebreakerprediction system.
1.5.1Studentssupported
• JoseMesa (jose.mesa@upr.edu),BScStudentatUPRM,CivilEngineering(nowatUniversityof Michigan’sPhDprograminOceanEngineering)
SeaGrantfunds:$0
Duties:Numericalwavemodeling
• JuanJoseRosado (juan.rosado6@upr.edu),BScStudentatUPRM,CivilEngineering
SeaGrantfunds:$8,375.00
Duties:DevelopmentofMATLABscriptsnecessarytoimplementthenearshorebreakermodel.
• EstefanaQuiones (estefania.quinones@upr.edu),BScStudent,Mathematics
SeaGrantfunds:$6,000.00
Duties:DevelopmentofMATLABscriptsnecessarytoimplementthenearshorebreakermodel.
• MiguelLoubriel (miguel.loubriel@upr.edu),BScStudent,Geology
SeaGrantfunds:$0
Duties:Calibrationofthenearshorebreakermodel.
• OmarL´opez (omarlopez87@gmail.com),BScStudent,CivilEngineering-nowPhDstudentin OceanEngineeringatStevensInstituteofTechnology
SeaGrantfunds:$0
Duties:Wavemodelingandfieldobservations.
• ChristianRojas (christian.rojas1@upr.edu),MScStudentatUPRM,CivilEngineering
SeaGrantfunds:$30,630.28
Duties:Numericalwavemodeling
Thesis:AssessmentofthefeasibilityofusingtheBajoBlancosandbarasabeachnourishment borrowsiteforapotentialbeachnourishmentprojectinRincn.
Operationaltools
Perhapsthemostimportantproductsresultingfromthepresentprojectarethefollowingoperational tools:
• TheCariCOOSNearshoreWaveModel: http://caricoos.org/drupal/swan
• TheCariCOOS-SeaGrantNearshoreBreakerModel: http://www.caricoos.org/Nearshore_ Breaker_Model/
Publicationsandproceedings
• Canals,M.,Morell,J.,CorredorJ.,Capella,J.AdvancingtheCaribbeanCoastalOceanObserving System.AGUOceanSciencesMeeting,SaltLakeCity,Utah,February2012.(acknowledgesSea Grantsupport)
• Canals,M.OnthespatialdistributionofthewaveenergyresourceinPuertoRicoandtheUnited StatesVirginIslands.Inpreparationforsubmissiontothe JournalofRenewableEnergy.(acknowledgesSeaGrantsupport)
Posterpresentations
• Qui˜nones,E.,Loubriel,M.,Morell,J.andM.Canals.DevelopmentofanearshorebreakerpredictionsystemforPuertoRicoandtheUnitedStatesVirginIslands.Posterpresentedatthe2015 ASLOAquaticSciencesMeeting,Granada,Spain.
• Quinones,E.andM.Canals.DevelopmentofthePuertoRicobeachandsurfzonecurrentswarningsystem.Posterpresentedatthe2014AGUOceanSciencesMeeting,Honolulu,Hawaii.
Inadditiontotheabove,thebreakerpredictionsystemhasbeenpresentedtoagencies,usersandstakeholdersdozensoftimes.Themostimportantrecentpresentationsoftheproductofthisprojectsareas follows:
• OnMarch2014,theCariCOOS-SeaGrantNearshoreBreakerModelwasunveiledtothepublic attheCariCOOSGeneralAssembly.
• InApril2014,PICanalsgaveademonstrationofthesystemtotheDNERbeachmanagement board JuntadePlayas.
• OnOctober282014,PICanalspresentedthenearshorebreakerpredictionsystemtotheSecurity CommitteeofthePuertoRicoHotelandTourismAssociation.
• OnMarch26,2015,PICanalspresentedtheprojectoutcomestoofficialsandmayorsfromthe 44coastalmunicipalitiesinPuertoRicothefirstannual EncuentrodeMunicipiosCosteros,sponsoredbyPR-DNER.
• Inaddition,PICanalsandCo-PIMorellhavemetseveraltimeswiththeNWStocoordinatea formalcollaborationinwhichNWSSanJuanwillusethedatafromtheCariCOOSNearshore BreakerModeltoemittheirofficialripcurrentwarninglevelsfor16beachesinPRandtheUSVI.
1.6Indicatesourcesofmatchingfunds
TheUniversityofPuertoRicoatMayaguezprovidedmatchingfundsforatotalof$42,448.
1.7Newextramuralfundsinadditiontomatch
Nonedirectlyrelatedtothepresentwork.
1.8TimeandeffortforprojectPI/Co-PI
• MiguelCanals,PI
Effortlevel:Fall2012:16.66%,Spring201316.66%,Fall2013:10.2%,Spring201410.2%, Fall2014:0%SeaGrantfunds:$11,218.00 Matching(UPRM)funds:$11,218.00
• JulioMorell,Co-PI
Effortlevel:Fall2012:16.66%,Spring201316.66%,Fall2013:10.2%,Spring201410.2%,Fall 2014:0%
SeaGrantfunds:$0
Matching(UPRM)funds:$20,666.67
Asmentionedabove,thisprojectledtothedevelopmentoftwoonlinetools:theCariCOOSNearshore WaveModel(www.caricoos.org/drupal/swan)andtheCariCOOS-SeaGrantNearshoreBreaker Model(www.caricoos.org/drupal/nearshore_breaker).Bothofthesetoolsareoperationalmodelsthathaveallowedtheabilitytopredicttheheightofbreakingwavesat87(asofMarch 2015)beachesinPuertoRico.Inaddition,aMemorandumofUnderstandingwassignedbetweenCariCOOSandthePREmergencyManagementAgency(AEMEAD),whichformalizesAEMEADsuseof thebeachhazardproductsdevelopedunderthisproject.Finally,thepredictionsystemwaswrittenin suchawaythatadditionalbeachescouldbeaddedwithverylittleeffort,sothatthenumberofbeaches willincreaseasneededbylifeguards,stateagencies,users,etc.
MorethanhalfofPuertoRico’spopulationdoesnotknowhowtoswimand,usually,therearenot enoughlifeguardsornolifeguardsatallonPuertoRico’sbeaches.Inaddition,PuertoRicohasa stronglyseasonalcycleinwaveheights,andmarineconditionscanchangeveryquicklyasintenseswell eventsarrive.Thesearethemainfactsthataccountforanaverageof25beachdrowningsperyear.One ofthegravestdangerstobeachgoersareintensesurfzonecurrentswhicharecausedbywave-induced pressuregradients.
Before2008,real-timedataofPuertoRico’scoastalenvironmentwasextremelyscarceorcompletely nonexistent.In2008,NOAAapprovedfundingwhichledtothedevelopmentoftheCaribbeanCoastal OceanObservingSystem,referredtohereafterasCariCOOS.ThedevelopmentofCariCOOShasled toawealthofreal-timedataonwavesandcoastalwindsavailableonline(see www.caricoos.org) tobeachgoers,thankstoseveralreal-timeoceanbuoys.Inaddition,asuiteofveryhigh-resolutionnumericalmodelsprovidesforecastsofnearshorewaveconditionsuptoseveraldaysinadvance.Inan efforttoeducatethepubliconwaveinducedhazardsandtoaddressthewave-induceddrowningprobleminPuertoRico,theinvestigatorshaveleveragedthecomputationalandoceanobservingassetsof CariCOOSwiththefinancialsupportfromSeaGrantforthepresentprojecttodeveloptheCariCOOS NearshoreWaveModelandtheCariCOOS-SeaGrantNearshoreBreakerModel.TheCariCOOS NearshoreWaveModelisahigh-resolutionoperationalwavemodelingsystemwhichisabletopredictthespatialdistributionofthewavefieldaroundPuertoRicoandtheUnitedStatesVirginIslands. ThiswavemodelisthenumericalenginebehindtheCariCOOS-SeaGrantNearshoreBreakerModel, whichcombinesnumericalmodeling,empiricalknowledge,fieldobservationsandcustomwebsitedevelopmenttoprovidethepublicwithanonlinetooltovisualizethepresenceofpotentiallydangerous breakingwavesatthemostpopularbeachesinPuertoRicoandtheUnitedStatesVirginIslands.This toolisintendedtofunctionasaplanningtoolwhichwillallowbeachgoers,lifeguardsandemergency managementpersonneltomakeinformeddecisionsregardingbeachsafety.
3.1Developmentofanoperationalnearshorewavemodelforaccuratepredictionofthenearshorewaveclimate
3.1.1TheCariCOOSNearshoreWaveModel
TheCariCOOSNearshoreWaveModel(CNWM)isanoperationalmodelbasedontheSimulating WavesNearshore(SWAN)spectralwavemodel,whichisdescribedindetailin(Booijetal.,1999)and (TheSWANTeam,2012).DetailsofthesetupandvalidationoftheCariCOOSNearshoreWaveModel maybefoundinAnselmietal.(2012)andCanalsetal.(2012),andonlythemostimportantfeaturesof themodelsetuparedescribedherein.
Figure3.1showsaschematicofthePR/USVIparentmodelgridandboundaryconditions.Theblue linerepresentstheextentofthemodelgridat1kmspatialresolution,andthereddotsrepresentlocationsatwhichfulltwo-dimensionalspectralwavedatafromtheNOAANCEPMultigridWaveWatchIIIModelChawlaetal.(2013)isprovidedasboundaryconditionstotheSWANmodel.The modelisrunfor120hoursinforecastmodeandninehoursinhindcastmode.SurfacewindforcingisprovidedtothemodelfromtheNationalWeatherServiceNationalDigitalForecastDatabase, whichconsistsofthreedaysofwindforecastsfromtheWRFwindmodel,runoperationallybythe NationalWeatherServiceSanJuanOffice,andtwodaysfromtheNOAAGlobalForecastSystem (GFS, http://www.emc.ncep.noaa.gov/GFS/.php)atmosphericmodel.Gridbathymetryis obtainedfromtheNationalGeophysicalDataCenterDigitalElevationModelforPuertoRicoandthe UnitedStatesVirginIslandsTayloretal.(2006).Themodelrunsoperationallytwiceperdayassoonas
theNOAAWWIIIspectralfilesforthe00Zand12Zrunsareavailableonline,whichusuallyoccursat around06Zand18Z,respectively.
Figure3.1:SchematicoftheCariCOOSNearshoreWaveModelgridandboundaryforcing.Theblue linerepresentstheextentofthemodelgridat1kmspatialresolution,andthereddotsrepresentlocations atwhichfulltwo-dimensionalspectralwavedatafromtheNOAANCEPMultigridWaveWatchIII ModelChawlaetal.(2013)isprovidedasboundaryconditionstotheSWANmodel.Thefourbuoy locationsshownrepresentthesitesatwhichthemodelwasvalidated.
Inordertoresolvewavepropagationandtransformationinregionswithcomplexbathymetryandbe abletoadequatelypredictbreakingwaveheightsatindividualbeaches,severalhigh-resolutionnested gridswereimplementedwithintheCariCOOSNearshoreWaveModelatspatialresolutionsranging from60to240meters,dependingonthesizeofthedomainandthecomplexityofthebathymetryin eachregion.Figure3.2showsthelocationandextentofthe11veryhigh-resolutionnestedgridsofthe CariCOOSNearshoreWaveModeldevelopedaspartofthepresentproject.AsofMarch2015these
gridsnowcovereverysinglemeterofinhabitedcoastlineinPuertoRicoandtheUSVI.Thecontour plotsshowsamplemodeloutputforsomeofthesehigh-resolutiongrids.Table3.1liststhespatial resolutioninmetersofeachnestedgrid.
Table3.1:SpatialresolutionofthenestedgridsshowninFigure3.2.
Inordertoevaluatemodelperformance,modeloutputfromOctober292012toJanuary312013was comparedwithwaveobservationsatfouroceandatabuoysownedandmaintainedbytheCaribbean CoastalOceanObservingSystem(CariCOOS, http://www.caricoos.org).Thelocationsof thesebuoysareshowninFigure3.1,andeachbuoyrepresentsadistinctwaveregimewithinthePuerto Rico/USVIregion.TheSanJuanbuoy,locatedaboutakilometeroffthecityofSanJuaninapproximately35metersdepth,isexposedtolargeNorthAtlanticswellsandthepersistentwindswellcaused byeasterlytradewinds.TheRinc´onwavebuoyislocatedaboutamileoffthecoastandisrelatively protectedfromeasterlywindswellbutisfullyexposedtolongperiodwinterswellsenteringtheMona Passagefromthenorthwest,northandnortheast.TheUSVIbuoyislocatedaboutninemilessouthofSt. Johninabout60metersdepthandissignificantlyshelteredfromwinterswellsbySt.ThomasandSt. Johntothenorth,butisfullyexposedtowindswellfromeasterlytradewindsaswellastolongperiod swellswhichentertheCaribbeanthroughtheAnegadaPassage.Finally,thePoncebuoyislocatedsouth ofPuertoRicoandismostlyaffectedbywindswell,butiscompletelyshelteredfromwinterswells.All fourbuoysareperiodicallysubjecttostrongwaveeventsfromtropicalstormsandhurricanes.
Figure3.3showsacomparisonbetweentheobservedandsimulatedsignificantwaveheightandpeak periodatthefourCariCOOSbuoys:Rinc´on(toprow),SanJuan(secondrowfromtop),Ponce(third rowfromtop)andUSVI(bottomrow).Visualinspectionsuggeststhatthemodelreproducescorrectly
thewaveheightsandpeakperiodsofsignificantwaveevents,althoughthemodelunderestimatesthe waveheightforseveralmajorevents,especiallyintheSanJuanandRinc´onbuoys.Thisdiscrepancy couldbeduetoanunderestimationcausedbyWavewatchIIIboundaryconditions,orfromlocalwind effects.Figure3.4showsscatterplotsofobservedvs.simulatedsignificantwaveheight(leftcolumn) andobservedvs.simulatedpeakwaveperiods(rightcolumn)atthefourCariCOOSbuoys.Forthe significantwaveheightscatterplotsthecolorofeachdatapointrepresentstheobservedpeakperiod atthatinstance.Thecolorofeachdatapointinthepeakwaveperiodscatterplots(rightcolumn) representstheobservedsignificantwaveheightatthatinstance.Thisvisualizationshowshowthemodel behavesasafunctionoftheobservedseastate.Thesolidblacklineineachplotrepresentsthelinear regressionwhichbestrepresentsthemodel-datarelationship,whilethegraydashedlinerepresentsa perfectfit.Ingeneral,themodelunderestimatewaveheightsatallfourbuoys,withamorepronounced underestimationatRinc´on.Thepredictionsofpeakwaveperiodsaregenerallyworseforlowwave periods,probablyduetothechallengesassociatedwithpredictingthecoastalwindfield,includingthe dailyseabreezecycle.Table3.2showsthemodelvalidationstatistics,includingtheleastsquaresfit, forbothsignificantwaveheightandpeakwaveperiodforeachbuoylocation.
Table3.2:Modelvalidationstatisticsateachbuoylocationforsignificantwaveheight(Hs )andpeak waveperiod(Tp ).
TheCariCOOSNearshoreWaveModelwasvalidatedinJanuary2013duringstrongwinterswellsin ordertoevaluateitsperformanceinpredictingnearshorewaveheights.Amodelvalidationexperiment wasconductedinwhichfourwaveobservingassetswereused:theCariCOOSRinc´onWaveBuoy (apermanentasset),twopressuresensors(PS1andPS2)andanAcousticWaveandCurrentMeter
(AWAC),alsoownedbyCariCOOS.ThesensorsweredeployedonJanuary112013andwererecovered onFebruary142013.Severallongperiodwinterswellsweresampledduringthisperiod,allowingfor modelvalidationduringabroadrangeofseastates.ThevalidationexperimenttookplaceattheTres PalmasMarineReserve(TPMR),locatedwithinthedomainoftheNorthwesternPuertoRico(NWPR) high-resolutionnestedgrid(seeFigure3.2).Thisstudysiteiswellknownforitsverylargebreaking waves,cravedbysurfersfromaroundtheworldduringthewintermonths.Thelocationofeachsensoris showninFigure3.5.Figure3.6showstheapproximatelocationoftheAWACandthepressuresensors duringalargewinterswellonJanuary14,2013.TheAWACwaslocatedoutsideofthesurfzone,PS1 waslocatedjustoffshoreofthebreakingpoint,andPS2waslocatedinsidethebreakerregiononthis particularday.Notethattheoffshoreextentofthesurfzonevarieswidelydependingonincomingwave conditions,sothatonsmallerdaysPS2wasalsolocatedoutsidethesurfzone.
Figure3.7showsatimeseriesofthecomparisonbetweenthemodel-predictedandobservedsignificantwaveheightatthesensorlocations.AttheRinc´onbuoythemodeldoesaverygoodjobof reproducingthewavefield.AttheAWACandPS1locationsthemodelalsosuccessfullyreproduces mostofthewaveevents.Notethesignificantshoalingcapturedbyboththemodelandtheobservations fromtheAWACsitetothePS1siteduringtheJanuary14swellevent(sameastheonepicturedinFigure 3.6).AfterFebruary72013thePS2sensorstoppedcollectingdataduetobatterydepletion.AtthePS2 location,Figure3.7showsthattheoperationalmodelwasunabletocorrectlyresolvewavedissipation duetobreaking,andoverestimatesthewaveheightatthePS2location,mostnotablyfortheJanuary14, January27andFebruary12swellevents.SincethePS2sensorwaslocatedwellinsidethesurfzone fortheselargewaveevents,itistheauthors’hypothesisthattheSWANmodeldoesnotaccuratelyreproducethedissipationofmechanicalenergyduetowavebreakingduetothefactthatSWANassumes aspillingbreakermodel.Atthestudysite,somewavesareplungingwaves.Inaddition,thehorizontal resolutionof120metersfortheNWPRgridislikelystilltoocoarsetoreproducetheenergydissipation overasurfzonethatis,atmost,200-300meterswideinthecross-shoredirectionduringthesespecific events.
WhilebetterresultsatthePS2location(insidethesurfzone)couldhavebeenobtainedwithahigher spatialresolution,theaimofthepresentstudywastodevelopafullyoperationalwavemodelcovering allPR/USVIbeaches.Spatialresolutionhigherthan120meters,atleastfortheNWPRgrid,was prohibitiveduetocomputationallimitations.However,giventhattheaimofthepresentprojectwasto beabletopredictbreakerheightsattheseawardedgeofthesurfzone(e.g.,atthePS1location),andnot theheightsofindividualwaves(orbores)shorewardofthesurfzone(amuchmoreinvolvedtask),the authorsdeemthemodeltobeadequatefordevelopinganearshorebreakerpredictionsystemwhichcan predictthemaximumbreakerheightstobeexpectedataparticularbeachonagivenday.
ThefactthattheoperationalSWANmodelcansometimesoverestimatewaveheightsseawardof thesurfzonecanbetakenasanadditionalsafetyfactor,thusresultinginconservativeestimatesof breakerheights(fromabeachsafetystandpoint,solargerwavesthaninreality).Forbeacheswhich areprotectedbylargeoffshorecoralreefformations,suchasthosefoundinbeachesofSanJuanand
Carolina,thespatialresolutionofthemodelforthisregion(theSJBAYgrid)wasincreasedto60meters tobetterresolvewaveenergydissipation.However,themodelwasnotvalidatedatthesebeachessince suchvalidationexperimentswereoutofthescopeofthepresentproject.Futureworkshouldfocus onfurthervalidationoftheCariCOOSNearshoreWaveModelatbeacheslocatedseawardofoffshore barrierreefs.OngoingworkbyCariCOOSisfocusedonfurtherimprovingourwavemodelssuitefor theseapplications.
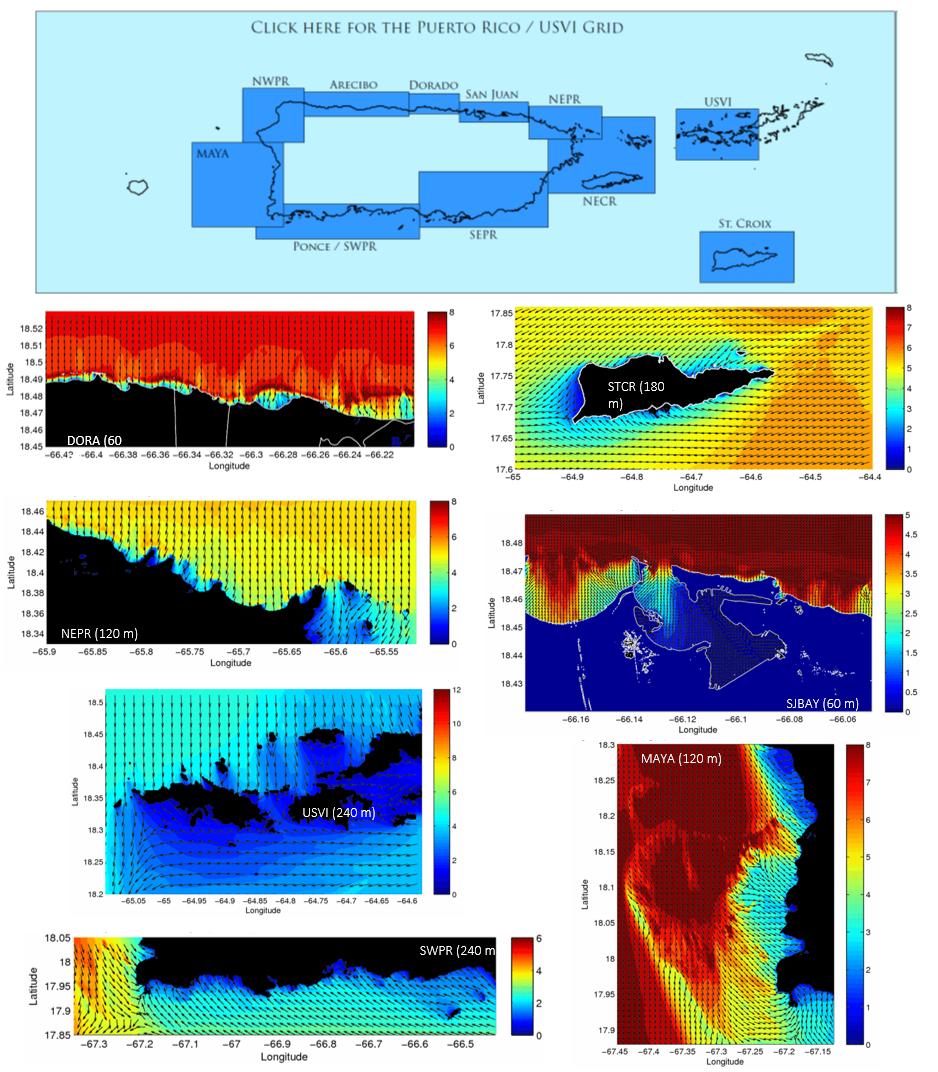
Figure3.2:Locationandextentofthe11high-resolutionnestedgridsoftheCariCOOSNearshoreWave Modeldevelopedaspartofthepresentproject.AsofMarch2015thesegridsnowcovereverysingle meterofinhabitedcoastlineinPuertoRicoandtheUSVI.
Figure3.3:Comparisonbetweenobserved(blueline)andsimulated(redline)significantwaveheight (leftcolumn)andpeakperiod(rightcolumn)atthefourCariCOOSbuoys:Rinc´on(toprow),SanJuan (secondrowfromtop),Ponce(thirdrowfromtop)andUSVI(bottomrow).
Figure3.4:Leftcolumn:Scatterplotsofobservedvs.simulatedsignificantwaveheightatthefour CariCOOSbuoys:Rinc´on(top),SanJuan(secondfromtop),Ponce(thirdfromtop)andUSVI(bottom); thecolorofeachdatapointrepresentstheobservedpeakperiodatthatinstance.Rightcolumn:Same astheleftcolumnbutforthepeakwaveperiod;thecolorofeachdatapointrepresentstheobserved significantwaveheightatthatinstance.Thesolidblacklineineachplotrepresentsthelinearregression whichbestrepresentsthemodel-datarelationship,whilethegraydashedlinerepresentsaperfectfit.
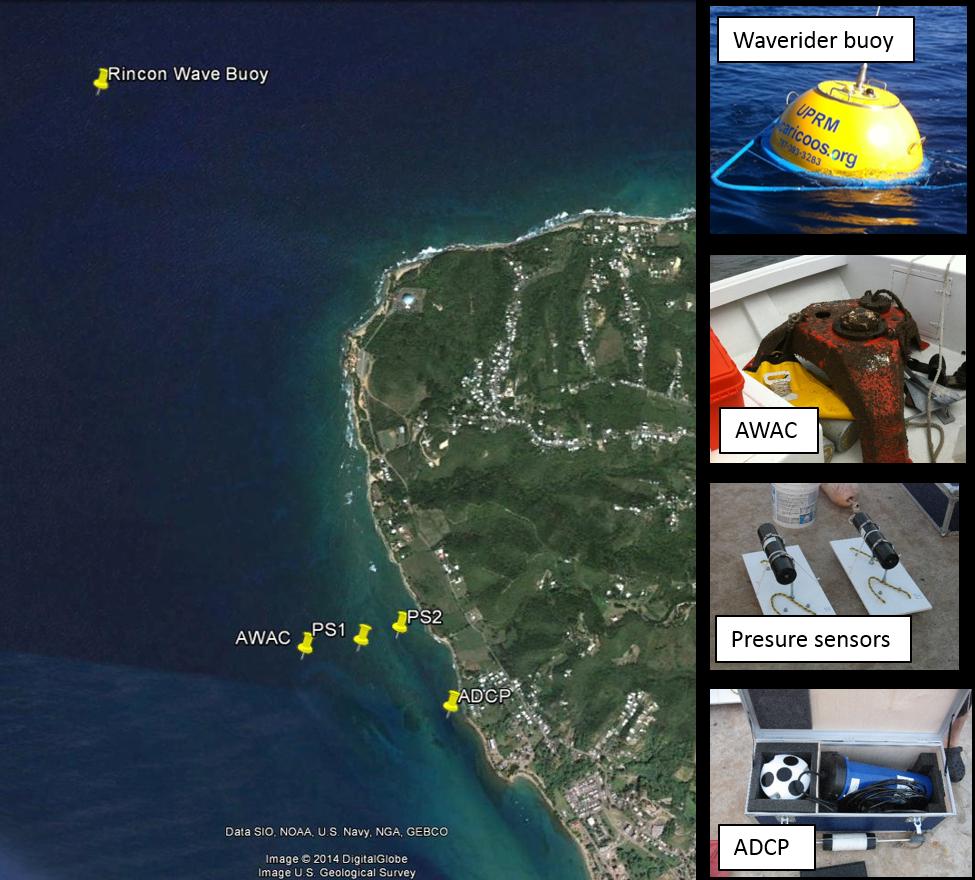
Figure3.5:LocationofthesensorsduringthevalidationexperimentconductedattheTresPalmas MarineReserveinJanuary-February2013.
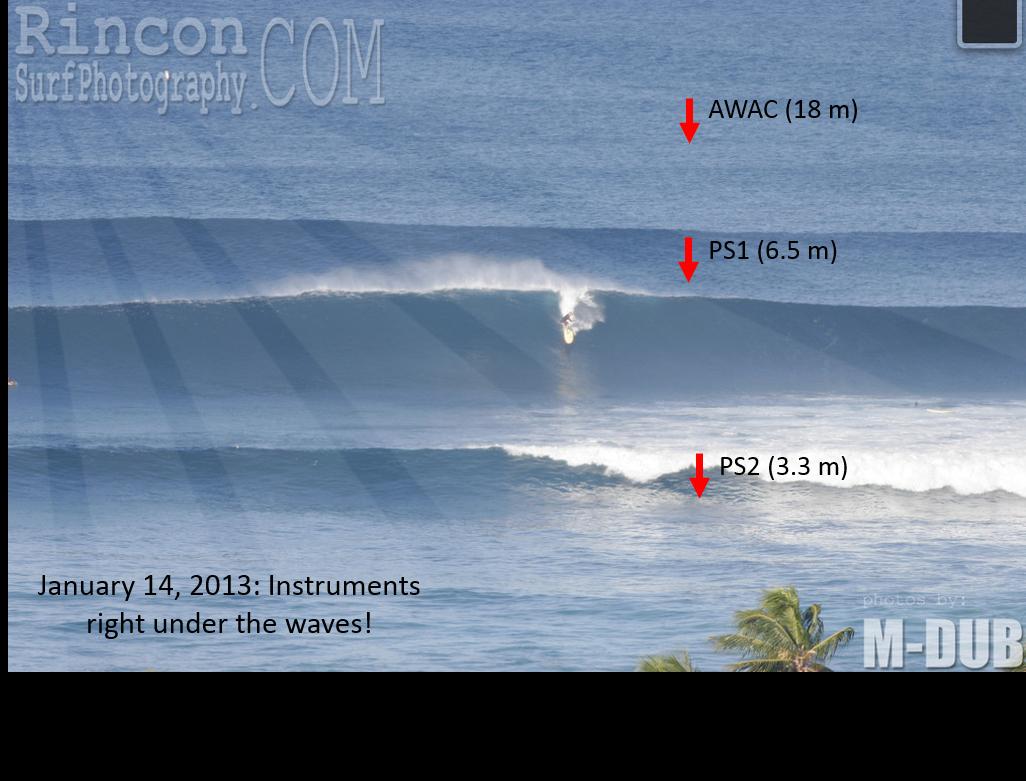
Figure3.6:Approximatelocationofthesensorsusedduringthevalidationexperimentduringalarge winterswellonJanuary14,2013.Thesensorswereinthewateronthissamedayandsuccessfully sampledthiswaveevent.
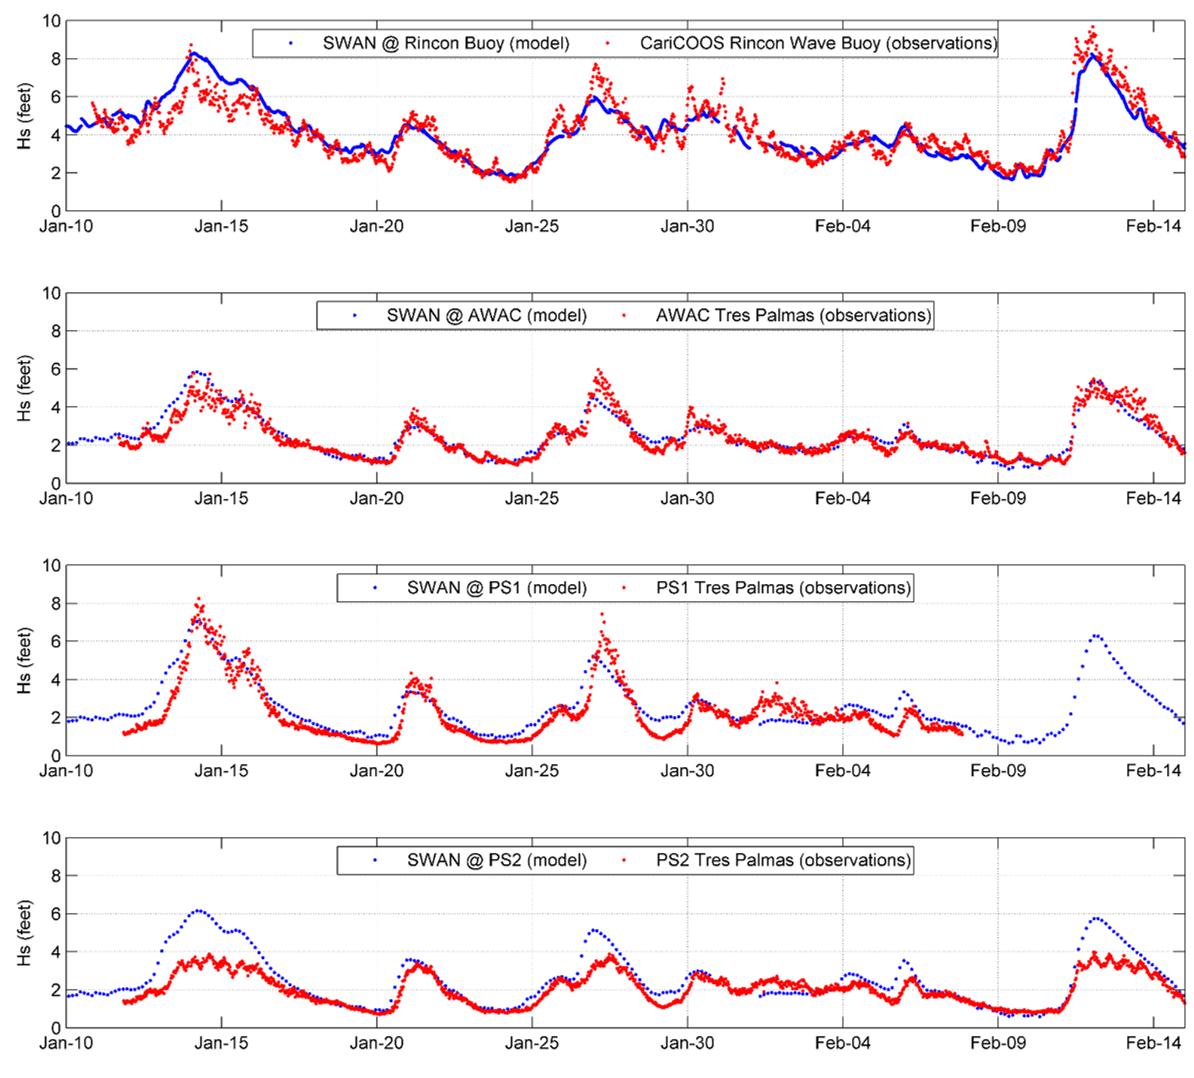
Figure3.7:ComparisonbetweenSWANpredictionsandobservedwaveheightatthefoursensors.
Thedevelopment,implementationandvalidationoftheoperationalCariCOOSNearshoreWaveModel waspresentedintheprecedingsection.ThisnumericaltoolwasshowntobeabletoadequatelyreproducethewavefieldaroundPuertoRicoandtheUSVIbothinoffshoreconditionsandjustseawardof thesurfzone.Oncethisgoalwascompleted,theprojectfocusedondevelopinganonlinetoolableto estimatebreakerheightsatthemostpopularbeachesofPuertoRicoandtheUSVI.Duringthedesign stageofthistool,namedtheCariCOOS-SeaGrantNearshoreBreakerModel,thefollowingdesign criteriawereused:
• Themodelisintendedtobeusedasabeachsafetytooltobeusedbybeachgoers,lifeguards emergencymanagementpersonnel,etc.
• Themodelneededtobeabletoadequatelyestimatetheminimumandmaximumbreakingwave heightsatindividualbeaches.
• Morethanatoolbyitself,themodelneededtotranslatethewealthofwavedataprovidedbythe SWANwavemodelintoanuser-friendlyonlinetool
• TherewasaneedtouseasimplemethodtoestimatebreakingheightsbasedontheSWANoutput forindividualbeaches,sothatthismethodcouldbeeasilymodifiedandcalibratedwithfield observationsandvisualestimates.
ThenextsectiondescribedthemethodologyforcomputingbreakerheightsusingtheSWANwave parameters.
Withinthevalidatedwavemodeldescribedintheprecedingsection,anetworkofvirtualbuoysprovidesforecastsof3to5daysinadvanceofwaveparameterssuchassignificantwaveheight,swell waveheight,meanwaveperiod,peakwaveperiod,meanwavedirectionandpeakwavedirection.A totalof84virtualbuoys(asofMarch2015)wereimplementedateachofthe84beachesatwhich breakerheightpredictionsweredesired.Specialcarewastakenwhenimplementingavirtualbuoy foraspecificbeach.Factorssuchasthelocalbathymetry,potentialseawardextentofthesurfzone duringastorm,thespatialresolutionofthenestedgridatwhichthebeachwaslocated,etc.,were consideredindeterminingthebestsuitedlocationforavirtualbuoysuchthatthebreakerheightpredictionswererepresentativeoftheconditionsateachbeach.Thelocationofeachvirtualbuoyfor
eachbeachwithinthesystemislistedinTable3.3.ItshouldbenotedthatduetothewidevariabilityinbeachtypesandthecomplexgeomorphologyandbathymetryoftheseabedaroundPR/USVI, eachvirtualbuoylocationhasadifferentdepth.However,theeffectsoflocalwaterdepthinpredictingthebreakerheightsateachbeachistakenintoaccountbycomputingthewaveenergyfluxat eachvirtualbuoy,aswillbeexplainedbelow.ThereadercanalsoexploreeachvirtualbuoylocationwithintheGoogleMapsAPIoftheCariCOOS-SeaGrantNearshoreBreakerModelwebpage: http://www.caricoos.org/Nearshore_Breaker_Model/
Therehasbeensignificantresearchconductedinordertopredictnearshorebreakingwaveheights asafunctionofoffshorewaveconditions(Peregrine,1983).Asimpleyetelegantsemi-empiricalrelationshipwasobtainedbyKomarandGaughan(1972),whoshowedvialaboratoryexperimentsthatthe heightofbreakingwaves Hb couldbeestimatedusingthedeepwaterwaveheightandwaveperiodas follows:
wherethe ∞ subscriptdenotesdeepwaterwaveconditions.Thisrelationshiponlytakesintoaccount waveshoalinganddepth-inducedbreakinganddoesnottakeintoaccounttheeffectsofwaverefraction, diffraction,bottomfriction,andwasnottestedforbottomslopeslargerthan6%(KomarandGaughan, 1972).However,itisaveryusefulrelationshipsincetheSWANwavemodelalreadytakesintoaccount mostoftheseeffectstopropagateandtransformthewavefieldtothevirtualbuoylocation.Even thoughtherearemoreinvolvedformulaeforpredictingwaveheights(LeRoux,2007),andthefactthat therelationshipshownabovecansometimesunderestimatebreakerheightsonsteepslopedbeaches (LeRoux,2007),thesimplicityofthisequationisagoodstartingpointforbreakerheightestimation. Thissimplerelationshipforbreakerheightpredictionwasderivedusinglinearwavetheoryandthe conceptofconservationofwaveenergyflux,inwhichthewaveenergyfluxindeepwaterisequaltothe waveenergyfluxatthebreakingpoint:
wherethesubscript b correspondstothebreakingpoint, E isthewaveenergydensityperunitareaand Cg isthewavegroupspeed.Thewaveenergydensityperunitarea E isgivenby:
where H isthelocalwaveheight, ρ theseawaterdensity,and g thegravitationalconstant.Thewave groupspeed, Cg ,isgivenby:
where d isthelocalwaterdepthand L isthelocalwavelength,whichisobtainedbysolvingthefull wavedispersionrelation:
where ω =2π/T isthewaveangularfrequencyand k =2π/L istheangularwavenumber.
Inordertoestimatebreakingwaveheights,asimilarapproachwasusedinthepresentstudyinwhich thetime-dependentwaveenergyfluxateachvirtualbuoyiscomputedusingequation3.2andthenused tocalculatetheequivalentoffshorewaveheightsothatequation3.1by(KomarandGaughan,1972)can beusedtoestimatethetime-dependentbreakingwaveheights.TheSWANmodeloutputateachvirtual buoyischaracterizedbythepredictedsignificantwaveheight Hsi ,meanwaveperiod Tmi ,peakwave period Tpi ,theswellwaveheight Hswi ,themeanwavedirection θmi ,andpeakwavedirection θpi . The i subscriptindicatesthatthisisthemodelestimatedwaveparameterataspecificnearshorevirtual buoy.Thetime-dependentwave-energyfluxateachvirtualbuoyisthencalculatedas:
where Cgi isthegroupspeedatthevirtualbuoylocation, di isthewaterdepthatthevirtualbuoyand Li isthewavelengthcorrespondingtotheSWAN-predictedpeakwaveperiod Tpi ,computedusingthe fulldispersionrelationgiveninequation3.5.Usingequation3.2,theequivalentdeepwaterwaveheight H∞ withanenergyfluxequaltotheenergyfluxpredictedbySWANatthevirtualbuoylocationisgiven by
where Cg∞ isthedeepwatergroupspeedcorrespondingtotheSWAN-predictedpeakwaveperiod atthevirtualbuoylocation, Tpi .Usingthisequivalentdeepwaterwaveheight,itisthenpossibleto estimatethebreakingwaveheightbasedontheavailablewaveenergyfluxatthevirtualbuoylocation, usingKomarandGaughan(1972)’srelationship:
Therationaleforusingtheaboveequationforestimatingthebreakingwaveheightsshorewardofthe locationofeachvirtualbuoyisthattheSWANwavemodelwillalreadyhavesimulatedthepropagation andtransformationofthewavefield,causingsignificantchangesinthelocalwaveenergyfluxdue totheeffectsofwaverefraction,diffraction,bottomfriction,surfacewindstress,andotherphysical mechanismsofwaveenergydissipation.Thelocalwaveenergyfluxateachvirtualbuoy, Pi ,isthus ameasureofthewaveenergyavailabletogeneratebreakingwavesateachbeach.Thisenergywill belargerorsmallerthantheoffshorewaveenergyfluxdependingontheeffectsofbathymetry,wave shadowing,etc.
Equation3.10,aspresented,providesanestimateofthesignificantheightofbreakingwaves.For beachsafetyandrecreationalpurposes,thesignificantbreakingwaveheight, Hb1/3 ,willnotnecessarily bethemostusefulvalueforasurferorbeachgoer.Fromabeachsafetyperspective,providingsuchan estimatewouldsignificantlyunderestimatethepotentialdangerofbreakingwaves.Theaverageofthe top10%or1%ofthewavesduringaspecifictimeperiodcouldbeamoreusefulestimateofactual breakingwaveheights(CaldwellandAucan,2007).Thesequantitiesaregivenby:
Ingeneral,itisverydifficulttovalidateestimatesofbreakingwaveheightsinthefield,andmostof thebreakingwaveheightresearchhasbeenconductedinthelaboratory(Peregrine,1983).Inorderto determineiftheformulaepresentedaboveprovidereasonableestimateofbreakerheights,thebreaker heightmodelpredictions, Hb1/10 and Hb1/100 ,werecomparedtoadatasetofvisuallyestimatedsurf heightsfromtheRinc´onSurfReportwebsite: http://rinconsurfreport.com/.Theownerof thissurfreportserviceprovidesdailysurfreportsintheRinc´onarea,mostlyatDomesBeach,although reportsaresometimesprovidedfornearbybeaches.SinceDomesBeachisoneofthe84beachesat whichbreakerheightpredictionsareprovidedintheCariCOOS-SeaGrantNearshoreBreakerModel, morethantwoyearsofthisdatasetwereusedandcomparedtomorethantwoyearsofSWANwave data.ThevisuallyestimatedbreakerheightsfromRinc´onSurfReport(RSR)weretranslatedtocrest tothroughvaluesinfeetusingthevisualscaleusedbysurfers(http://www.surfline.com/ surf-science/wave-heights---forecaster-blog_22495/),asfollows:
0’=flat
1’=ankle-shinhigh
2’=knee-thighhigh
3’=waist-bellyhigh
4’=chest-shoulderhigh
5’=headhigh
6’=1footoverhead
8’=3’overhead
10’=5’overheadorDoubleOverheadfaces
12’=DoubleOverhead+faces
15’-20’=TripleOverhead+
Thelargervisualestimateswillcarrythelargestuncertainty.Inaddition,thereisconsiderableuncertaintyregardingtherelationshipbetweenthevisuallyestimatedsurfheightsconductedbysurfersand thestatisticalwaveparameterssuchassignificantwaveheight,etc.CaldwellandAucan(2007)report thattheupperlimitofthesevisualestimatesusuallycorrespondtoeither Hb1/10 or Hb1/100 ,whichcorrespondtothebreakerheightsofthetop10%or1%waves,respectively,duringtheobservationperiod. Itshouldbenotedthatthevisuallyestimatedbreakerheightscanbehighlysubjectiveandthescale usedcanvarywidelyfromoneobservertoanother,andthattheresultsshouldbetreatedwithcaution. However,theRSRestimateshasprovidedavaluabledatasetinordertogaugetheperformanceofthe breakerheightpredictionsusingtheequivalentoffshorewaveheightmethoddescribedabove.
Figure3.8showsacomparisonbetweenthemodelestimatedbreakerheights(Hb1/10 inblueand Hb1/100 incyan)andthevisuallyestimatedbreakerheights(redpoints)inferredfromtheRinc´onSurf Reportdatabase.Visualinspectionrevealsthatthemodelpredictionsfollowthegeneraltrendofthe observations,exceptforthelargestwaveevents,inwhichthemodelunderestimatesthevisuallyinferred breakerheights.Giventhenatureoftheobservationsdataset,itisdifficulttodeterminethereason forthisdiscrepancy.Itcouldbeduetothefactthatwhenthewavesareverylarge,thesurfheight observationsaregenerallyobtainedatTresPalmasandnotatDomesBeach.Itiswellknownthatduring verylargewaveevents,waverefractioncausesverylargewavestofocusandbreakonTresPalmasand thatthesewavescanbelargerthanthosefoundatDomesBeachduringlongperiodswells.Another reasonforthediscrepancyduringthelargesteventscouldbeduetoanunderestimateofthewaveheight bytheCariCOOSNearshoreWaveModel,aswasnotedintheprevioussectioninFigure3.3.However, giventhehighlysubjectivenatureofvisuallyestimatedbreakerheights,thehypothesesformulated abovecannotbeconfirmedorrejectedandremainasspeculation.Figure3.9showsascatterplotofthe relationshipbetweenthevisuallyestimatedbreakerheightsfromRSRandthemodelestimatedbreaker heights(Hb1/10 inblueand Hb1/100 inred)andthecorrespondingleastsquareslinearfit.Thegray dashedlinerepresentsahypotheticalperfectfit.Itisevidentthatboth Hb1/10 and Hb1/100 overestimate thebreakerheightsforsmallereventsandunderestimatethebreakerheightsforlargerevents.However, giventhehighlysubjectivenatureofvisuallyestimatedbreakerheights,theseresultsshouldbetreated withcaution.
Basedontheresultsdiscussedabove,untilabettermodelvalidationeffortiscarriedout,the Hb1/100 estimatehasbeendeterminedtobethebestestimatorofthebreakingwaveheightsandhasbeenim-
Model estimated Hb 1/10
Model estimated Hb 1/100
Rincon Surf Report
Figure3.8:Comparisonbetweenmodelestimatedbreakerheights(Hb1/10 inblueand Hb1/100 incyan) andthevisuallyestimatedbreakerheights(redpoints)inferredfromtheRinc´onSurfReportdatabase (http://rinconsurfreport.com/). plementedastheupperboundforthetime-dependentbreakerheightsintheCariCOOSSeaGrant NearshoreBreakerModel.Thelowerboundofthebreakingwaveheightshasbeenchosenasthe significantwaveheight Hsi providedbySWANateachvirtualbuoylocation.WhileanempiricalrelationshipbetweentheSWANwaveparametersandthevisuallyestimatedsurfheightscouldintheory beobtained,thisapproachwasnotusedsinceitisverylikelythatsuchanempiricalrelationshipwould onlybevalidatDomesBeachandcouldnotbeextrapolatedtotheother84beachesinPR/USVIwithin thebreakerpredictionsystem.Ontheotherhand,theKomarandGaughan(1972)modelimplemented hereinhasasolidtheoreticalfoundationandislikelytoberobustthroughouttheregion.
Visually estimated Hb vs. simulated Hb 1/10
Visually estimated Hb vs. simulated Hb 1/100
LS Fit of Visually estimated Hb vs. simulated Hb 1/10
LS Fit of Visually estimated Hb vs. simulated Hb 1/100
Perfect t
Visually estimated breaker heights from RSR
Figure3.9:Scatterplotshowingtherelationshipbetweenthevisuallyestimatedbreakerheightsfrom RSRandthemodelestimatedbreakerheights(Hb1/10 inblueand Hb1/100 inred)andthecorresponding leastsquareslinearfit.thegraydashedlinerepresentsahypotheticalperfectfit.Itisevidentthatboth Hb1/10 and Hb1/100 overestimatethebreakerheightsforsmallereventsandunderestimatethebreaker heightsforlargerevents.However,giventhehighlysubjectivenatureofvisuallyestimatedbreaker heights,theseresultsshouldbetreatedwithcaution.
Figure3.10showsanexampleofabreakerheightvirtualbuoyforJobosBeach.Besidestherangeof expectedbreakerheights,thevirtualbuoyalsoprovideswaterlevelandwindpredictionsforeachbeach. Similarpredictionsareavailablefor84beachesinPR/SUVIintheCariCOOS-SeaGrantNearshore
BreakerModelwebpage: http://www.caricoos.org/Nearshore_Breaker_Model/.
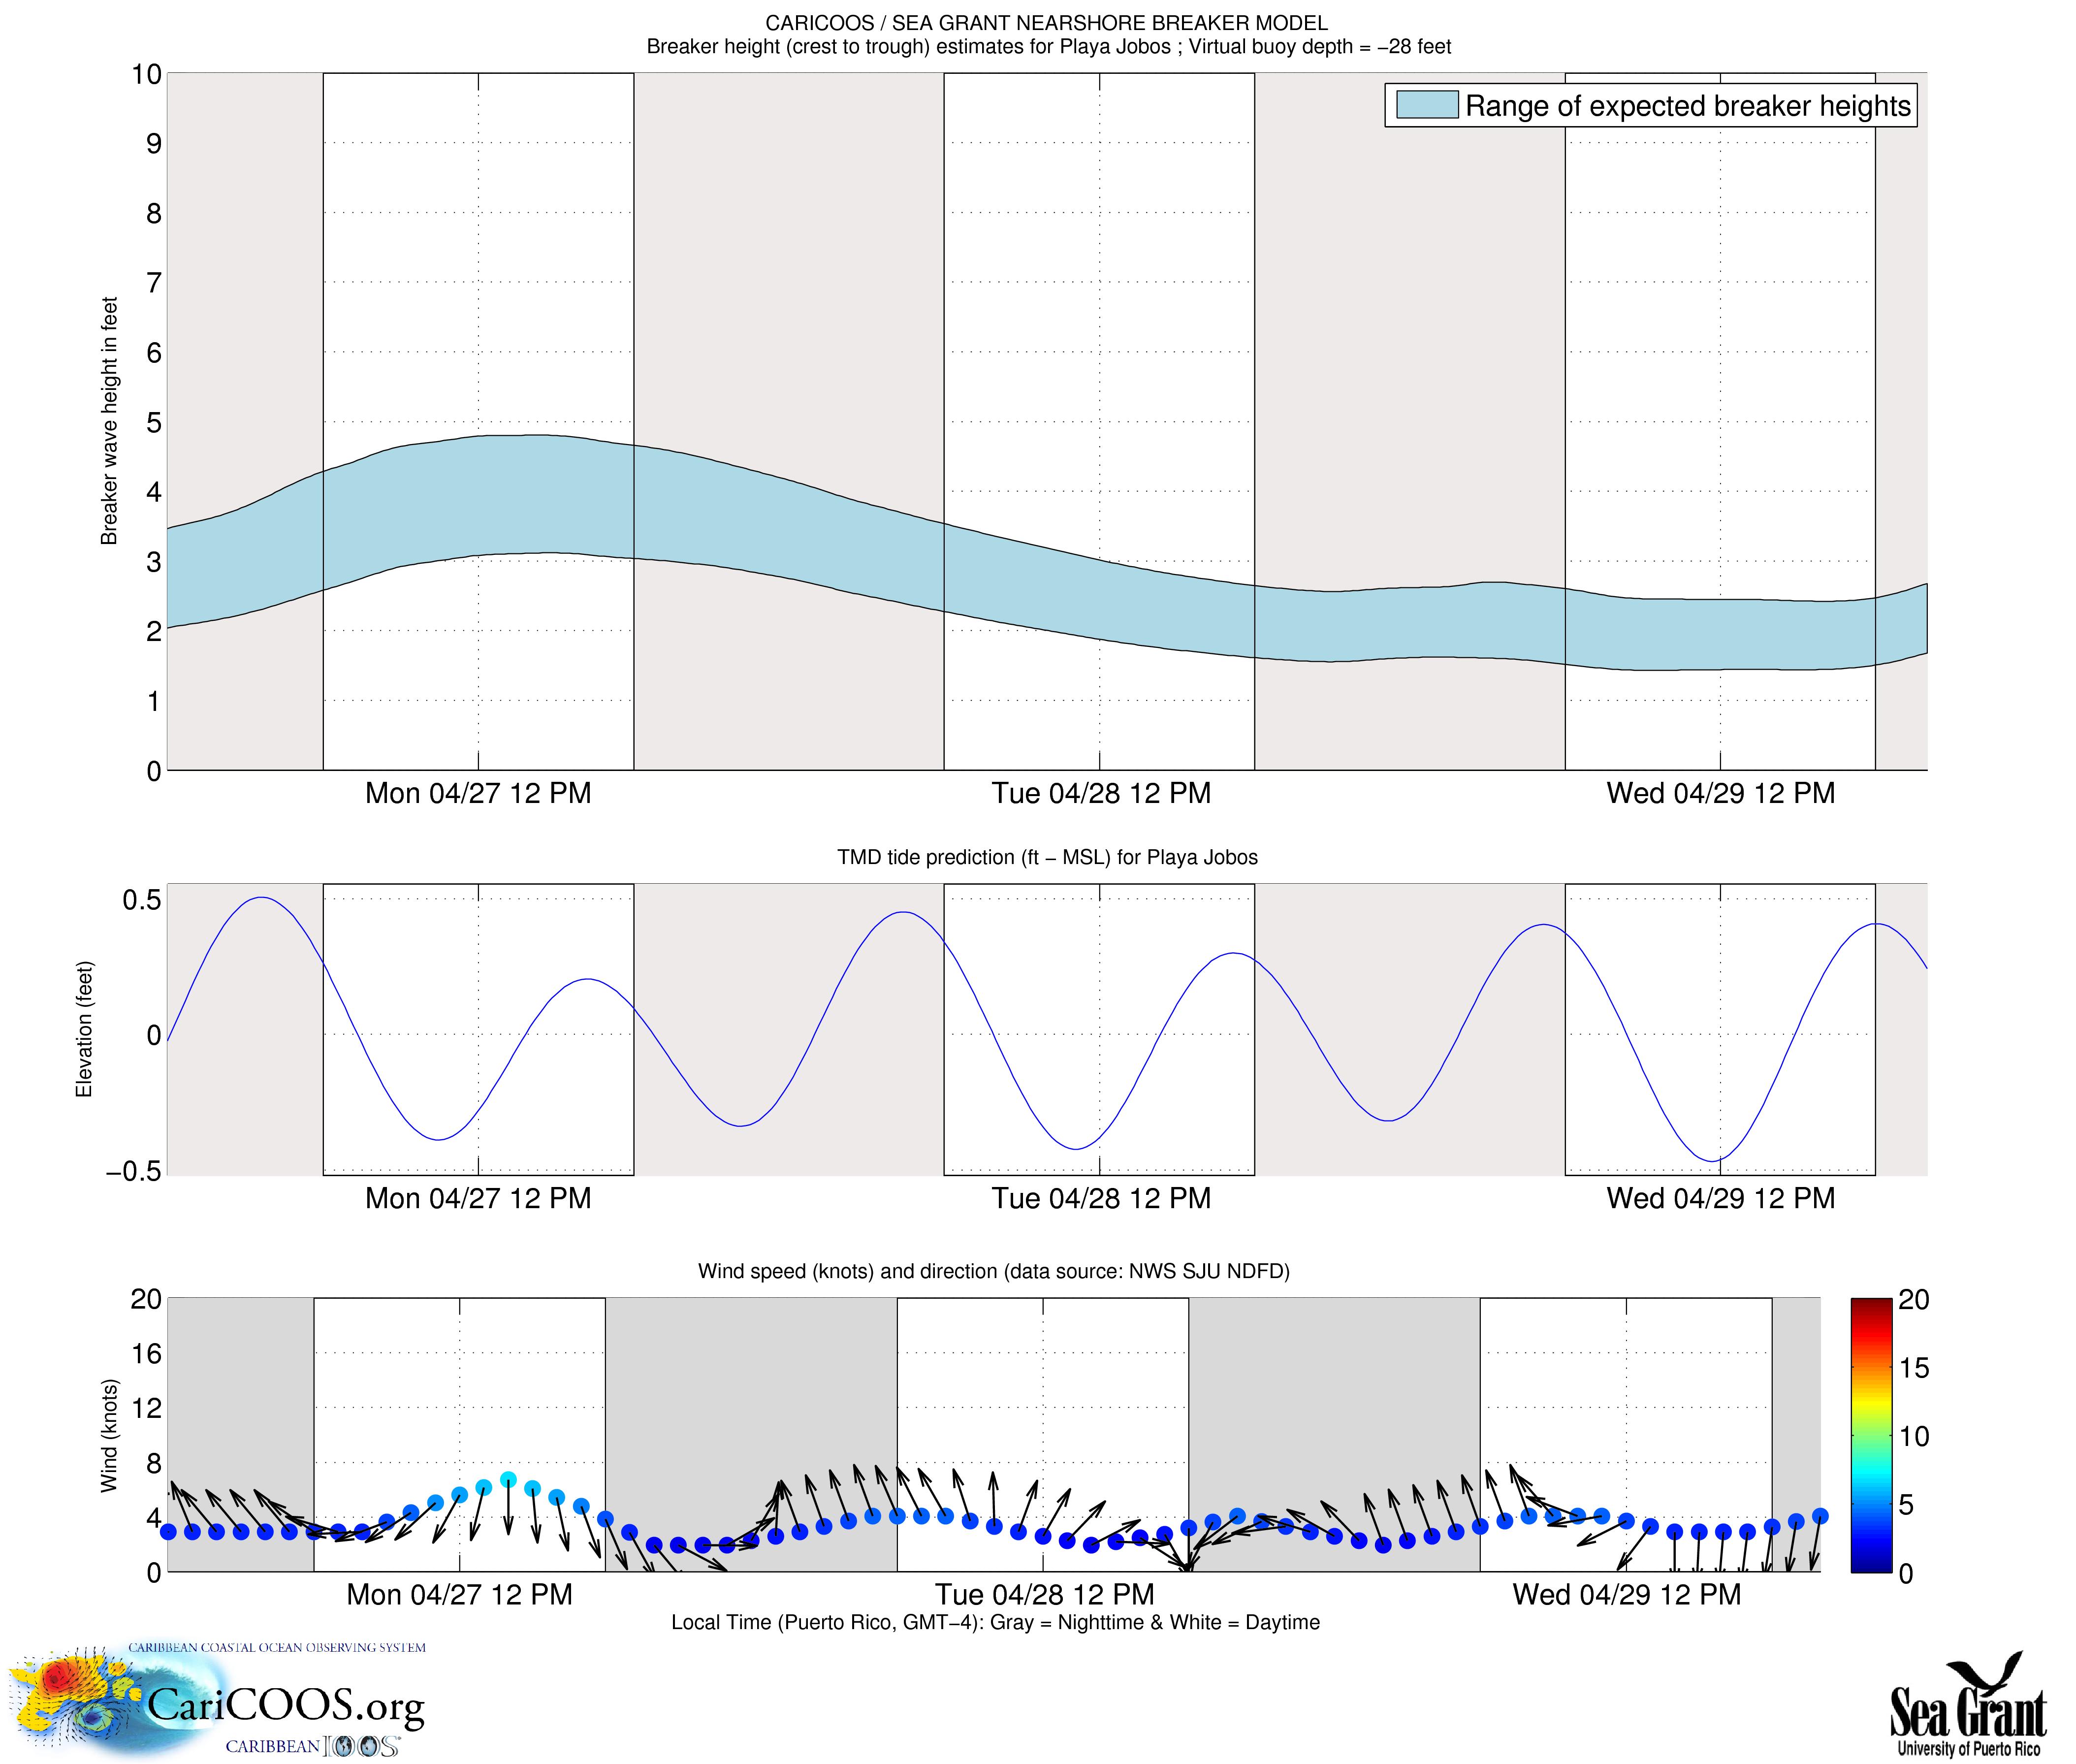
Figure3.10:SampleoutputofthebreakerheightvirtualbuoyforJobosBeach.Besidestherangeof expectedbreakerheights,thevirtualbuoyalsoprovideswaterlevelandwindpredictionsforeachbeach. Similarpredictionsareavailablefor84beachesinPR/USVIintheCariCOOS-SeaGrantNearshore BreakerModelwebpage: http://www.caricoos.org/Nearshore_Breaker_Model/.
3.2.2TheWebpage
AcustomwebpagewasdevelopedtohousetheCariCOOSSeaGrantNearshoreBreakerModel: http: //www.caricoos.org/Nearshore_Breaker_Model/.ThewebpageconsistsofaGoogle
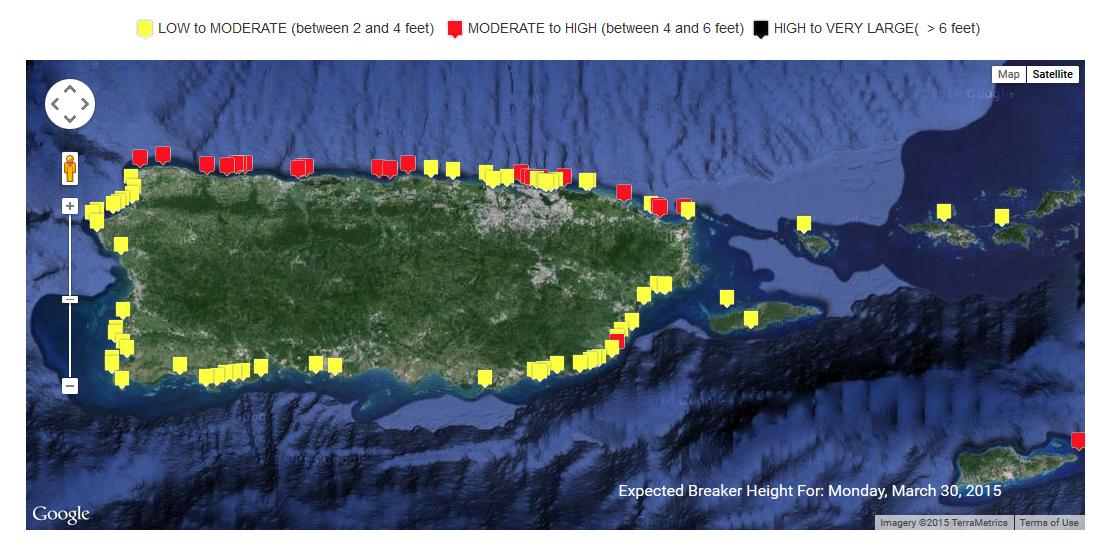
MapsAPIwhichallowstheusertozoomandclickonabreakerheightvirtualbuoyforaspecificbeach. Inaddition,asearchabletableliststhebeachesatwhichbreakerheightpredictionsareprovided.The usercansortthebeachesbasedonalphabeticalorder,breakerheightlevel,etc.Acolorcodesystemhas beenimplementedtoindicatewhichbeacheshavespecificvaluesofmaximumwaveheights.Ayellow colorindicatesmaximumbreakingwaveheightslessthan4feet,redindicatesbreakersbetween4and 6feet,andblackindicatesbreakerslargerthan6feet.Themaximumvalueof Hb1/100 foraspecific beachisdeterminedbycomputingthemaximumvalueof Hb1/100 between5AMand7PMlocal time(LST)foreachday.Thetimewindowfordeterminingthemaximumexpectedbreakerheights wasimplementedbasedonconsultationswiththeNationalWeatherServiceSanJuanWeatherForecast Office,sinceitisthesametimewindowusedfortheirripcurrentforecasts.
TheCariCOOSNearshoreWaveModel,thenumericalenginebehindthebreakerpredictionsystem describedherein,isruntwiceperdayonseparatehighperformanceparallelcomputingfacilitiesowned byCariCOOSandlocatedatMagueyesIslandandatthemaincampusatUPRM.Asaresult,boththe wavemodelandthebreakerpredictionsystemarefullyoperationalandredundant.TheCariCOOS NearshoreWaveModel,inparticular,hasshownanuptimeofmorethan99%sincethemodelwas releasedinlate2012.
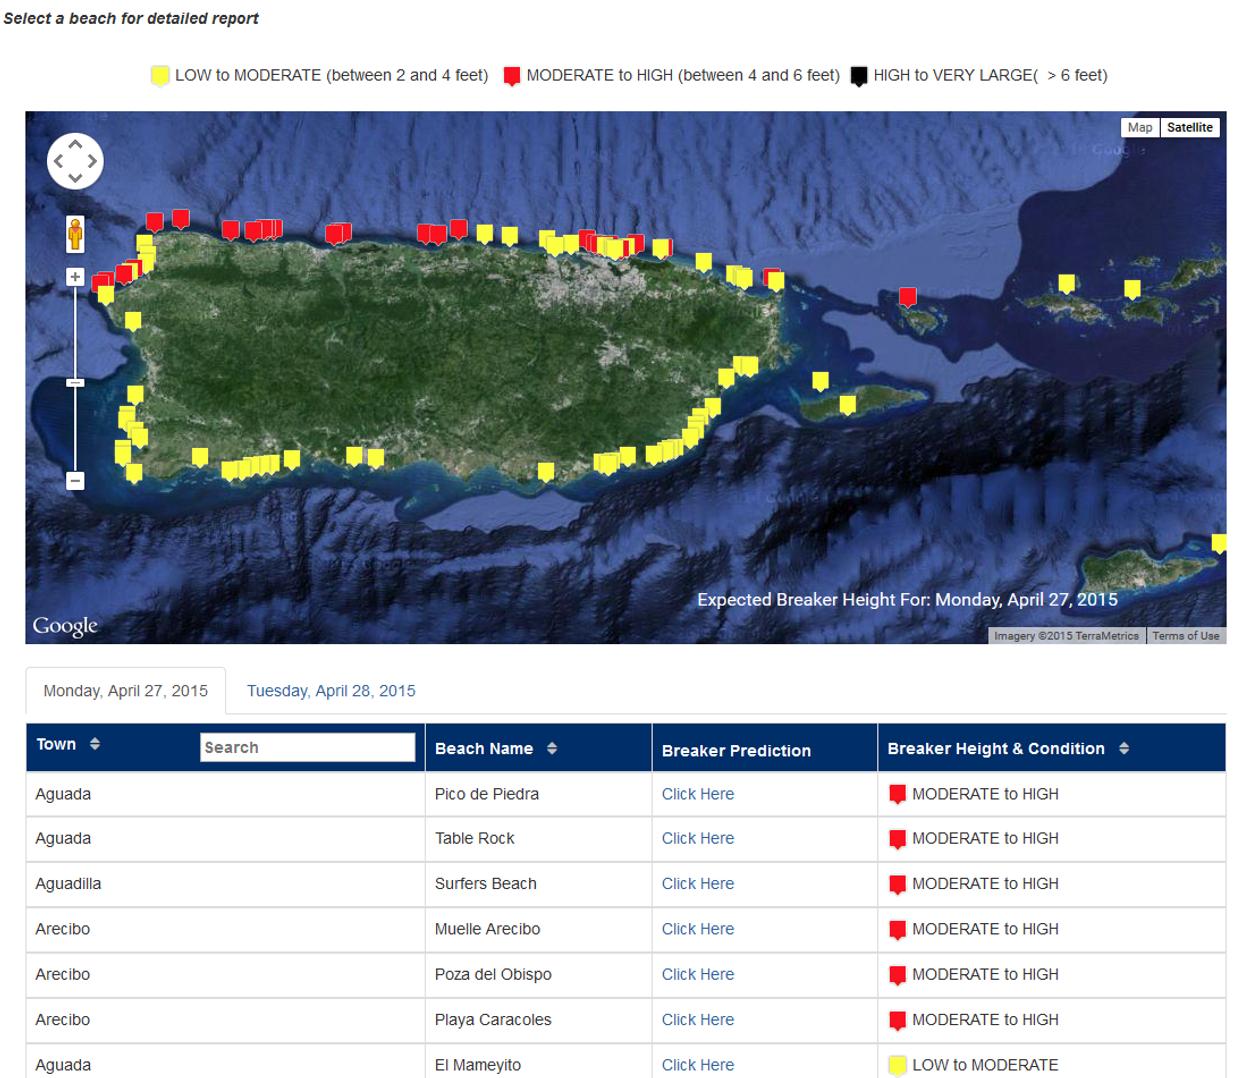
Figure3.11:SnapshotoftheCariCOOS-SeaGrantNearshoreBreakerModelwebpage: http:// www.caricoos.org/Nearshore_Breaker_Model/.
BEACHNAME MUNICIPALITY LAT LON SWANGRID
LosTubos Manati 18.47965 -66.45291 AREC
PlayaJobos Isabela 18.51711 -67.0771 NWPR
VaciaTalega1 Loiza 18.447407 -65.915614 SJBAY
VaciaTalega2 Loiza 18.449193 -65.907849 SJBAY
BalnearioLuquillo Luquillo 18.38821 -65.73664 NEPR
CostaAzul Luquillo 18.38341 -65.71854 NEPR
SevenSeas Fajardo 18.37209 -65.63602 NEPR
BalnearioHumacao Humacao 18.15 -65.7567 SEPR
Guayanes Yabucoa 18.06 -65.82 SEPR
PlayaLucia Yabucoa 18.04265 -65.82879 SEPR
LosBajos Patillas 17.97076 -65.99442 SEPR
BalnearioArroyo Arroyo 17.95703 -66.03397 SEPR
VillaFomento Arroyo 17.95037 -66.04198 SEPR
CanaGorda Guanica 17.94938 -66.8823 PONCE
PlayaSanta Guanica 17.9367 -66.9589 PONCE
PlayaBallena Guanica 17.95237 -66.85618 PONCE
PlayitaRosada Lajas 17.96898 -67.03066 PONCE
Combate Cabo Rojo 17.97 -67.2167 MAYA
Mojacasabe Cabo Rojo 17.9878 -67.2167 MAYA
BalnearioBoqueron Cabo Rojo 18.0122 -67.1767 MAYA
PlayaBuye Cabo Rojo 18.05113 -67.20892 MAYA
VillaLamela Cabo Rojo 18.06538 -67.20624 MAYA
PenonBrusi Camuy 18.49376 -66.85297 AREC
BalneariodeRincon Rincon 18.34096 -67.25785 NWPR
ParqueColon Aguadilla 18.41466 -67.16328 NWPR
Crashboat Aguadilla 18.45871 -67.1662 NWPR
MuelleArecibo Arecibo 18.47893 -66.70632 AREC
MarChiquita Manati 18.481 -66.48496 AREC
PuertoNuevo Vega Baja 18.4922 -66.4028 DORA
CerroGordo Vega Alta 18.48236 -66.34112 DORA
PuntaSalinas Toa Baja 18.47005 -66.18968 SJBAY
BalnearioDorado Dorado 18.4767 -66.2817 DORA
PicodePiedra Aguada 18.3878 -67.21466 NWPR
AguadillaBreakwater Aguadilla 18.43205 -67.15728 NWPR
SurfersBeach Aguadilla 18.50736 -67.14138 NWPR
Table3.3:ListofbeachesincludedasofMarch2015inthenearshorebreakerpredictionsystem.
PlayaSucia Cabo Rojo 17.9322 -67.19 PONCE
LaPared Luquillo 18.3781 -65.71275 NEPR
PozadelObispo Arecibo 18.48421 -66.69511 AREC
PlayaFlamenco Culebra 18.33749 -65.31594 NECR
StRegis Rio Grande 18.417164 -65.810848 NEPR
TunelGuajataca Quebradillas 18.49086 -66.95676 AREC
ElEscambron San Juan 18.468378 -66.092728 SJBAY
LaConcha San Juan 18.459722 -66.073431 SJBAY
Condado San Juan 18.456588 -66.062231 SJBAY
OceanPark San Juan 18.454266 -66.049921 SJBAY
IslaVerde1 San Juan 18.448333 -66.031765 SJBAY
IslaVerde2 San Juan 18.445893 -66.02412 SJBAY
PineGrove San Juan 18.446095 -66.010208 SJBAY
BalnearioCarolina San Juan 18.450554 -65.998893 SJBAY
Levittown Toa Baja 18.453748 -66.170528 SJBAY
PalmasdelMar Humacao 18.081963 -65.787744 SEPR
DomesBeach Rincon 18.3658 -67.27232 NWPR
LaEsperanza Catano 18.4578 -66.1333 SJBAY
Pinones Loiza 18.458081 -65.975047 SJBAY
PlayaEscondida Fajardo 18.380787 -65.647306 NEPR
SunBay Vieques 18.087885 -65.461124 NECR
MagensBay St Thomas 18.367023 -64.932131 USVI
TrunkBay St John 18.355639 -64.772143 USVI
CramerPark St Croix 17.77 -64.56 STCR
ElMameyito Aguada 18.3933 -67.2 NWPR
TableRock Aguada 18.401256 -67.190939 NWPR
SandyBeach Rincon 18.372667 -67.258154 NWPR
BalnearioAnasco Anasco 18.282735 -67.193405 MAYA
PlayaCaracoles Arecibo 18.483903 -66.685126 AREC
PlayaCangrejo Arroyo 17.9544 -66.0589 SEPR
Pozuelo Guayama 17.934463 -66.191893 SEPR
VillaTaina CaboRojo 18.0278 -67.1878 MAYA
Joyuda CaboRojo 18.112111 -67.185807 MAYA
PeonLosAmadores Camuy 18.493664 -66.86888 AREC
LosAlmendros Camuy 18.491579 -66.877439 AREC
Continuedfrompreviouspage:ListofbeachesincludedasofMarch2015inthenearshorebreaker predictionsystem.
PuntalasMarias Carolina 18.456161 -66.038809 SJBAY
PuntaVentana Guayanilla 17.962941 -66.80687 PONCE
PlayaLarga Maunabo 17.989042 -65.880367 SEPR
PlayaLosBohios Maunabo 17.9878 -65.8922 SEPR
PlayaCalifornia Maunabo 17.980529 -65.904788 SEPR
ElChannel Patillas 17.973319 -65.932922 SEPR
TropicalBeach Naguabo 18.1789 -65.7211 SEPR
Hucares Naguabo 18.180938 -65.705012 NECR
BahiaLima Naguabo 18.178431 -65.698784 NECR
LaGuancha Ponce 17.966917 -66.604587 PONCE
ElTuque Ponce 17.971226 -66.656601 PONCE
PuertoHermina Quebradillas 18.486744 -66.900901 AREC
ElCocal Yabucoa 18.012431 -65.844052 SEPR
ElNegro Yabucoa 18.02777 -65.828738 SEPR
PuertoMosquito Vieques 18.143371 -65.529218 NECR
LasPardas Guanica 17.939764 -66.927945 PONCE
Jaboncillo Guanica 17.9478 -66.9056 PONCE
Continuedfrompreviouspage:ListofbeachesincludedasofMarch2015inthenearshorebreaker predictionsystem.
Oneofthegravestdangerstobeachgoersareintensesurfzonecurrentswhicharecausedbywaveinducedpressuregradients.Themostpopulartypeofsurfzonecurrentsareripcurrents,whichare mostfrequentduringshore-normalwaveincidence.Ripcurrrentsstrengthis,ingeneral,afunctionof wavesizeandlocalbathymetry.Thereare,however,severalothertypesofcurrentssuchasalongshore jetsandtopographicallyinducedcirculation,whichcancauseserioushazardsforbeachgoers.Insome beachesthesecurrentsareactuallymoredangeroustoswimmersthantheinfamousripcurrents.Infact, thereareseveralbeachesinPuertoRicothatcurrentlyhaveripcurrentwarningsignsinstalledbutwhich donotexhibitripcurrentbehavior.Instead,othertypesofcurrentsthatarelessvisibleandpotentially moredangerousdominatethesebeaches.Giventhatthesesignsprovideinstructionsonhowtoescape fromaripcurrent,thesesignsareactuallyprovidingerroneousandpotentiallydangerousinformation tobeachgoers.
Thefinalobjectiveofthepresentprojectwastoperformnumericalsimulationsofdangerousbeaches inPuertoRicoatwhichripcurrentsdonotdominate.Twobeacheswereidentifiedashavingstrong wave-inducedcurrentswhichdonotexhibittheusualripcurrentstructure:JobosBeachinIsabelaand DomesBeachinRinc´on.Bothofthesebeachesareresponsibleforseveralfatalitieseachyearandboth exhibitstrong,coherenttopographicallycontrolledcurrentpatternswitharepeatableandrelativelypredictablespatialstructure.Bothnumericalsimulationsandfieldobservationswereconductedtoelucidate thisspatialstructure.Theintentofthenumericalsimulationswastoconfirmfromaqualitativeperspectivetheexistenceofthesecoherentpatternswhichhaveledtoseveraldrowningdeathsandwhichhave longbeensuspectedbylocalsurfersandresidents.Preliminarydrifterdeploymentswereusedtoqualitativelyconfirmthemodelresults.Rigorousvalidationofthevelocityfieldateachbeachasafunction ofeverypossiblewaveforcingconditionwasoutofthescopeofthepresentproject.
JobosBeachislocatedinthemunicipalityofIsabelaonthenorthwestcoastofPuertoRicoasshownin Figure3.12.Thisbeachisverypopularandfrequentlyvisitedbylocalsaswellastouristsyearround. AnaerialviewofthebeachisshowninshowninFigure3.12whichindicatesthemainareasofthe beach.TheswimmingareasappeartobesafetobathersbecauseofthepresenceoftheJobosRock, whichprovidesprotectionfromdirectwaveaction.Inaddition,therearezonesofveryshallowwater whichmightgivebathersafalsesenseofsecurityduringdayswithheavyswell.Duringatypicalday, surfersfrequentlyhelpbeachgoersgetbacktotheshoreafterbeingpulledbyhazardouscurrentsfrom theswimmingareasintothesurfingarea.
1OmarL´opez,astudentwhoparticipatedinthepresentprojectduringhisundergraduatestudiesincivilengineeringat UPRMandwhoisnowaPhDstudentinoceanengineeringatStevensInstituteoftechnology,contributedsignificantlyto thissectionregardingtheworkatJobosBeach.
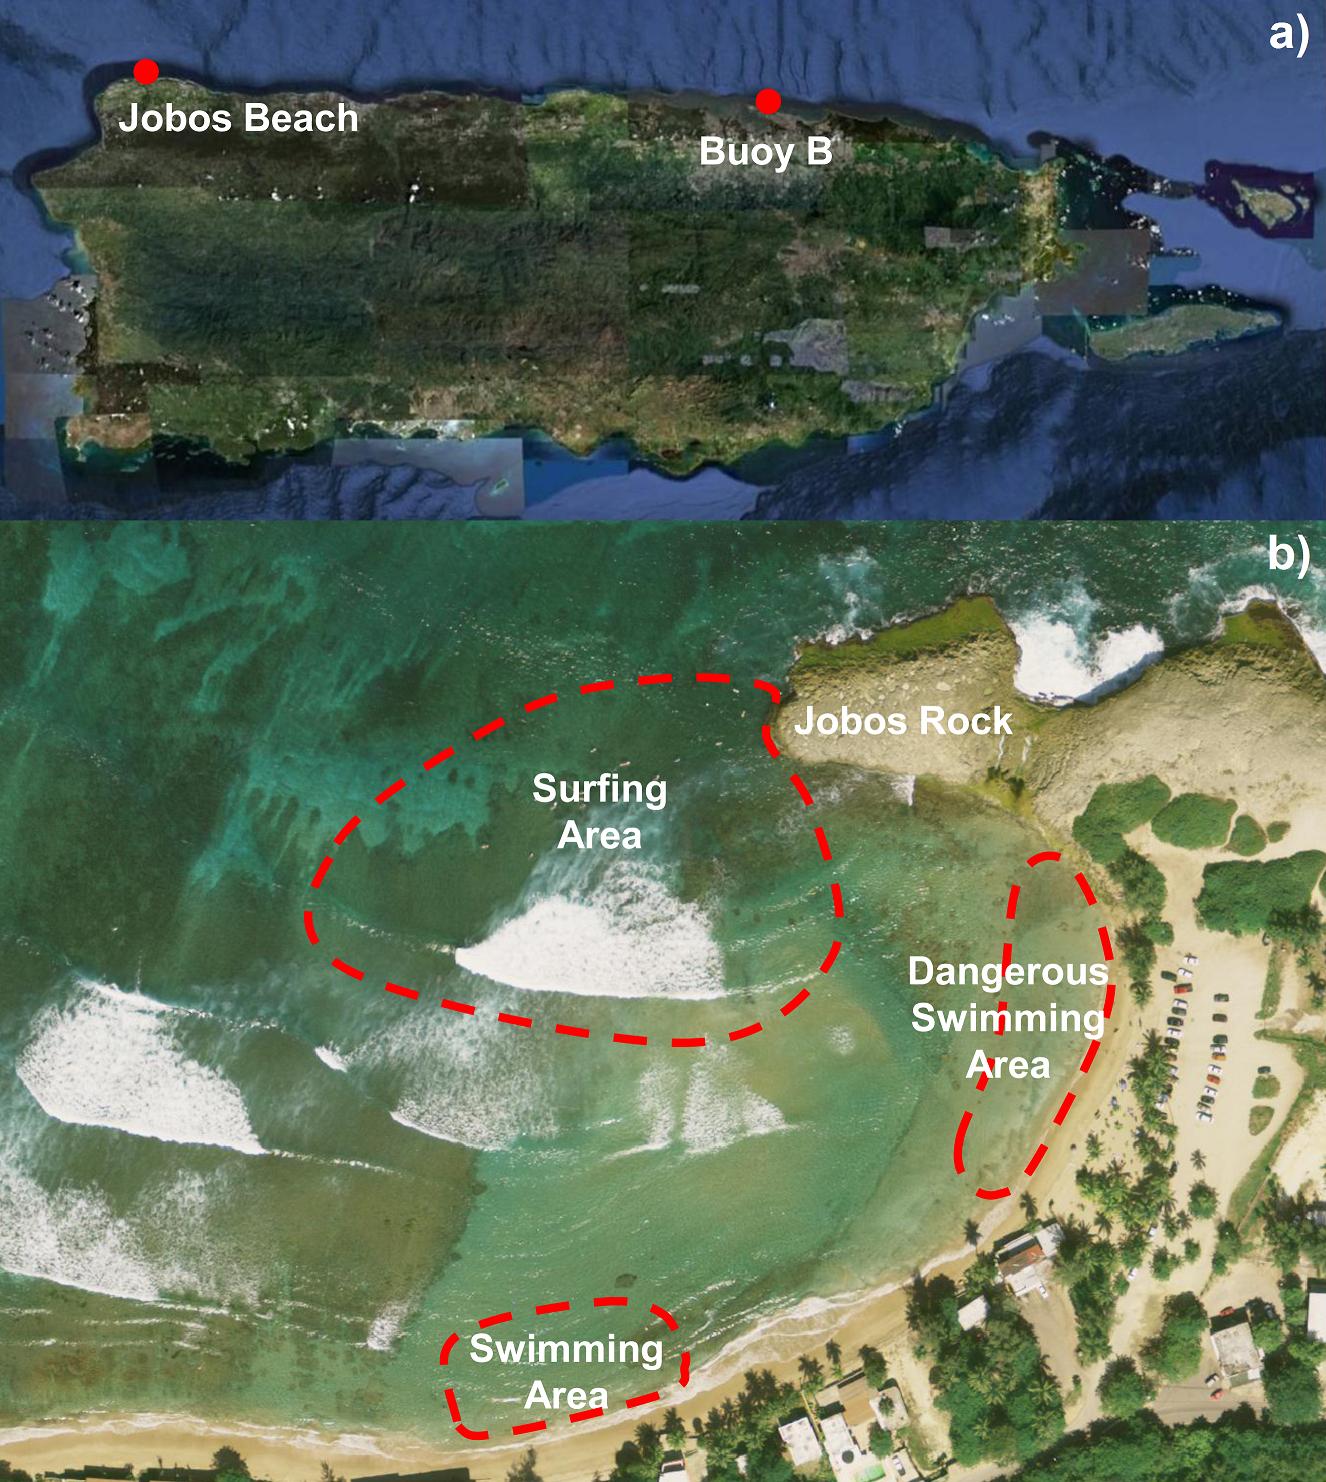
Figure3.12:Top:LocationofJobosBeachandCariCOOSBuoyB,whichprovidedthewavedata usedtoforcedthewavemodel.Bottom:AerialimageofJobosBeachshowingdangerouslocationsfor beachgoers.
ThecommonscenarioofapotentialdrowningincidentatJobosBeachisthatthepersonfeelsconfidentwadinginthedangerousswimmingareashowninFigure3.12.Usuallytheindividualgetsswept bythewave-inducedcurrentandnoticesthatheorsheisbeingdraggedawayfromtheshore.Generally,
theindividualstartstoswimtowardstheshoreintheoppositedirectionthattheyarebeingdragged.In otherwords,thepersonstartsswimmingagainstthecurrentwhiletryingtoreachtheshallowwaterzone thatseemstobesoclose.Eventually,thepersongetsdraggedintothesurfingareawhereitisneither shallownorsafe.Thewaveactioninthiszoneinducespanicand,asaresultofrepeatedlytryingto swimunderbreakingwaves,thepersongetstiredrapidly.ThosewhoareluckytoreachJobosRock willtrytoclimbuptherockandgethurtwhenthewavesimpacttherock.Ifsurfersorpeopleinthe beachdonotnoticethesituation,manytimesthepersonwilldrown.
Tounderstandthewave-inducedcirculationatJobosBeach,afullynonlinearphase-resolvingBoussinesqwavemodel,BOUSS2D(NwoguandDemirbilek,2001)wasused.Thismodelwasselectedbecauseitresolvescomplexwavetransformationprocessessuchaswaverefraction,diffraction,shoaling andbreakingaroundstructuresandovervariablebathymetryinsmallregions.Inaddition,BOUSS2D computesthetime-averagedwave-inducedcurrents.
The10-meterresolutionUSGSDigitalElevationModelwasusedasthemodelbathymetryforJobos (Tayloretal.,2006).Makinguseofthisdata,alongwithvisualinspectionoftheareaandUSGShighresolutionorthoimagery,thebathymetrywascorrectedbyhandtocapturesmallscaleshorelineand beachfeaturesasaccuratelyaspossible.A3meterresolutiongridorientedinthenorth-southdirection wasused,withawavemakerboundaryconditionatthenorthernboundary.Twofieldexperimentswere carriedoutusingsimpleandinexpensiveGPS-trackedLagrangiandriftersconstructedusingthedesign outlinedinMacMahanetal.(2009),inordertocomparethespatialstructureofthevelocityfieldfrom themodelwiththefieldobservations.Thewavemakerwassettogenerateirregularwavesutilizinga JONSWAPspectrumgeneratedusingthewavestatisticsobtainedfromtheCariCOOSBuoyBinSan Juan,PuertoRicoduringthetimeofthefieldobservations.
Figure3.13showsacomparisonbetweenthecurrentssimulatedbyBOUSS2D(coloredvectors) andthetrajectoryoftheGPStrackeddrifterforthefieldexperimentcarriedoutonFebruary7,2011. Thewaveconditionsonthisdayrepresentedatypicaldayofsmalltomoderatewinterwaves,withthe CariCOOSSanJuanBuoyshowingasignificantwaveheightof1.8meters,adominantwaveperiodof9 secondsandadominantwavedirectionof60degrees(truenorth).Notethecoherentcounterclockwise circulationpatternwhichisevidentinboththemodeloutputandinthedriftertrajectory.Anadditional fieldexperimentwascarriedoutonMay272011.Thewaveconditionsonthisdayweretypicalof asummerday,withsignificantwaveheightof1meterandperiodsof10secondsasmeasuredbythe CariCOOSSanJuanBuoy.Acomparisonbetweenthesimulatedcurrentsandthetrajectoriesoftwo driftersisshowninFigure3.14.
Figure3.15showsapreliminarydraftofawarningsigndevelopedforJobosBeachbasedonthe fieldobservationsandnumericalsimulationsdescribedaboveandconversationswithexperiencedlocal surfersandbeachgoers.Itshouldbenotedthatthisdraftiscurrentlyundergoingchangesbasedon recommendationsfrompersonnelfromUPRSeaGrantandfromthemunicipalityofIsabela.The appearanceofthewarningsigntobeinstalledwilllikelybeverydifferentfromthisversion.
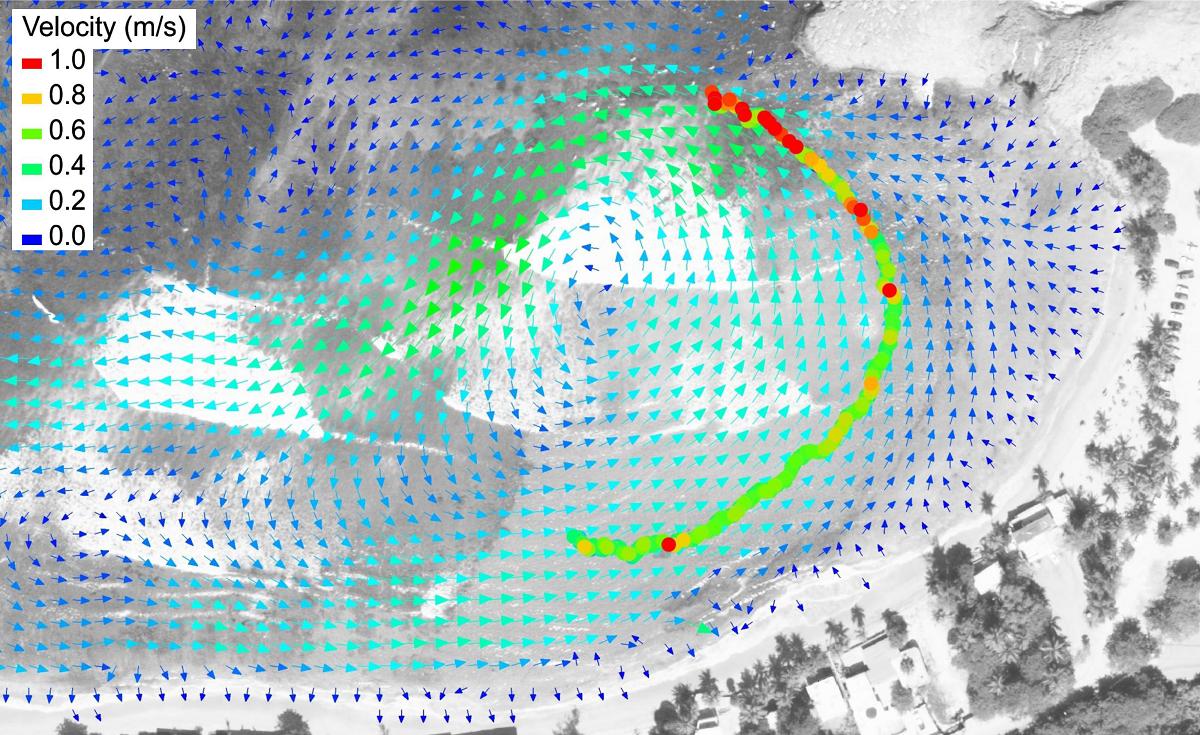
Figure3.13:ComparisonbetweenthecurrentssimulatedbyBOUSS2D(coloredvectors)andthetrajectoryoftheGPStrackeddrifterforthefieldexperimentcarriedoutonFebruary7,2011.
DomesBeachislocatedinthemunicipalityofRinc´ononPuertoRico’snorthwesterncoast.Itisexposed tolargewinterswells,andiswidelyrecognizedasoneofthemostdangerousbeachesforinexperienced swimmers.Figure3.16showsanaerialimageofDomesBeach.Themostdangeroussituationfor beachgoersatthisbeachiswheninexperiencedswimmersgetsweptbythewave-inducedcurrentflowingsouthwardstowardsthecliffattheRinc´onLighthouse.Swimmerswillstarttoswimagainstthe currentinadesperateefforttoswimawayfromtherocksandbacktothesafetyofthesandybeach.In mostcasesthevictimwillbesweptontotherockswherethevictimwilleitherdiefromdrowningorget batteredtryingtoclimbuptherockycliff.ThissituationiseerilysimilartoJobosBeachinwhichatopographicallycontrolledwave-inducedcurrentwithnoresemblancetotheinfamousripcurrentstructure shownontypicalwarningsignswillcarryswimmersoffshore.
SimilarnumericalsimulationsandfieldobservationstothosedescribedforJobosBeachwereconductedforDomesBeachinordertoexaminequalitativelythespatialstructureofthewave-induced currentleadingtosomanydrowningsandaccidentsatthisbeach.Figure3.17showsacomparison betweenthesimulatedwave-inducedcurrentsandthetrajectoryofadrifter.Thespatialstructureofthis
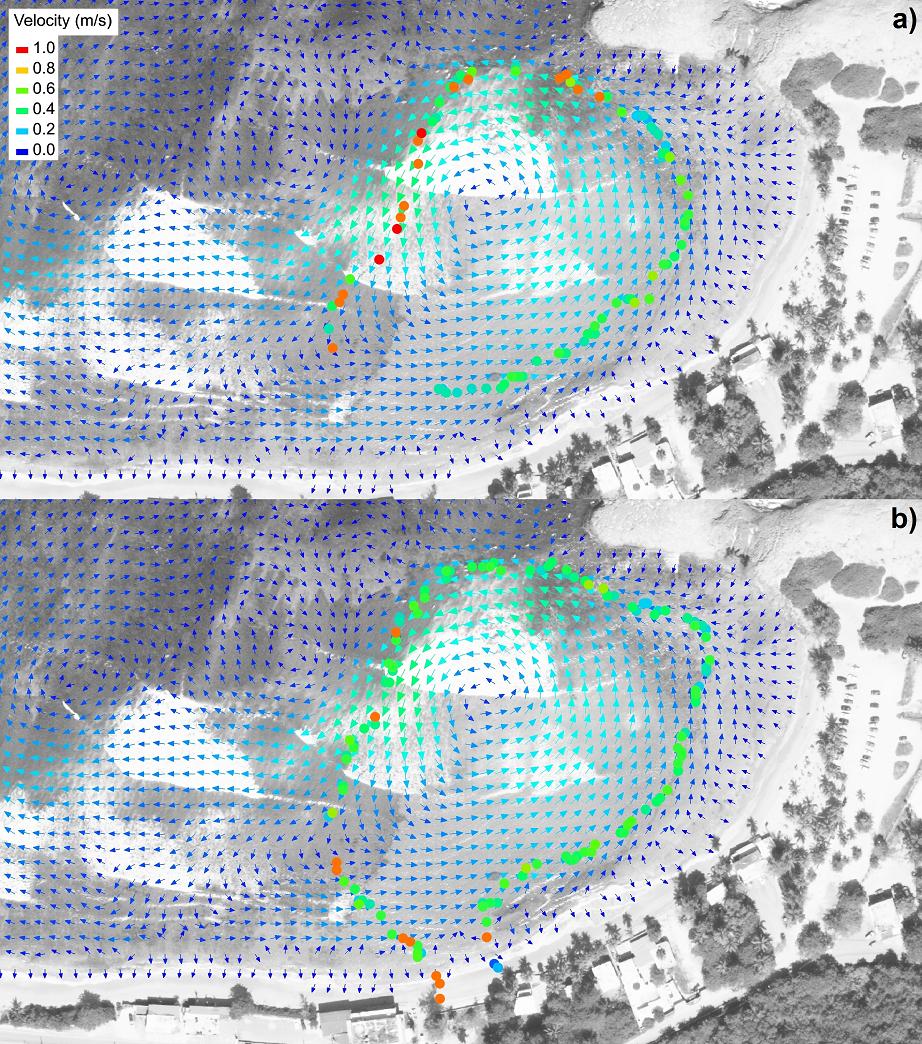
Figure3.14:ComparisonbetweenthecurrentssimulatedbyBOUSS2D(coloredvectors)andthetrajectoriesoftwoGPStrackeddriftersforthefieldexperimentcarriedoutonMay27,2011.
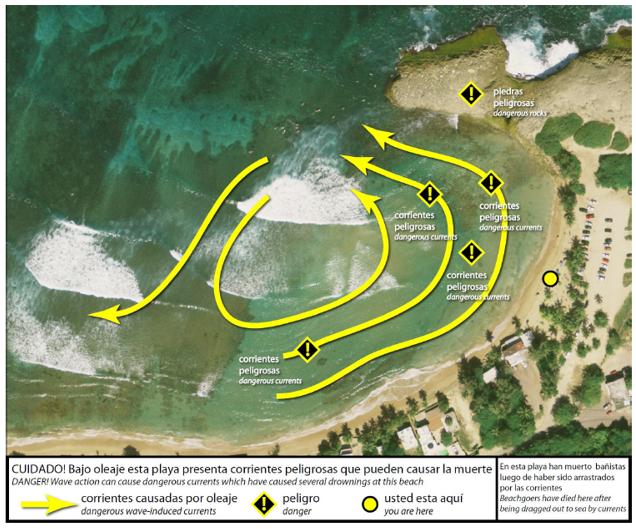
Figure3.15:PreliminarydraftofwarningsigndevelopedforJobosBeachbasedonthefieldobservationsandconversationswithexperiencedlocalsurfersandbeachgoers.Itshouldbenotedthatthisdraft iscurrentlyundergoingchangesbasedonrecommendationsfrompersonnelfromUPRSeaGrantand fromthemunicipalityofIsabela.Theappearanceofthewarningsigntobeinstalledwilllikelybevery differentfromthisversion. alongshorecurrentwascoherentandrepeatableforawiderangeofwinterwaveconditionsandconfirms theexistenceofawave-inducedjetflowingtowardstherockycliffstothesouthofDomesBeach.
Figure3.18showsapreliminarydraftofawarningsigndevelopedforDomesBeachbasedonthe fieldobservationsandnumericalsimulationsdescribedaboveandconversationswithexperiencedlocal surfersandbeachgoers.Itshouldbenotedthatthisdraftiscurrentlyundergoingchangesbasedon recommendationsfrompersonnelfromUPRSeaGrantandfromthemunicipalityofIsabela.The
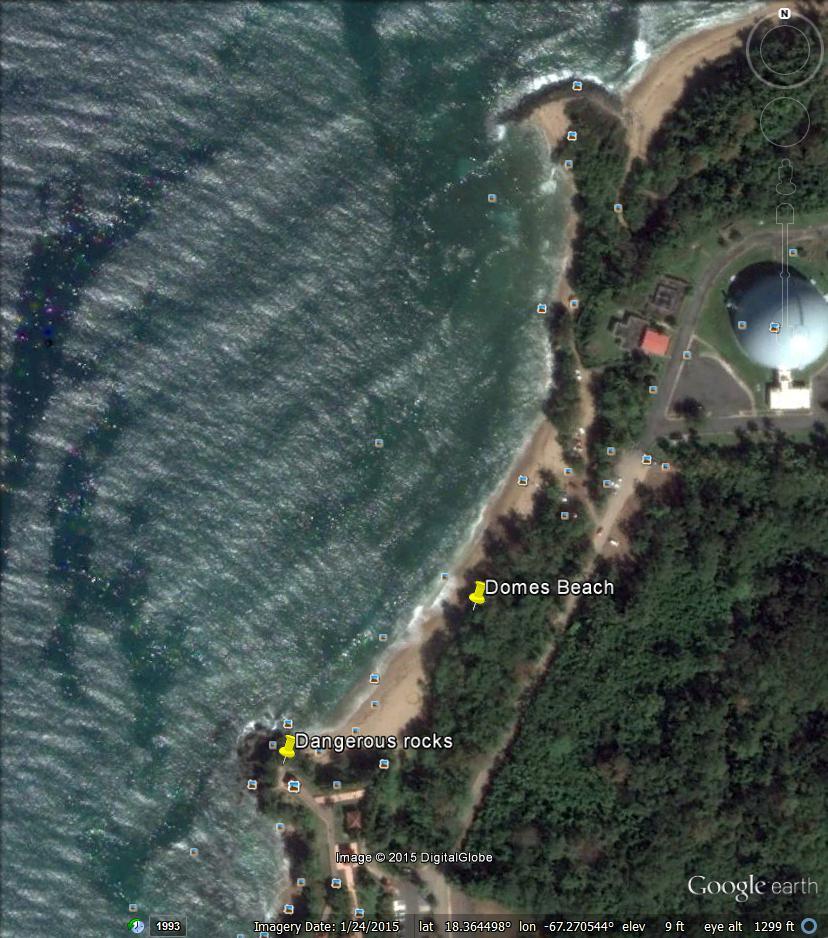
Figure3.16:AerialimageofDomesBeachinRinc´on,PuertoRico. appearanceofthewarningsigntobeinstalledwilllikelybeverydifferentfromthisversion.
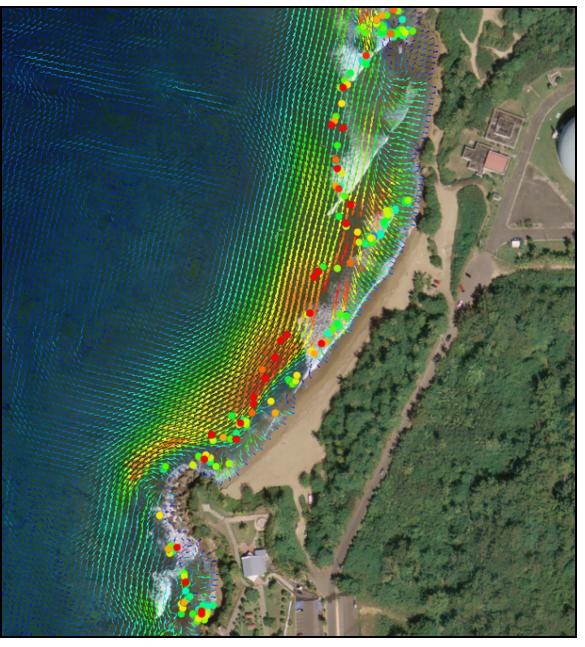
Figure3.17:Comparisonbetweenthesimulatedwave-inducedcurrents(coloredvectors)andthetrajectoryofadrifter(coloreddots)atDomesBeach.
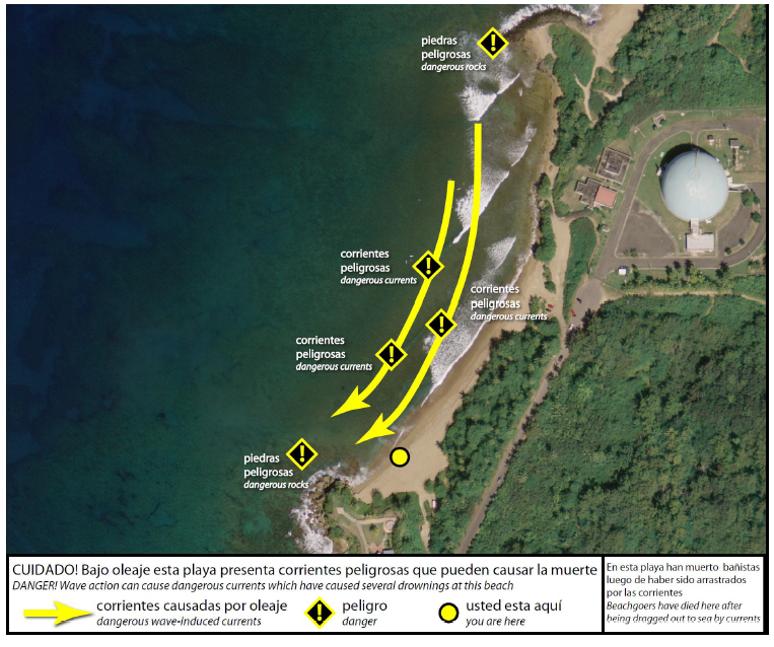
Figure3.18:PreliminarydraftofwarningsigndevelopedforDomesBeachbasedonthefieldobservationsandconversationswithexperiencedlocalsurfersandbeachgoers.Itshouldbenotedthatthisdraft iscurrentlyundergoingchangesbasedonrecommendationsfrompersonnelfromUPRSeaGrantand fromthemunicipalityofRinc´on.Theappearanceofthewarningsigntobeinstalledwilllikelybevery differentfromthisversion.
Ahigh-resolutionoperationalwavemodel,theCariCOOSNearshoreWaveModel,wasdevelopedas partofthepresentproject.Thedetailsofthemodelimplementationandvalidationwerediscussed insection3.1.Insummary,themodelwasabletoadequatelyresolvewavetransformationacrossthe PR/USVIarchipelago.Theperformanceofthemodelforoffshore/coastallocationswasvalidated usingwaveobservationsfromfourCariCOOSbuoys,withverygoodresults.
AfterensuringthatthemodelperformedsatisfactorilyattheCariCOOSbuoylocations,afieldvalidationexperimentwasconductedtoevaluatemodelperformanceinthenearshoreregionandwithinthe surfzone.Afieldexperimentinvolvingbottom-mountedwavesensorswascarriedoutattheTresPalmas MarineReserveinordertoevaluatetheperformanceofoneofthehigh-resolutionnestedgridsat120 meterresolution.Themodelwasshowntobeabletoresolvewavetransformationwithverygoodresults uptojustseawardofthesurfzone.Thisshowsthatthemodelisabletoresolvewavetransformation includingshoaling,diffractionandrefractionatthislocation.Comparisonwithasensorlocatedinside ofthesurfzoneduringlargewaveeventsshowedthattheoperationalmodelwasunabletocorrectly resolvewavedissipationduetobreaking,andoverestimatesthewaveheightatthislocation.Itisthe authors’hypothesisthattheSWANmodeldoesnotaccuratelyreproducethedissipationofmechanical energyduetowavebreakingduetothefactthatSWANassumesaspillingbreakermodel.Inaddition, thehorizontalresolutionof120metersfortheNWPRgridislikelystilltoocoarsetoreproducethe energydissipationoverasurfzonethatis,atmost,200-300meterswideinthecross-shoredirection duringthesespecificevents.Whilebetterresultsinsidethesurfzonecouldhavebeenobtainedwitha higherspatialresolution,theaimofthepresentstudywastodevelopafullyoperationalwavemodel coveringallPR/USVIbeaches.Spatialresolutionhigherthan120meters,atleastfortheNWPRgrid, wasprohibitiveduetocomputationallimitations.However,giventhattheaimofthepresentproject wastobeabletopredictbreakerheightsattheseawardedgeofthesurfzone,andnottheheightsof
individualwaves(orbores)shorewardofthesurfzone(amuchmoreinvolvedtask),theauthorsdeem themodeltobeadequatefordevelopinganearshorebreakerpredictionsystemwhichcanpredictthe maximumbreakerheightstobeexpectedataparticularbeachonagivenday.
Section3.2describedthedevelopmentofasimplemethodtoestimatenearshorebreakerheightsbased ontheoutputoftheCariCOOSNearshoreWaveModelatstrategicallyplacedvirtualbuoys.Each virtualbuoywaslocatedjustoutsidethesurfzoneforeachbeach,sothattheavailablewaveenergyflux justseawardofthesurfzonecouldbeestimatedfromtheSWANdata.Basedonthisavailablewave energyflux,anestimateofthemaximumexpectedbreakerheightswasobtainedusingasemi-empirical formulationforbreakerheightsKomarandGaughan(1972).
Whilearigorousvalidationofbreakerheightsisverydifficultduetothecomplexityofmeasuring breakerheightsinthesurfzone,thebreakerheightpredictionswerecomparedtovisuallyestimated breakerheightsatabeachinRinc´on,PuertoRico.Whiletheresultsofthiscomparisonshouldbetaken withcaution,giventhesubjectivenatureofvisuallyestimatedbreakerheights,theresultssuggestthat ingeneralthebreakermodelcanestimatethearrivalofhighbreakereventsatthisbeach.Following thismethodologyforestimatingtherangeofexpectedbreakerheights,acustomwebpagewascreated inwhichtherangeofexpectedbreakerheightsasafunctionoftimeareprovidedviaanearshore virtualbuoysystem.Themodelisnowoperationalandthereadermayaccesthedailypredictions at http://www.caricoos.org/Nearshore_Breaker_Model/.
ThereadershouldnotethatasthecomputationalcapabilitiesofCariCOOSimprove,theperformance ofthebreakermodeldescribedhereinshouldimproveasnestedgridsareimplementedathigherspatial resolution.Finally,eventhoughthepresentprojecthasconcluded,CariCOOShasadoptedthebreaker modelasapermanentmodelingtoolandiscommittedtomaintainingandimprovingthemodelin perpetuityinsupportofUPRSeaGrant’smissiontobettereducatethepubliconbeachhazardsandthe drowningprobleminPuertoRicoandUSVIbeaches.
Thefinalcomponentoftheprojectfocusedonanalyzingthewave-inducedcirculationpatternsattwo ofPuertoRico’smostdangerousbeachesforbeachgoers:JobosBeachinIsabelaandDomesBeachin Rinc´on.Bothofthesebeachesareresponsibleforseveralfatalitieseachyearandbothexhibitstrongand coherenttopographicallycontrolledcurrentpatternswitharepeatableandrelativelypredictablespatial structureduringsignificantwaveevents.Bothnumericalsimulationsandfieldobservationswereconductedtoelucidatethisspatialstructure.Theintentofthenumericalsimulationswastoconfirmfrom
aqualitativeperspectivetheexistenceofthesecoherentpatternswhichhaveledtoseveraldrowning deathsandwhichhavelongbeensuspectedbylocalsurfersandresidents.Preliminarydrifterdeploymentswereusedtoqualitativelyconfirmthemodelresults.Rigorousvalidationofthevelocityfieldat eachbeachasafunctionofeverypossiblewaveforcingconditionwasoutofthescopeofthepresent project.
Thespatialstructureofthecurrentsatbothbeaches,longsuspectedbysurfersandresidents,were confirmedbythenumericalsimulationsandfieldobservations.Adraftofawarningsignwasprepared foreachbeachbasedtheknowledgeprovidedbylocalsandonthesimulationsandobservationsdescribedinsection3.3.Itshouldbenotedthatthesesignsarecurrentlyundergoingchangesbasedon recommendationsfrompersonnelfromUPRSeaGrantandfrompersonnelfromtheRinc´onandIsabela municipalities.Theappearanceofthewarningsignstobeinstalledwilllikelybeverydifferentfromthe versionspresentedinthisreport.
Themostimportantimpactsoftheoutcomesofthisresearchprojectareasfollows:
• ThisprojectledtothedevelopmentofaveryhighresolutionoperationalwavemodelforPR/USVI. Thisproject,incoordinationwiththeCaribbeanCoastalOceanObservingSystem,helpedachieve animportantmilestone:asofMarch2015,everymeteroninhabitedcoastlineinPR/USVIiscoveredbyahighresolutiongridwithintheoperationalCariCOOSNearshoreWaveModel.Thishas allowedforaccuratepredictionsofthenearshorewaveclimatewhichnotonlyallowsforaccurate predictionofnearshorebreakersforbeachsafetypurposes,buthasalsoprovidedanoperational wavepredictiontoolforusebyboaters,recreationalandcommercialfishermen,harborpilots,etc.
• ThisprojecthasledtoanunprecedentedagreementbetweenNWSandCariCOOS/SeaGrantin whichNWSSanJuanwillusethewavemodelsdevelopedunderthepresentprojecttoemittheir ripcurrentforecastsandwarnings.
• Therehasbeenconstantengagementwithstakeholdersandpotentialusersofthebreakermodel. InJanuary2015,SeaGrantandtheprojectPI’sofferedatrainingworkshoptoemergencymanagementofficialsfromthe44coastalmunicipalitiesonhowtousethenearshorebreakerprediction system.Inaddition,emergencypersonnelwereaskedtoaddbeachestothesystemattheirdiscretion.Asaresultoftheworkshop,17additionalbeacheswereaddedtothebreakerprediction system.
5.1.1Operationaltools
Perhapsthemostimportantproductsresultingfromthepresentprojectarethefollowingoperational tools:
• TheCariCOOSNearshoreWaveModel: http://caricoos.org/drupal/swan
• TheCariCOOS-SeaGrantNearshoreBreakerModel: http://www.caricoos.org/Nearshore_ Breaker_Model/
• Canals,M.,Morell,J.,CorredorJ.,Capella,J.AdvancingtheCaribbeanCoastalOceanObserving System.AGUOceanSciencesMeeting,SaltLakeCity,Utah,February2012.(acknowledgesSea Grantsupport)
• Canals,M.OnthespatialdistributionofthewaveenergyresourceinPuertoRicoandtheUnited StatesVirginIslands.Inpreparationforsubmissiontothe JournalofRenewableEnergy.(acknowledgesSeaGrantsupport)
5.1.3Posterpresentations
• Qui˜nones,E.,Loubriel,M.,Morell,J.andM.Canals.DevelopmentofanearshorebreakerpredictionsystemforPuertoRicoandtheUnitedStatesVirginIslands.Posterpresentedatthe2015 ASLOAquaticSciencesMeeting,Granada,Spain.
• Quinones,E.andM.Canals.DevelopmentofthePuertoRicobeachandsurfzonecurrentswarningsystem.Posterpresentedatthe2014AGUOceanSciencesMeeting,Honolulu,Hawaii.
5.1.4Otherpresentations
Inadditiontotheabove,thebreakerpredictionsystemhasbeenpresentedtoagencies,usersandstakeholdersdozensoftimes.Themostimportantrecentpresentationsoftheproductofthisprojectsareas follows:
• OnMarch2014,theCariCOOS-SeaGrantNearshoreBreakerModelwasunveiledtothepublic attheCariCOOSGeneralAssembly.
• InApril2014,PICanalsgaveademonstrationofthesystemtotheDNERbeachmanagement board JuntadePlayas.
• OnOctober282014,PICanalspresentedthenearshorebreakerpredictionsystemtotheSecurity CommitteeofthePuertoRicoHotelandTourismAssociation.
• OnMarch26,2015,PICanalspresentedtheprojectoutcomestoofficialsandmayorsfromthe 44coastalmunicipalitiesinPuertoRicothefirstannual EncuentrodeMunicipiosCosteros,sponsoredbyPR-DNER.
• Inaddition,PICanalsandCo-PIMorellhavemetseveraltimeswiththeNWStocoordinatea formalcollaborationinwhichNWSSanJuanwillusethedatafromtheCariCOOSNearshore BreakerModeltoemittheirofficialripcurrentwarninglevelsfor16beachesinPRandtheUSVI.
Basedontheresultsofthepresentproject,therecommendationscanbedividedinthefollowingareas: modelvalidation,usageofthebreakermodel,andsignageatdangerousbeaches.
• TheCariCOOSNearshoreWaveModelwasvalidatedextensivelythroughoutthedevelopment period.However,furthervalidationshouldbeconductedasnestedgridsareimplementedatan evenhigherspatialresolutionascomputationalcapabilitiesallow.
• Oneofthemainfactorsthatcouldimprovemodelperformanceforbothwavestatisticsandbreaker heightsistheimplementationofbetterwindmodelsforPR/USVI.WhiletheNDFDwinddatabase usedtoforcethewavemodeldescribedinthisreportdoesagoodjobinpredictinglocalwind effects,localseabreezeandtopographiceffectsbecomeveryimportantinthewaveclimateof somebeaches,andahigherresolutionwindmodelwouldverylikelyimprovethewavemodel performance.CariCOOSisalreadyimplementinga1kmresolutionWRFwindmodelwhich shouldhelpinthiseffort.
• Furthervalidationofthebreakerheightpredictionsshouldbeconductedusingmorerigorous methodsofbreakerheightestimationsuchasvideoimageryorbydeployingmoresensorsacross thesurfzone,especiallyinbeacheswhicharelocatedinshoreoffringingorbarrierreefformations suchasthebeachesinIslaVerdeinCarolinaandtheCondadoareainSanJuan.
• InJanuary2015thePI’sconductedatrainingworkshopforemergencymanagementpersonnel inordertoallowthemtobetterunderstandandusethebreakerpredictionsystem.Additional activitiesofthistypeshouldbeconductedwithotherstakeholdergroupssuchaslifeguards,who inturncouldprovidefeedbacktothePI’sonhowtoimprovethemodelorwhetherthebreaker modelisoverestimatingorunderestimatingbreakerheightsataspecificbeach.
• Whilethebreakermodelisausefultool,itisnottheonlytoolthatshouldbeusedinorderto makeinformeddecisionsregardingbeachsafety.TheNationalWeatherServiceSanJuanOffice recentlyreleasedtheirripcurrentwarningsystemfor12beachesinPR/USVI.TheNWSwarning systemusesthebreakerheightestimatesprovidedbytheCariCOOSSeaGrantNearshoreBreaker Modelandcombinesthemwithwinddataandothervariablestoemitaripcurrenthazardlevel.
• Thewebpagedevelopedforthepresentprojectcouldserveasthebasisforabeachsafetysmart phoneappforPuertoRicoandtheUSVI.
• ThepreliminarywarningsignsdevelopedforthepresentprojectforJobosBeachandDomes Beachdonotsuggestawaytoescapefromthecurrent,asopposedtothetypicalripcurrentwarningsignsdisplayedatseveralbeachesaroundPuertoRico.Beforedevelopmentofafinalversion ofthecustomwarningsigns,expertsinaquaticsafetyshouldbeconsultedtodecidewhether anescaperouteshouldbesuggestedorwhetherswimmingshouldbediscouragedcompletelyat thesebeaches.
• Whilethecirculationpatternsshowninthewarningsignswereshowntoberepeatableunder typicalwaveconditions,thecirculationpatternscouldvarysignificantlyinthecaseofwaveevents withatypicalwavedirections,suchasaswellcomingfromthesouthwestforDomesBeach.Inthe caseofnowaveforcingthecirculationpatternswouldbedominatedbythewindorthetideand willlikelyvarysignificantlyfromthesuggestedpatterns.Asaresult,thewarningsignsshould statethefactthatthedirectionofthecurrentsshownonthewarningsignareonlyvalidunder certainconditionsandareshownonlyinordertoalterbeachgoersofpotentialdangers.Inany case,legalexpertsshouldbeconsultedbeforefinalinstallationofanywarningsign.
Anselmi,C.,Canals,M.,Morell,J.,Gonzalez,J.,Capella,J.,andMercado,A.(2012).Developmentof anoperationalnearshorewaveforecastsystemforPuertoRicoandtheU.S.VirginIslands. Journal ofCoastalResearch,28(5):1049–1056.
Booij,N.,Ris,R.C.,andHolthuijsen,L.(1999).Athirdgenerationwavemodelforcoastalregions. Part1:Modeldescriptionandvalidation. JournalofGeophysicalResearch,C4(104):7649–7666.
Caldwell,P.C.andAucan,J.P.(2007).Anempiricalmethodforestimatingsurfheightsfromdeep watersignificantwaveheightsandpeakperiodsincoastalzoneswithnarrowshelves,steepbottom slopesandhighrefraction. JournalofCoastalResearch,23:1237–1244.
Canals,M.,Morell,J.,Corredor,J.,andLeonardi,S.(2012).ExpandingtheCaribbeanCoastalOcean ObservingSystemintothenearshoreregion.In Oceans,2012,pages1–4.
Chawla,A.,Tolman,H.L.,Gerald,V.,Spindler,D.,Spindler,T.,Alves,J.-H.G.M.,Cao,D.,Hanson,J.L.,andDevaliere,E.-M.(2013).Amultigridwaveforecastingmodel:Anewparadigmin operationalwaveforecasting. WeatherandForecasting,28:10571078.
Komar,P.D.andGaughan,M.K.(1972).Airywavetheoryandbreakerheightprediction.In Proceedingsfromthe13thConferenceofCoastalEngineering,Vancouver,BritishColumbia,Canada.
LeRoux,J.P.(2007).Asimplemethodtodeterminebreakerheightanddepthfordifferentdeepwater waveheight/lengthratiosandseafloorslopes. CoastalEngineering,54:271–277.
MacMahan,J.,Brown,J.,andThornton,E.(2009).Low-costhandheldglobalpositioningsystemfor measuringsurf-zonecurrents. JournalofCoastalResearch,25:744–754.
Nwogu,O.G.andDemirbilek,Z.(2001).BOUSS-2D:ABoussinesqwavemodelforcoastalregions andharbors.TechnicalReportERDC/CHLTR-01-25,U.S.ArmyEngineerResearchandDevelopmentCenter,Vicksburg,MS.
Peregrine,D.H.(1983).Breakingwavesonbeaches. AnnualReviewofFluidMechanics,15(1):149–178.
Taylor,L.A.,Eakins,B.W.,Warnken,R.R.,Carignan,K.S.,Sharman,G.F.,andSloss,P.W.(2006). DigitalelevationmodelsforSanJuanandMayag¨uez,PuertoRico:Procedures,datasourcesand analysis.Technicalreport,NOAANationalGeophysicalDataCenter,Boulder,CO.
TheSWANTeam(2012).SWANusermanual.Technicalreport,DelftUniversityofTechnology.