DecipheringPhosphorescentBay:NewApproachestowardstheUnderstanding of this Unique Ecosystem
April 15, 2015
Puerto Rico Sea Grant Award/Project number: R–101–1–12
Time Period: February 1, 2012 – January 31, 2015
PI - Brenda M. Soler Figueroa, PhD Candidate
Department of Marine Science, University of Puerto Rico, Mayagüez
Co-PI - Ernesto Otero Morales, PhD Professor
Department of Marine Science, University of Puerto Rico, Mayagüez
Collaborator - Juan O. Gonzalez-Lopez, PhD Candidate
Department of Civil and Environmental Engineering and Earth Sciences, University of Notre Dame, Indiana
EXECUTIVE SUMMARY
Summary of impacts and contributions
Objectives - The aim of this study was to identify the links between the environmental and meteorological conditions and the patterns of variability of Pyrodinium bahamense and Ceratium furca and the bioluminescence levels (BL) at Bahía Fosforescente (BF; Phosphorescent Bay)
Objective 1 – Determine the daily, spatial and seasonal variability of P. bahamense and C. furca. This objective was achieved. Results indicated that seasons alone accounted for about 48% of the total variation in the dinoflagellate composition, while daily and spatial variation only accounted for ca. 10% of the total variation. Pyrodinium bahamense was the numerically dominant dinoflagellate during the wet season and a shift towards the dominance of C. furca were found during the dry season. Objective 2 - Identify the environmental factors that may drive the fluctuations of species. This objective has been meet. A multivariate analysis showed that seasonal differences in dinoflagellates composition were better explained by salinity, dissolved organic matter fluorescence, pH and silicates, environmental variables that are significantly influenced by different precipitation extremes. Thus, results indicate that the alternations in the abundance of P. bahamense and C. furca are intimately linked to seasons, the local weather and the resulting changes in the environmental conditions. Objective 3 - Examine the response of P. bahamense and C. furca to different nutrient enrichments. This objective was waived and changed to – a) Determine the actual bioluminescence levels (BL) at BF and evaluate the putative declining bioluminescence trend and b) Identify the role of different environmental conditions on BL. The seasonal trend in the dinoflagellate composition, described in Objective 1, was also reflected in the bioluminescence. High levels characterized the wet season and strongly correlated with the high cell densities of P. bahamense. During the dry season, dramatic decreases in P. bahamense populations resulted in simultaneous reductions in BL. This suggests that environmental changes exerted by different meteorological conditions are linked to variations in BL by a modulation in dinoflagellate composition. Objective 4 - Investigate the influence of the water circulation pattern in relation with the spatial and temporal distribution of the organisms. A detailed measurement of the water levels, currents and bottom temperature was conducted during November 2012 and March 2013. The analysis showed a predominantly two-layer circulation with currents coupled with both the daily temperature cycle and the winds. In particular the dominant periods of the
currents at the entrance of the bay agreed with the observed dominant periods of the bottom temperature as well as the winds. These observed dominant periods were 12 hours and 24 hours. A comparison with the periodicity of the observed water levels indicates that the currents in the bay are not tidally dominated, with no tidal periods being present in the current periods observed. Bottom temperature records also showed that the bottom temperature in the inside of the bay is modulated by the temperature of the water flowing into the bay through the entrance channel. Calculations of the water volume inflow and outflow in the bay showed both daily and seasonal variability with a flushing period of about 20 days during November 2012 and about 8 days during March 2013.
Advancement of the Field - The high frequency in situ monitoring approach employed in this study, encompassing days, weeks and seasons, allowed for a detailed examination of the environmental factors associated to the fluctuations in the dinoflagellates composition and served to re-evaluate the presumed declining trend in BL. Results from this study provide substantial evidence to supportthat weather andthe resultant environmentalconditions aretheprincipal factor controlling the alternating abundances of P. bahamense and C. furca. This represents a scientific advance in understanding the population dynamics of two potentially harmful dinoflagellates and show the importance of high-frequency monitoring to understand better the role of environmental forcing on the populations of these fast fluctuating organisms. Furthermore, this study provided the first evidence to support that BL at BF are not decreasing and the bay maintain conditions favorable for the accumulation of abundant bioluminescent dinoflagellate populations. The hydrodynamic and meteorological observations allowed for a detailed study of how the currents in the bay are related to the water levels, water temperature and wind forcing. The analysis showed that currents in the bay are not directly coupled to the tidal regime, but that they are coupled to the daily heating and cooling cycle as well as the wind cycle. This temperature-wind coupling was observed during both November and March field experiments, even though the observed water temperature regimes during both deployments were very different. A two layer circulation system was also observed, with currents predominantly flowing into the bay through the top water layer around 6AM when water temperature dropped, and outflow through the bottom layer around 6PM when water temperatures increased. A daily and seasonal variability in the water volume inflow and outflow was observed, with a flushing period of about 20 days during November 2012 and of about 8 days during March 2013. This further shows the importance of high frequency monitoring to capture hydrodynamic features that might otherwise be lost.
Problems encountered – The major problem encountered during this study was the calibration of the FlowCAM. The application of this instrument demanded intensive examination of samples, training and method development that required a significant period of time to establish protocols that enable for the automatic count of the species of interests in a quantitative fashion. However, after a long period of training and development of proper techniques, all samples related to the project were analyzed using this novel instrumentation. The use of the CTD to establish the stratification of the water column posed problems due to the marked differences in the depths of the bay at the sampling stations as well as the shallowness of the bay. Initially three ADCPs were proposed to be used and due to unavailability from Nortek it was decided to use two, one at the entrance channel and the second one on the back of the bay. In this way measurements of currents, water levels and bottom temperature were obtained in a way that would allow the estimation of the hydrodynamics of the bay as water circulates into and through it.
Research Impacts – The bioluminescent measurements conducted at BF are of great scientific importance, these represent the first quantified BL since 1971 that allows comparisons of the state of this bay with others in the world. The methods employed during this study were used to determine the dinoflagellates abundance and bioluminescence status of Puerto Mosquito, Vieques during the “blackout” and recovery of the bay Two technical reports were prepared and shared with Department of Natural and Environmental Resources of Puerto Rico, Puerto Rico Environmental Quality Board, The Vieques Conservation and Historical Trust, and Fish and Wildlife Service.
Other important impacts or products
Students supported – a) Brenda M. Soler Figueroa: anabakaena@gmail.com; PhD candidate; PI of this work and it represented her dissertation; Amount paid Sea Grant: $2,000/month (except in summer:June– July 2012/2013 $2,900/month).Total: 135weeks; 5,400hours.Timeperiod: April 2012 – October 2013, January – December 2014. Also $572 of university inscription was paid on August 2012. Amount paid during the current period: $3,287.0 (15 weeks; 600 hours). Amount paid EcoEléctrica, LP: $2,000/month (total: 8 weeks; 320 hours). Time period: November and December 2013; b) Héctor M. Martinez Rivera: hector.martinez7@upr.edu; MS Student; he helps with the samplings preparation, samplings and laboratory work; Amount paid Sea Grant: $1,000/month (total: 13 weeks; 260 hours). Time period: February – April 2013. Héctor was also supported by a student scholarship provided by EcoEléctrica, LP
Thesis and Dissertations – Deciphering Bahía Fosforescente: New Approaches towards the Understanding of this Unique Ecosystem (Dissertation of the PI; to be presented on May 11).
Presentations - Bioluminescence levels at Bahía Fosforescente: Myth vs Reality - presented at the 36th Association of Marine Laboratories of the Caribbean scientific meeting held in Ocho Rios, Jamaica (June 17 – 21, 2013). Also, at 5th Sea Grant Symposium at Mayaguez (February 20, 2013) and at “Segundo Congreso de Áreas Naturales Protegidas” at San Juan (August 28, 2014).
Articles – a) Soler-Figueroa, B.M. and E. Otero. 2015. The influence of rain regimes and nutrient loading on the abundance of two dinoflagellate species in a Tropical Bioluminescent Bay, Bahía Fosforescente, La Parguera, Puerto Rico. Estuaries and Coasts 38:84-92 (Published online: 12 May 2014); b) Soler-Figueroa, B.M. and E. Otero. Seasonal changes in bioluminescence levels and dinoflagellates composition in a tropical bioluminescent bay, Bahía Fosforescente, La Parguera, Puerto Rico (Submitted to Journal of Experimental Marine Biology and Ecology).
Matching funds – The bathyphotometer (UBAT) and flow cytometer (FlowCAM) used in this study were made available thanks to a donation from EcoEléctrica, L.P. Outreach Program. Ecoeléctrica, L.P. also provided student scholarships. Total amount: ca. $150,000.
Time and effort attributed to PI’s, Co-PI’s and associates – a) PI: see the Student supported section; b) Co-PI: Otero donated 30% of his regular appointment ($22,000) each year of the study. No salaries were requested from the Sea Grant program; c) Collaborator: Juan Gonzalez-Lopez dedicated 120 hours and amount paid $12,000 for experimental design of the ADCP deployment, data analysis, and programming. Two partial reports were delivered to Dr. Ernesto Otero and four conference calls with Dr. Ernesto Otero and Brenda Soler were held.
Benefits - A presentation on BioBays (“Fitoplancton, Bioluminiscencia y Bahías Bioluminiscentes”) was prepared and given to students (school/undergraduate/graduate), teachers, community leaders, private and local agencies, NGO’s, and tourist service providers. A technical report about Bioluminescent Bays and Climate Change was prepared for the Puerto Rico Climate Change Council. Also, we wrote the section in the Ecotourism Guide of PR Tourism Company
about the regulations protecting BioBays. The methods and findings of this study were also shared in an interviewed with the Travel Channel and are going to be presented in their America’s Greatest Outdoors program.
BACKGROUND AND PROJECT RELEVANCE
Near coastal marine ecosystems are under continuous pressure and experience alterations due to complex interactions between natural processes, human activities and climate change. Therefore, there is an urgent need to understand better how such pressures modify the normal function of these ecosystems to establish effective management strategies. The Bioluminescent Bays (BB), rare worldwide ecosystems, are an example of especially sensitive coastal systems for which thefactors associatedto theirdynamicnaturearepoorlyunderstood. Adetailedexamination of biological and environmental factors defining these systems should be a priority to local agencies and managers in order to safeguard the ecosystem services of these BB, such as habitat for protected species (i.e. dolphins and manatees) nursery for economically important species, tourism and recreation.
In Puerto Rico (PR), BB have intrigued and puzzled researchers for decades. These bays are characterized by the presence of high concentrations of the bioluminescent dinoflagellate Pyrodinium bahamense var. bahamense (Margalef, 1957) that experience temporal and spatial fluctuations due probably to a combination of physical, chemical and biological factors (Seixas, 1988; Walker, 1997; Soler-Figueroa, 2006). How these factors interact is not yet defined. Preliminary studies (Soler and Otero, 2011) suggest that low temporal resolution estimates of cell densities and nutrients should be interpreted carefully as daily changes encompass similar results (Figure 1), demonstrating the limitation of past low temporal resolution studies to identify the exact pattern of temporal fluctuations and underscoring the importance of increasing efforts to address short term observations to examine BB dynamics.
Figure 1. Cell densities of P. bahamense and C. furca at Bahía Fosforescente. During 2003 P. bahamense averaged 50,250 cells L-1 (left) (Soler-Figueroa, 2006) and during 5 consecutive days in March and November 2010, averaged 8,684 cells L-1 (center) and 81,656 cells L-1 (right), respectively (Soler and Otero, 2011). Multiple comparison ANOVA (SNK) found no significant differences (P=95%) among periods. The vertical arrow indicates values up to 300 and 900 thousand cells L-1 for P. bahamense and C. furca during Mar 2003.
Similarly, although environmental parameters have been recognized as significant determinants of the abundance and distribution of these dinoflagellate species (Burkholder and Burkholder, 1958; Gold, 1965; Seliger et al., 1971; San Juan and González, 2000) limited studies are available at BB that takes a closer look to the relationship of the dynamic variation of these organisms with fluctuations of environmental conditions at a wide range of timescales encompassing days through months.
In recent years, special concerns has arisen in the scientific community, federal (i.e., Fish and Wildlife Services and Sea Grant), state (i.e. Department of Environmental and Natural Resources of Puerto Rico) and private organizations (i.e., Conservation Trust of Puerto Rico), and thegeneral public,related to thedecreases in theobservedbioluminescenceat BahíaFosforescente (BF), La Parguera, a well-known tourist attraction on southwestern PR. Additionally, it was erroneously published that the entrance of the bay was widened and as a result the bioluminescent dinoflagellates disappeared from this bay (Dybas 2011). However, such decreases in bioluminescence are related to fluctuations in dinoflagellate abundances and, on some occasions, Ceratium furca var. hircus which is not bioluminescent (Sweeney 1981; Valiadi et al. 2014), comes to dominate the phytoplankton community (Seixas 1988; Walker 1997; Soler-Figueroa 2006). Theseshifts in thedinoflagellatespeciesdominancecould beconsideredanindexofchange of coastal ecosystem health triggered by increased boat traffic and associated pollution, and changes in watershed management trends and nutrient regimes. Yet, no systematic monitoring programs have been conducted in this bay to decipher the underlying mechanisms driving the fluctuations in the abundance of P. bahamense and C. furca and the presumed drop in bioluminescence has never been quantified.
Even though water current pattern is a vital variable modulating the high concentrations of P. bahamense (Margalef, 1961; Seliger et al., 1970), detailed knowledge of such patterns are scarcelyunderstoodinBF.Thepresentlyacceptedparadigmstatesthatacombinationofprevailing winds and evaporation creates conditions favorable for the concentration of bioluminescent dinoflagellates within the bay. It is suggested that less dense water, driven by the prevailing southeasterly winds, enters the bay as a surface current; the high evapo-transpiration rates make the water saltier and denser, and as result a bottom water current flows out of the bay (Margalef, 1961). This, in conjunction with the shallower and narrower entrance of the bay, creates low water mixing rates with the exterior waters and as result high concentration of positive phototactic dinoflagellates can be maintained within the bay´s boundaries. However, this paradigm does not consider the processes related to the local water’s vertical structure such as the vertical velocity profile (magnitude and direction), which is related to the stratification of the water column and the mixing caused by wind and tidal forcing. Recent observations underscore the need for more detailed water current measurements in this system as the distribution of P. bahamense and C. furca were contrary to thosepredictedby theprevailing winds (Soler andOtero,2011). This brings attention to the complexities of the water transport in the bay in which the combination of stratification, mixing and vertical velocity profile have to be taken into account. Both numerical (Koseff, 1993) and field (Pannard,2008) experiments show the importance of the water column stratification and mixing on phytoplankton abundances, so a combination of observations of the water vertical velocity profile along with temperature, salinity and winds are necessary to describe and quantify all the physical parameters which affect and indicate water transport, stratification and mixing.
Considering the importance of this bay for tourism, fisheries, endangered species, as natural laboratories and recreational and educational activities; and given the present and future
climate-related changes as well as the constantly anthropogenic pressure that have been experienced through the years, it is essential to get a better understanding of the processes that controls the dinoflagellate populations in the bay, with special emphasis on the bioluminescent dinoflagellate (P. bahamense). Efforts described herein seek to study issues for which lack of information were underscored by the academic sector in PR including monitoring of the dinoflagellate dynamics in bioluminescence bays and of watershed processes and weather patterns to provide watershed/coastal management support (PR SeaGrant, 2011; http://seagrantpr.org/caribbean/sessions/academia-focus-on-conservation). The central issue of this study is to explore what defines the variability of dinoflagellate species at BF. Important scientific questions that need to be addressed include: 1) How do P. bahamense and C. furca populations fluctuates over time scales of days, weeks and seasons? 2) What and how environmental and meteorological conditions regulate the presence and abundances of P. bahamense and C. furca? 3) What are the actual BL and how these levels are modified by different environmental conditions? 4) What is the three dimensional circulation pattern in the bay and how its associated physical processes affect and determine the spatio-temporal distribution of the species? In order to address these questions and the paucity of information available on the dinoflagellates and bioluminescence dynamics at BF the objectives of this study were:
Objective 1: Determine the daily, spatial and seasonal variability of P. bahamense and C. furca at BF.
Objective 2: Identify the environmental factors that may drive the spatial and temporal (shortterm and seasonal) fluctuations of these species.
Objective 3: Determine the actual BL at BF and evaluate the putative declining bioluminescence trend.
Objective 4: Identify the role of different environmental conditions on the bioluminescence levels at BF
Objective 5: Investigate the influence of the water circulation pattern in relation with the spatial and temporal distribution of the organisms.
METHODS
Objective 1 and 2: Determine the daily, spatial and seasonal variability of P. bahamense and C. furca and identify the environmental factors that may drive the spatial and temporal fluctuations of species at BF.
Field Work
Six stations (Figure 2) were sampled between 8:00 and 9:30 AM during 31 consecutive days, based on local climatology (Glynn 1973), during the wet (5 November – 5 December, 2012) and dry (1 – 31 March, 2013) seasons. Triplicate water samples were collected 0.1 m below the surfaceat each stationusing 9Lcarboys.The retentivefrom aportion ofthe sample(7.7L) filtered through a 25 µm mesh was suspended to 50 mL and fixed with buffered formaldehyde (ca. 1% final concentration).
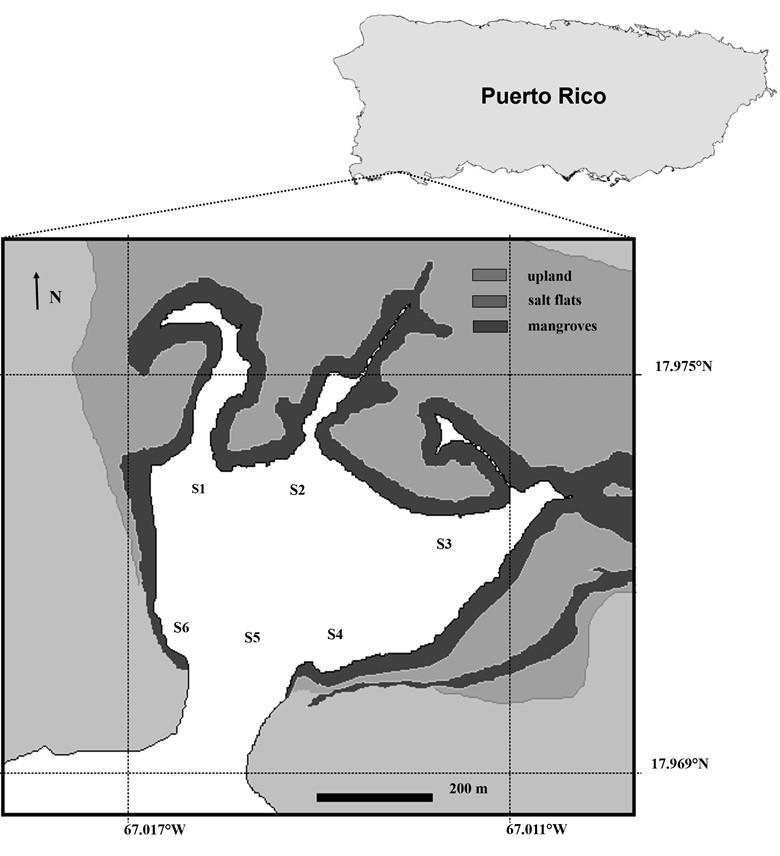
Figure 2. Sampling stations at Bahía Fosforescente, La Parguera, PR (Source: SolerFigueroa and Otero 2015).
Duplicate water samples were collected at each station for nutrient and dissolved organic matter fluorescence (DOMFl) analysis in 500 ml acid-washed polyethylene bottles, and in 30 ml pre-washed and muffled (450 °C for 4 hours) dark glass bottles, respectively. Duplicate surface water samples were collected in 50 ml centrifuge tubes for pH determinations. Samples for nutrients and DOMFl analysis were kept at 5 °C until arrival to the laboratory. The DOMFl, ammonium, and pH (Oakton pH meter) determinations were conducted immediately upon the arrival to the laboratory (1-2 hours after collection). Water samples for other nutrient determinations (i.e. phosphates, nitrites+nitrates and silicates) were frozen (-80 °C) until the analysis.
Water temperature (°C), salinity, and dissolved oxygen (DO, mg L-1) were measured at each station with a Pro Plus YSI probe. The instrument was calibrated prior to each sampling day using certified conductivity standards (i.e. for the salinity measurements) and following the instruction manual (i.e. for the DO measurements). Chlorophyll a (Chla) and turbidity were estimated at eachstation with aSCUFA IIin vivo Chlafluorometer/turbidimeter(TurnerDesigns), based on Otero (2009). Turbidity and Chla are expressed as NTU and µg L-1, respectively.
Laboratory work
Determination of Pyrodinium bahamense and Ceratium furca cell densities
A benchtop Flow Cytometer And Microscope (FlowCAM - FlowImaging; Sieracki et al. 1998) was used to determine the cell densities of P. bahamense and C. furca. Sample volumes were adjusted prior to the analyses to avoid cell clustering and water samples were filtered through
210 µm mesh to remove meso/macro zooplankton to avoid flow cell clogging. Samples were pumped through a 200 µm glass flow cell at a flow rate of 1.5 mL min-1 and viewed with a 4x objective. Dinoflagellate cells were analyzed in autoimage mode with an image recognition software (VisualSpreadsheet© Particle Analysis Software) and using a cell diameter threshold of 15-500 µm to improve the accuracy of counting. The cell flow was rinsed with distilled water between each sample analysis to avoid cross-contamination. Pyrodinium bahamense and C. furca cell densities were automatically classified and counted with biometrics filters previously created based on particle properties. Each automated classification was later screened and corrected for misclassifications.
To examine the accuracy of the FlowCAM classifications several samples were manually counted using a Sedgewick-Rafter counting chamber on a CK40 inverted microscope (Olympus, Inc.) and at 100× total magnification. In average, the FlowCAM results accounted for more than 90%of P. bahamense and C. furcamanual estimates. Averages and standarderrorsofcell densities were calculated from triplicate samples and are reported as cells L-1 .
Nutrients and DOMFl analysis
Phosphates (PO4 3-), nitrites+nitrates (N+N), and silicates (SiO2) concentrations were analyzed using the methodology of Parsons et al. (1984) with a UV-1601 double-beam spectrophotometer (Shimadzu). Ammonium (NH4 +) concentrations were conducted using a Trilogy benchtop fluorometer (Turner Designs) based on the methods of Holmes et al. (1999). Standard samples were run for each nutrient during the day of analysis and concentrations are expressed as µmol L-1 .
The DOMFl was measured using a Trilogy benchtop fluorometer (Turner Designs) fitted with an UV fluorescence cube (ex:em: 365:430 nm) as in Otero (2009) and based on Amador et al. (1990). Once at room temperature and filtered through pre-combusted GF/F filters, the fluorescence levels were measured in 2 ml pre-combusted glass vials. Calibrations were based on quinine sulfate (QS) standards prepared in 0.1 N sulfuric acid. Results are reported in ng QS ml-1 , which is proportional to the concentration of material derived from terrestrial sources, in this case run-off and mangrove systems, and the decomposition of detritus.
Meteorological Conditions
Tomakeadetailedconnectionbetweentheclimatologicalconditionsandthedinoflagellate abundances, a HOBO Micro Weather Station equipped with rain and wind (speed and direction) sensors was installed in the watershed immediately north of the bay. The logger was set to record data every minute and the data were retrieved once a week. Precipitation and wind records from a meteorological station (Davis Vantage Pro 2) located 3.2 km west of the sampling site and maintained by the Department of Marine Sciences Bio-optical Oceanography Laboratory at Magueyes Island (http://bio-optics.uprm.edu/weather.html) was also used to make comparisons and fill data gaps due to technical problems with the HOBO station. Results are expressed as the average of both stations since data were similar.
Data Analysis
To explore and visualize the multivariate patterns of spatial and temporal variability in the dinoflagellate composition (i.e. P. bahamense and C. furca) a Principal Coordinates Analysis (PCO) was performed. Vectors with the dinoflagellates cell densities were overlaid to identify better what drives the observed patterns of variability in the dinoflagellate composition. A PERmutational Multivariate ANalysis Of VAriance (PERMANOVA; Anderson 2001) was used
to confirm statistically significant differences in dinoflagellate composition and estimate components of variations between seasons (fixed factor), among stations (fixedfactor), and among days within each season (days nested in seasons and as random factors), and to test additionally for possible interactions between days and stations within each season. The PCO and PERMANOVA analyses were based on Bray-Curtis resemblance matrixes with the dinoflagellate cell densities log (x +1) transformed to reduce the influence of highly abundant or rare species. Since PERMANOVA analysis showed that seasons alone accounted for 48% of the total variation in the dinoflagellate composition, a SIMilarity PERcentage Analysis (SIMPER; Clarke and Warwick 2001) was further performed to evaluate the dinoflagellate species that strongly contributed to the seasonal variability.
To explore which of the environmental factors (i.e. temperature, salinity, DOMFl, DO, pH, PO4 3-, N+N, SiO2, and NH4 +) are linked to the seasonal variation in the dinoflagellate composition a distance based redundancy analysis (dbRDA) was performed (McArdle and Anderson 2001), with the environmental factors overlaid according to their Spearman rank correlation with each axis. The analysis was based on the Bray-Curtis resemblance matrix of dinoflagellate cell densities and with the environmental variables used as predictors. Prior to the analysis the environmental data were log (x+1) transformed to reduce skewness and normalized to account for the differences in measurement units.
All statistical analyses were performed using PRIMER-e and PERMANOVA add-on software (Anderson et al. 2008).
Objective 3: Determine the actual BL at BF, evaluate the putative declining bioluminescence trend, and identify the role of different environmental conditions on the BL.
Field work
Sampling was conducted during two sampling campaigns, from August 29 to December 11, 2012, and from March 5 to July 19, 2013. The wet (Aug – Nov 2012) and dry (Jan – the first two weeks of April 2013) seasons fell within these sampling days and were characterized based on local climatology (Glynn, 1973). Sampling was conducted mostly twice a week, depending on weather conditions. An Underwater Bioluminescence Assessment Tool (UBAT – WETLabs) (Orrico et al., 2010) was used in situ to quantify the mechanically stimulated bioluminescence levels (BL; photons s-1 L-1). Bioluminescence levels were recorded at a depth of ca. 0.2 m for 3 minutes at each of the six stations (Figure 1). Sampling was always conducted from 7:30 PM to 9:00 PM to minimize the effects due to the diel cycle of the bioluminescent organisms. No BL were recorded from 18 April-16 May 2012 due to equipment malfunction.
Near surface (0.1 m) water salinity and temperature were recorded at all stations using a Pro Plus YSI probe concurrently with BL determinations. In addition, at stations S1, S3, and S5, 7.7 L triplicate water samples were collected individually with 9 L carboys, filtered through 25 µm mesh, concentrated to 50 ml, and fixed with buffered formaldehyde (ca. 1 % final concentration) for dinoflagellate enumeration at a later time.
Determination of dinoflagellate cell densities – Same as described for Objective 1 and 2. Meteorological data - Same as described for Objective 1 and 2.
Trends in bioluminescence levels
To examine general trends (i.e., increases/decreases) in bioluminescence over the years, estimates of BL were calculated based on averages of P. bahamense cell densities reported in previous studies (i.e., Clarke and Breslau, 1960; Seliger et al., 1971; Seixas, 1988; Walker, 1997;
Soler-Figueroa, 2006; Soler-Figueroa and Otero, 2015) using the average BL to P. bahamense density ratio observed during this study.
Statistical analysis
Non-parametric analyses were performed since data failed parametric assumptions. The difference in BL among sampling dates and sites was evaluated using the Kruskal-Wallis Analyses of Variance (KW-ANOVA). This test was also used to examine whether the abundance of each dinoflagellate species differed among sampling dates, as well as to evaluate if the cell densities of P. bahamense, C. furca, and Protoperidinium spp. (a bioluminescent dinoflagellate also presented in the bay) differed within each seasonal extreme. A Mann-Whitney U test was performed to evaluate seasonal differences in BL and species abundance (i.e., P. bahamense and C. furca). A Spearman rank correlation analysis was used to evaluate the relationships between the BL and bioluminescent dinoflagellate cell densities (i.e., P. bahamense and P. bahamense + Protoperidinium spp.). All statistical analyses were conducted using Sigma Plot 12.0.
Objective 4: Investigate the influence of the water circulation pattern in relation with the spatial and temporal distribution of the organisms.
Field Work
Two Acoustic Doppler Current Profilers (ADCPs) were deployed at BF, La Parguera, PR during the period from November 2, 2012 to December 5, 2012. A second deployment of ADCPs was done during the period from February 27, 2013 to March 31, 2013. One instrument was deployed near the entrance of the bay (ADCP1) and a second close to the inner marking of the bay (ADCP2), close to the location of station 2 where dinoflagellate samples were collected for the other portion of the study.
On the first deployment the ADCPs were a Nortek Aquadopp operating with an acoustic signal frequency of 1 MHz and a Nortek Aquadopp operating with an acoustic signal frequency of 2 MHz. These instruments were leased directly from Nortek AS and they were calibrated prior to being shipped for this lease. The 1 MHz ADCP had a maximum vertical cell resolution of 0.50 m, with a blanking distance of 0.40 m from the ADCP head. The ADCP took samples every 1800 s (30 min) and the samples were averaged for a period of 600 s (10 minutes). This combination was used to achieve a balance between battery life, data storage space, and measurement accuracy. This ADCP was deployed at the entrance channel to the BF to describe and determine the flow regime at this location, and observe any possible interaction between BF and the open ocean. The 2 MHz ADCP had a maximum vertical cell resolution of 0.25 m, with a blanking distance of 0.10 m from the ADCP head. This ADCP also took samples every 1800 s (30 min) and the samples were averaged for a period of 600 s (10 minutes). This ADCP was deployed at the entrance to the central mangrove channel inside BF to describe and determine the flow regime at this location, which can be at an interface between the saltwater from the bay and any freshwater resulting from surface run off during rain episodes.
For the second deployment (February-March, 2013) both Nortek Aquadopp ADCPs operated with a signal frequency of 2 MHz, which allowed for a higher vertical resolution at both deployment locations. The higher resolution resulted in a more accurate recording of the velocity features through the water column at the entrance of BF. At this deployment the ADCP at the entrance of the bay had 13 vertical bins, compared to the six bins which were available during the
November 2012 deployment. The configuration of both ADCPs followed the same parameters as those of the 2 MHz ADCP which was deployed on November 2012.
Water Level Analysis
A least-squares harmonic decomposition was computed on the water level time series to determine which tidal constituents were dominant on the water level record. The harmonic decomposition analysis allows to specifically target and compute the amplitudes and phases of the tidal constituents, all which have a known frequency. This gives a quantitative measurement of the contribution of each tidal constituent to the total water level. Any contribution that does not falls in one of the tidal frequencies used in the analysis will not show up in the results. For this analysis the T_TIDE routines (Pawlowicz et al., 2002) were used. In addition, the water levels at the bay were compared to the water levels at Magueyes Island. This was done in order to determine if there were any differences in the water levels between the entrance and the inside of the bay and those observed at Magueyes Island.
Water levels were also used to determine the tidal prism as well as the flushing rate of the bay. The tidal prism was calculated as Ω = ABηR (Dean and Dalrymple, 2001) where Ω is the tidal prism in units of m3, AB is the area of the bay (182,768 m2 in this case) and ηR is the water level range observed during each deployment day. This tidal prism is the total volume of water that was transported both into and out of the bay during each day. To further separately estimate the volume of water flowing into and out of the bay, and the excess or deficit of water volume each day at the bay, the same equation was applied independently to the amplitude of the water level during high and low tide, and the volumes were subtracted to estimate if there was an excess or deficit of water volume in the bay.
Currents, bottom water temperature, and meteorological analysis
Currents were first analyzed as both individual vector components and scalar magnitude and direction. As one of the main interests of this project was to determine the stratification and the three-dimensional structure of the circulation at the bay, a preliminary analysis of the currents at each vertical bin of the ADCPs as well as a depth-averaged analysis of the currents along the water column were conducted. This showed vertical variation in the along- and across-channel velocities and that the depth-averaging of the velocities are not a good representation of the circulation at the bay. Thus depth-averaging was disregarded as an analysis method, and it was decided to base all further analysis on the velocity profiles along the entire water column as well as the velocities along the top and bottom water layers. Following the main interest of studying the flow into and out of the bay and the flushing rate of the bay, it was also determined that all further analysis of the currents at the entrance of the bay would be based on the along-channel component, as this is the main component that determines the inflow and outflow of the bay.
Both currents and bottom water temperatures were analyzed as time series and were also rearranged into a matrix in which every row represented a deployment day. This matrix was useful to determine how the temporal variations in the currents were related to the temporal variations in the bottom water temperature, as well as to visually identify periodicity, and significant current and temperature events. To quantify the periodicity of the currents, bottom water temperatures, and wind the power spectrum density was estimated by using the Thomson’s multitaper method (Percival and Walden, 1993).
RESULTS AND FINDINGS
Objective 1 and 2: Determine the daily, spatial and seasonal variability of P. bahamense and C. furca and identify the environmental factors that may drive the spatial and temporal fluctuations of species at BF.
Pyrodinium bahamense and Ceratium furca cell densities
The highest average cell densities of P. bahamense were found during the wet season with 6.8 x 10³ ±6.5 x 10² cells L-1 (mean ± standard error; Figure 3). Ceratium furca cell densities were in average lower than those of P. bahamense during this season (2.0 x 10³ ±3.2 x 10² cells L-1; Figure 3). Daily and spatial variations were observed during this season in the population densities of both species (Figures 4 and 5). Overall, the maximum concentrations were observed at the inner stations of the bay (i.e. P. bahamense: S1-S3; C. furca S2 and S3).
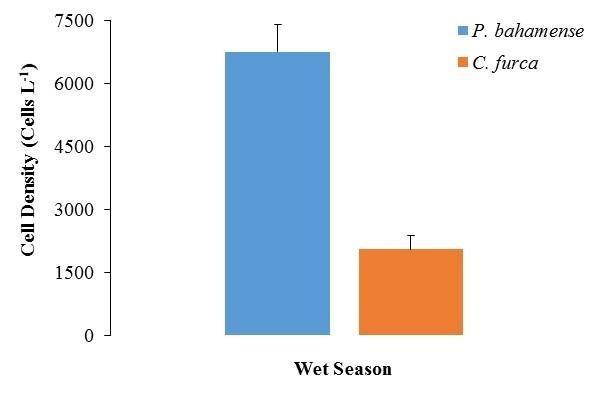
Figure 3. Comparison between Pyrodinium bahamense and Ceratium furca cell densities during the wet season. Bars represent standard errors (n = 186).

Figure 4. Pyrodinium bahamense cell densities recorded at S1 to S6 during the wet season, from November 5 to December 5, 2012. Note differences in scale between stations. Bars represent standard errors of triplicate averages.
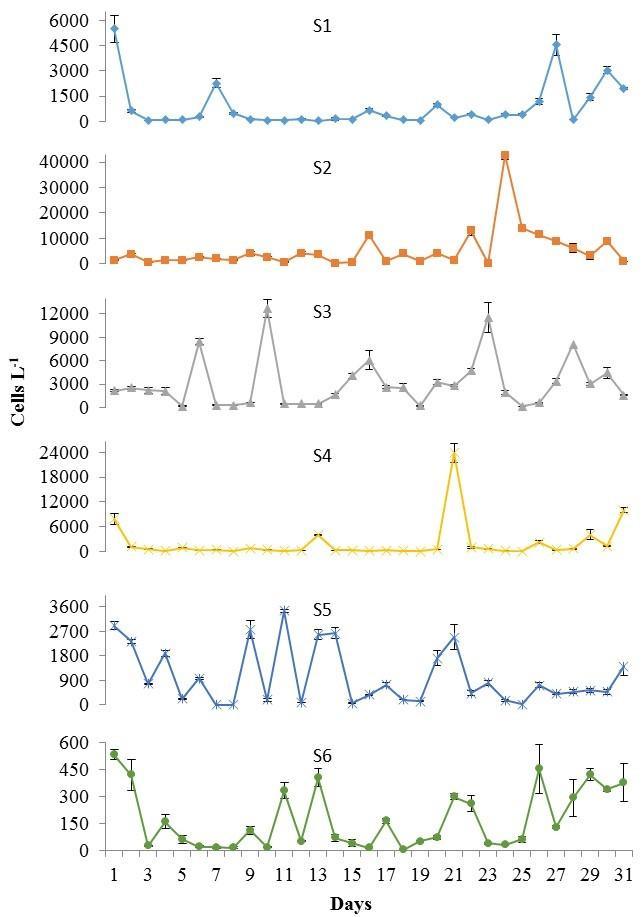
Figure 5. Ceratium furca cell densities recorded at S1 to S6 during the wet season, from November 5 to December 5, 2012. Note differences in scale between stations. Bars represent standard errors of triplicate averages.
During the dry season, a drastic reduction in P. bahamense average cell densities were observed (2.3 x 10² ±0.23 x 10² cells L-1; Figure 6), representing only 4% of those detected during the wet season. The numerically dominant dinoflagellate during this season was C. furca (average: 2.3 x 10⁴ ±2.2 x 10³ cells L-1; Figure 6), reaching in some occasions bloom conditions (i.e. 105 cells L-1). Overall, P. bahamense abundance was approximately 1% that observed for C. furca. A trend in thedaily fluctuations of both organisms was observed duringthis season. Increases in their population densities were observed around the second sampling week (i.e. especially at S4-S6), followed by a sudden reduction on March 20 (Figures 7 and 8). Spatially, the highest cell densities of both species were mainly observed at S3 and S4.
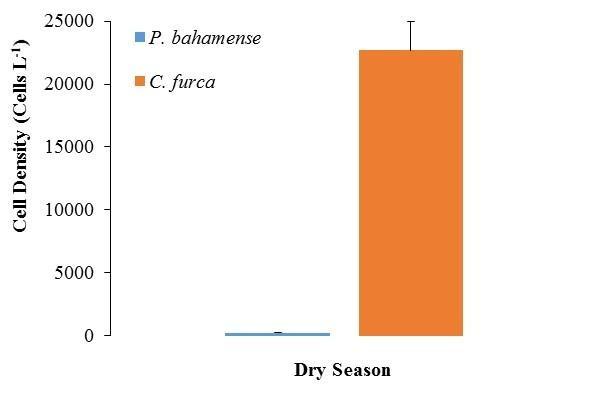
Figure 6. Comparison between Pyrodinium bahamense and Ceratium furca cell densities during the dry season. Bars represent standard errors (n = 186).
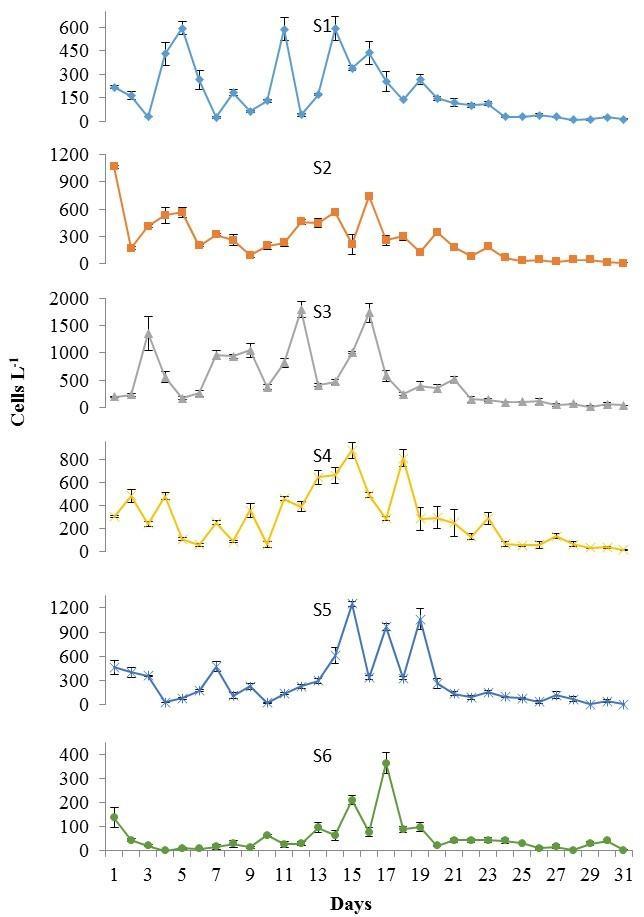
Figure 7. Pyrodinium bahamense cell densities recorded at S1 to S6 during the dry season, from March 1 to 31, 2013. Note differences in scale between stations. Bars represent standard errors of triplicate averages.
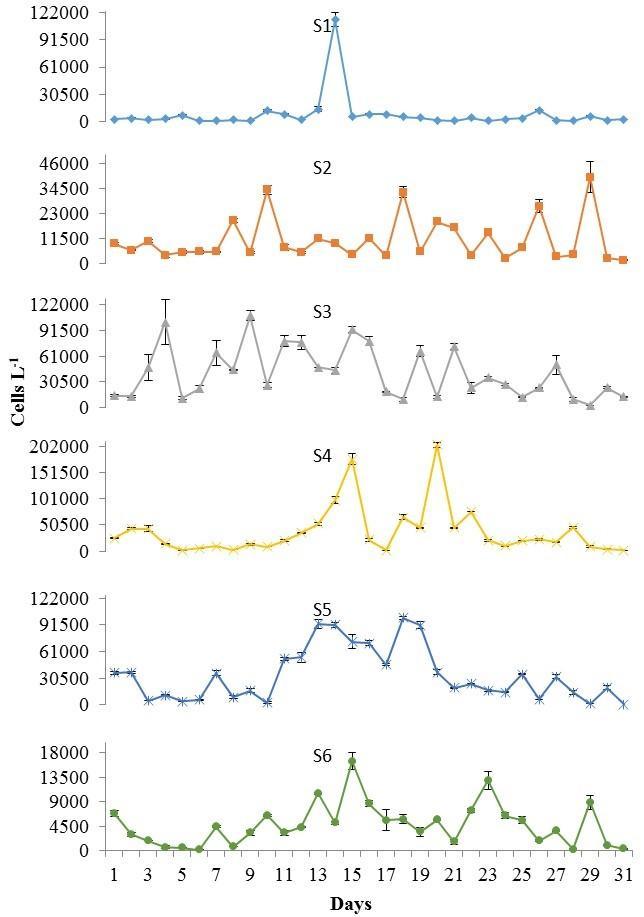
Figure 8. Ceratium furca cell densities recorded at S1 to S6 during the dry season, from March 1 to 31, 2013. Note differences in scale between stations. Bars represent standard errors of triplicate averages.
Patterns of variability in the dinoflagellate composition
The patterns of variability in the dinoflagellate composition were identified using PCO analysis (Figure 9). The main effect was that of seasons (i.e. accounting for a 55% of the total variation - Axis 1), with minor effects due to spatial and daily variability within each season. The wet season was represented towards the P. bahamense vector and the dry season towards the C. furca vector. Results from the PERMANOVA analysis confirmed the patterns observed in the PCO plot showing significant differences between seasons (PERMANOVA, p = 0.001), among days within each season (PERMANOVA, p = 0.001) and among stations during each season (PERMANOVA, p = 0.001, Table 3). Significant interactions between days (within seasons) and stations were also revealed (PERMANOVA, p = 0.001; Table 3). PERMANOVA analysis showed that seasons alone accounted for about 48% of the total variation (Table 1) and results of SIMPER analysis indicates that both species contributed equally (about 50%) to the observed dissimilarities between seasons (Table 2) even though the largest seasonal variation was observed for P. bahamense. Daily and spatial variations in the dinoflagellates only contributed ca. 10% of the total dinoflagellate variability (Table 1).
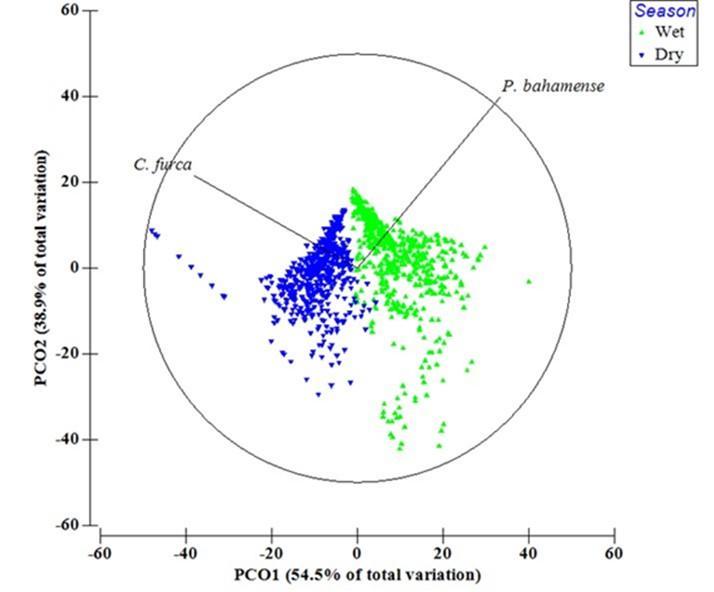
Figure 9. Principal Coordinate Analysis (PCO) plot based on P. bahamense and C. furca abundances during the wet and dry seasons. Analysis was based on Bray-Curtis resemblance matrixes with dinoflagellate abundances log (x +1) transformed. Vectors with the dinoflagellate abundances indicate changes of direction.
Table 1. PERMANOVA results comparing P. bahamense and C. furca abundances between seasons (Factor - Season), among days within each season (Factor - Days (Season)), among stations (Factor - Station), among stations within each season (Factor - Season x Station) and the interactions between days and stations for each season (Factor - Day (Season) x Station). Tests were based on 999 permutations using a Bray-Curtis resemblance matrix.
1113 263760 df - degrees of freedom; SS - sum of squares; MS - mean squares; Pseudo-F – pseudo-F ratio; P (perm) – permutation p value; unique perms – number of permutations.
Table 2. SIMPER analysis of dissimilarities between the wet and dry season based on P. bahamense and C. furca cell densities.
Groups Wet and Dry
Average dissimilarity = 23.8
Avg. Abund. = average abundance; Diss = dissimilarity; Contrib. = contribution; Cum. = cumulative
Environmental conditions and Pyrodinium bahamense and Ceratium furca variability
The role of several environmental factors on the seasonal variations in dinoflagellate composition was assessed by dbRDA (Figure 10). Along Axis 1, which explained ca. 39% of the total variability, seasons were separated. Strong correlations (r > ±0.65) along this axis were detected with salinity (r = -0.84), DOMFl (r = 0.80), pH (r = -0.77) and silicates (r = 0.67), suggesting their contribution to the seasonal difference in the dinoflagellate composition.

Figure 10. Distance based redundancy analysis (dbRDA) plot based on P. bahamense and C. furca abundances during the wet and dry seasons, with vectors showing the Spearman correlations between environmental variables and dbRDA axis. Analysis was based on BrayCurtis resemblance matrixes with dinoflagellate abundances log (x +1) transformed and environmental data log (x +1) transformed and normalized.
Discussion
This study was aimed at identifying the underlying mechanisms driving the alternations in abundance of two potentially HABs species at BF, P. bahamense and C. furca. Studies on dinoflagellate assemblages in this bay and available data on environmental conditions have been based on monthly samplings limiting their usefulness to decipher processes at time scales of days to weeks that may drive and control the population dynamics of these species. Different climate extremes can promote environmental pulsing processes that enable fluctuations in the dinoflagellate species abundance at periods unresolvable by monthly examinations (Smetacek and Cloern 2008). Daily samplings withinthe seasonal extremes evaluated in the present work allowed for a better understanding of the environmental factors controlling P. bahamense and C. furca populations.
Results from this study clearly indicate that the alternations in the abundance of P. bahamense and C. furca at BF are intimately linked to seasons, the local weather and the resulting changes in the environmental conditions. This was in agreement to recent observations (SolerFigueroa and Otero, 2015). Pyrodinium bahamense was consistently the numerically dominant dinoflagellate during the wet season when rains were six times greater than those observed during the dry season (Figure 11). During the dry season, a 26-fold decrease was observed in P. bahamense cell densities, together with a shift towards the dominance of C. furca. This seasonal
variabilityinthedinoflagellatecompositionwasassociatedwithsalinity,DOMFl,pHandsilicates, environmental variables that are strongly modulated by pluviosity The association of these environmental factors with pluviosity suggests that land-derived materials strongly modulate changes in abundance and species composition triggering different population behavior associated to different strategies of nutrient acquisition.
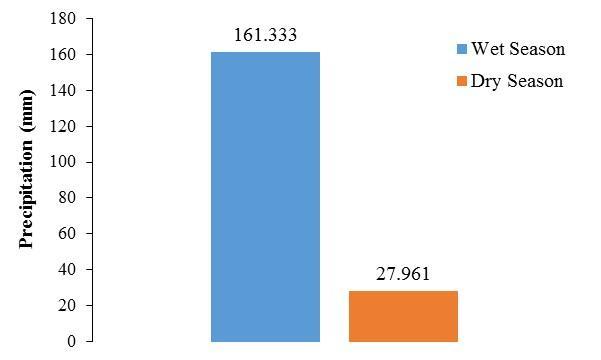
Figure 11. Precipitation regimes during the wet and dry season. Each bar represents the cumulative precipitation two weeks prior sampling and during sampling.
The dominance of P. bahamense during the wet season appeared to be related to nutrients inputs and other land-derived and watershed materials after rainfall events, in agreement with the bloom dynamics of this dinoflagellate in other regions (Usup and Azanza 1998; Phlips et al. 2004, 2006, 2011; Morquecho et al. 2012; Usup et al. 2012; Phlips et al. 2015). The low salinities and pH, and the high DOMFl and silicate concentrations observed during this season supports the inputs of land-derived materials into the bay. In contrast, the high cell densities of C. furca under periods of low precipitation, and thus, minimal terrestrial/watershed influence and lower nutrients concentration may be attributed to the ability of this species to prey upon other planktonic species (Smalley et al. 1999; Smalley and Coats 2002; Smalley et al. 2003).
Although daily and spatial variations in the distribution of dinoflagellates were also detected, these contributions were less important (i.e. each one explaining only ca. 10% of the total variability) and not related to changes in the dinoflagellate composition within each season, since each species maintained its seasonal dominance.
Objective 3: Determine the actual BL at BF, evaluate the putative declining bioluminescence trend, and identify the role of different environmental conditions on the BL.
Bioluminescence levels
The average BL during the wet season were 2.4 times higher than those observed during the dry season (Mann-Whitney U test = 39955.00, n = 396 (wet), n = 195 (dry), p < 0.001), with 4.3 x 10¹¹ ± 4.9 x 10¹⁰ photons sec-1 L-1. This difference was present despite the high daily fluctuations observed throughout the study (K-W ANOVA H = 437.78, df = 46, n = 18, p < 0.001; Figure 12).
Overall, the maximum BL during the wet season were recorded in October; however, BL decreased drastically after Hurricane Sandy (Figure 12). In contrast, frequently low BL characterized the dry season, except on March 19 and 21, when the BL were similar to the wet season average. Bioluminescence levels peaked again in May with an average of 4.3 x 10¹¹ ± 4.7 x 10¹⁰ photons sec-1 L-1
Spatial variations in BL were also detected among stations within each season, with the maximum levels towards the north of the bay, at S1 and S3 and at S2 and S3 during the wet and dry season, respectively (Wet: K-W ANOVA H = 35.86, df = 5, n = 66, p < 0.001; Dry: K-W ANOVA H = 40.09, df = 5, n = 33, p < 0.001; Figure 13).
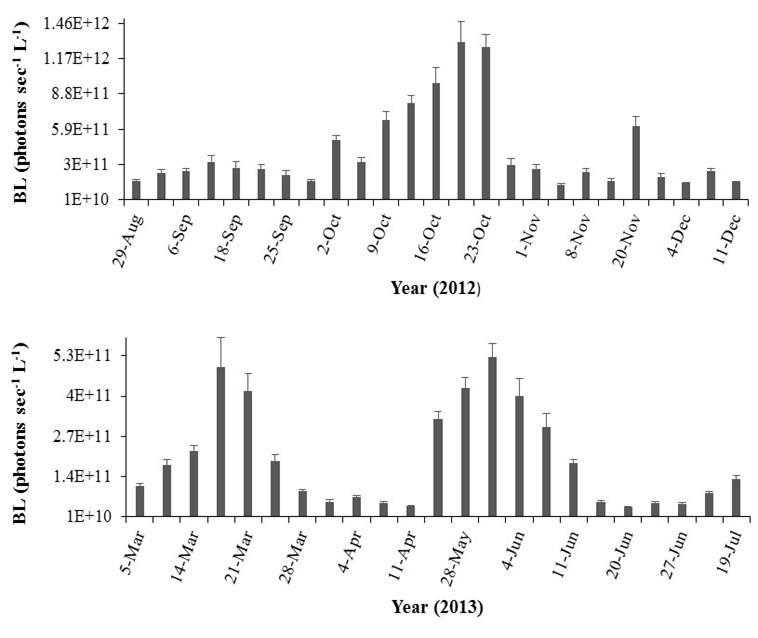
Figure 12. Temporal variability in bioluminescence levels (BL) recorded at Bahía Fosforescente including the a) wet (August 29 – November 29, 2012) and b) dry seasons (March 4 – April 11, 2013). Note differences in scales. Bars represent standard errors.
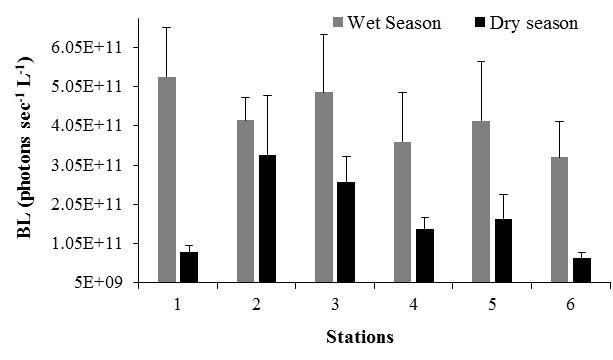
Figure 13. Spatial variability in bioluminescence levels (BL) recorded at Bahía Fosforescente during the wet and dry seasons. Bars represent standard errors.
Dinoflagellates cell densities
The average cell densities of each dinoflagellate species within each season were significantly different. Pyrodinium bahamense was numerically dominant during the wet season, with average cell densities of 16 and greater than 100 times those observed for C. furca and Protoperidinium spp., respectively (K-W ANOVA H = 391.90, df = 2, n = 207, p <0.001). In contrast, the average cell densities during the dry season represented ca. 1% and 22% of those observed for C. furca and Protoperidinium spp., respectively (K-W ANOVA H = 223.71, df = 2, n = 99, p < 0.001).
Pyrodinium bahamense cell densities during the wet season were significantly higher than during the dry season (Wet vs Dry: Mann-Whitney U test = 5165.00, n = 207 (wet), n = 99 (dry), p < 0.001), averaging 2.5 x 10⁴ ± 6.3 x 10³ cells L-1. During the dry season, average cell densities of this species represented ca. 1% of that observed during the wet season. Seasonal significant differences of C. furca were also revealed. Average densities of 1.9 x 10⁴ cells L-1 were found duringthedryseason, whilethedensityduringthe wet season averaged twelvetimeslessabundant (Wet vs Dry: Mann-Whitney U test = 24396.00, n = 207 (wet), n = 99 (dry), p < 0.001).
Significant differences in dinoflagellate cell density across all sampling days were also detected (P. bahamense: K-W ANOVA H = 423.00, df = 55, n = 9, p < 0.001, Fig. 14a, b; C. furca: K-W ANOVA H = 385.56, df = 55, n = 9, p < 0.001, Fig. 15a, b; Protoperidinium spp. K-W ANOVA H = 272.92, df = 52, n = 9, p < 0.001, Fig. 16a, b). Differences in P. bahamense cell densities occurred partly due to the bloom (≥ 5.0 x 10⁴ cells L 1) observed between October 9 and 23, which drastically decayed after the passage of Hurricane Sandy (Figure 14a). Cell densities of this species remained low and increased again in May (Fig. 14b). Maximal cell densities of C. furca (5.4 x 10⁴ ± 3.1 x10⁴ cells L 1) and Protoperidinium spp. (1.5 x 10³ ± 3.1 x10⁴ cells L 1) were observed on March 12 and March 21, respectively.

Figure 14. Temporal variability in the cell densities of P. bahamense at Bahía Fosforescente including the a) wet (August 29 – November 29, 2012) and b) dry seasons (March 4 – April 11, 2013). Note differences in scales. Bars represent standard errors.
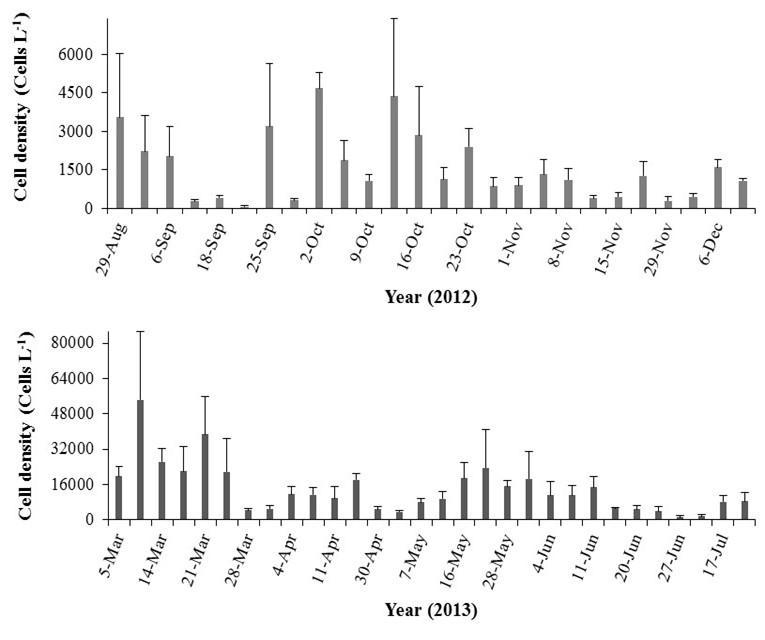
Figure 15. Temporal variability in the cell densities of C. furca at Bahía Fosforescente including the a) wet (August 29 – November 29, 2012) and b) dry seasons (March 4 – April 11, 2013). Note differences in scales. Bars represent standard errors.
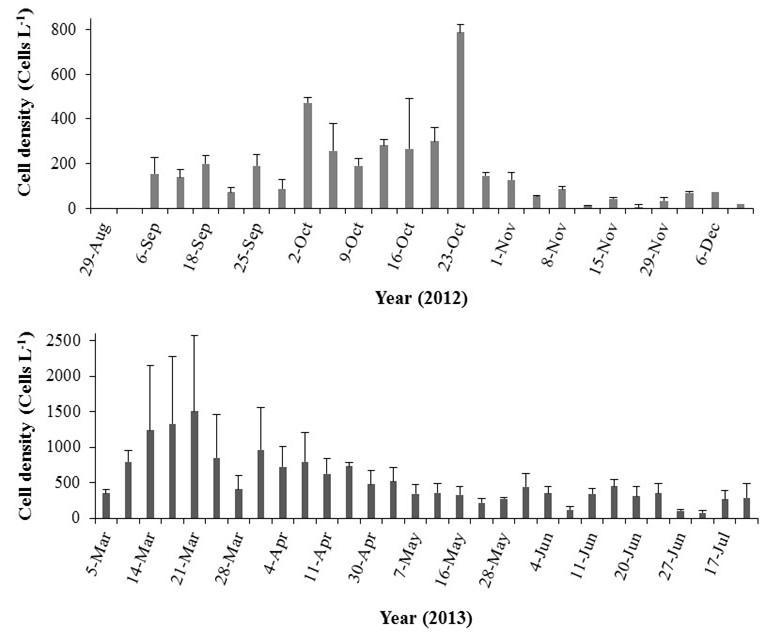
Figure 16. Temporal variability in the cell densities of Protoperidinium spp. at Bahía Fosforescente including the a) wet (August 29 – November 29, 2012) and b) dry seasons (March 4 – April 11, 2013). Note differences in scales. Bars represent standard errors.
Correlations between bioluminescent dinoflagellates and bioluminescence levels
A positive correlation was observed between P. bahamense cell densities and the BL recorded during all sampling days. This correlation became slightly stronger when Protoperidinium spp.,whichis also bioluminescent, was included (Table3).During eachsampling campaign, positive correlations were also observed between the bioluminescent dinoflagellates (P. bahamense and P. bahamense + Protoperidinium spp.) and the BL; however, the correlation was only stronger during the wet season (Table 3).
Trends in bioluminescence levels
The P. bahamense abundances from studies conducted during the past 50 years were used to calculate BL based on the average BL to P. bahamense ratio found during this study (Table 4). The highest BL were estimated during 1986, 2003, and 2010, which corresponds to years when blooms of P. bahamense (i.e., up to 105 cells L-1) were reported (Seixas, 1988; Soler-Figueroa, 2006; Soler-Figueroa and Otero, 2015). Therefore, our results suggest that there is no particular increasing or decreasing trend in BL at BF. However, it must be noted that these BL estimates were based on studies with different sampling sizes, techniques, times, and sites. Additionally, we assumed that the average BL of this study only corresponded to P. bahamense, and contributions by other bioluminescent organisms were not considered.
Table 1. Spearman rank correlations between the bioluminescent dinoflagellates and bioluminescence levels at Bahía Fosforescente.
All sampling days
Wet Season
Dry Season
Bioluminescence levels
P. bahamense r = 0.74, n = 141, p < 0.001
P. bahamense and Protoperidinium spp. r = 0.82, n = 141, p < 0.001
P. bahamense r = 0.89, n = 64, p < 0.001
P. bahamense and Protoperidinium spp. r = 0.89, n = 64, p < 0.001
P. bahamense r = 0.46, n = 33, p < 0.05
P. bahamense and Protoperidinium spp. r = 0.52, n = 33, p < 0.05
Table 2. Estimates of bioluminescence levels based on average cell densities of Pyrodinium bahamense from previous studies calculated using the average BL to P. bahamense density ratio observed during this study.
Seixas
Walker 1997
Jan-Dic '03 7-8
Soler-Figueroa 2006 Nov '10, Mar '11 8-930 AM
Soler-Figueroa and Otero 2015 Aug '12-Jul '13
11 This Study N = sample size, P. b. = P. bahamense (Cells L-1), s. e. = standard error, n/a = not applicable, BL = Bioluminescence Levels (photons sec-1 L-1)
Discussion
The seasonal trend in the dinoflagellate composition at BF was reflected in the bioluminescence and was also related to local meteorological conditions. High BL characterized the wet season, when pluviosity was six times greater than that observed during the dry season (Figure 17), and strongly correlated with the high cell densities of P. bahamense. A two-fold reduction in BL relative to the wet season was observed during the dry season, together with dramatic decreases in P. bahamense populations. These decreases were concomitant with a shift towards higher abundances of C. furca, a non-bioluminescent and mixotrophic dinoflagellate
However, peaks in bioluminescence during the dry season, similar to the average levels of the wet season, were attributed to increases in the populations of heterotrophic dinoflagellates such as Protoperidinium spp., and probably other bioluminescent dinoflagellates such as Polykrikos spp.
Overall, high BL were mainly observed at S1, S2, and S3 probably due to the spatial displacement of bioluminescent dinoflagellates. This spatial distribution in bioluminescence suggests that the water currents resulting from the dominant SE-SSE and ESE winds led to the accumulation of these species in the northern area of the bay. Previous studies have reported similarly high BL (Seliger et al., 1962; Seliger et al., 1971) and high cell densities of P. bahamense (Seixas, 1988) in the northern and northeast regions of the bay (near what was defined as S3 in this study).
EstimatesofBL,calculatedusing P. bahamense abundancesfromstudiesconductedduring the past fifty years and based on the average BL to P. bahamense ratio of the study herein, explicitly showed variable but stable conditions in P. bahamense populations and BL, but no a net trend. It is suggested that variations in bioluminescence over the past fifty years could have been also influenced by yearly oscillations in precipitation regimens (Figure 18). This study provided the first evidence to support that BL at BF are not decreasing and the bay maintain conditions favorable for the accumulation of abundant bioluminescent dinoflagellate populations.
At present, the perception of a BL decrease may be based on factors external to the bay. An increase in artificial light pollution over the years (Hölker et al., 2010; Davis et al., 2014) impairs the capacity of the human naked eye to discern the intensity of bioluminescence relative to the background. This effect is significant over long distances, especially due to scattering processes and cloud reflection (Kyba et al., 2011).
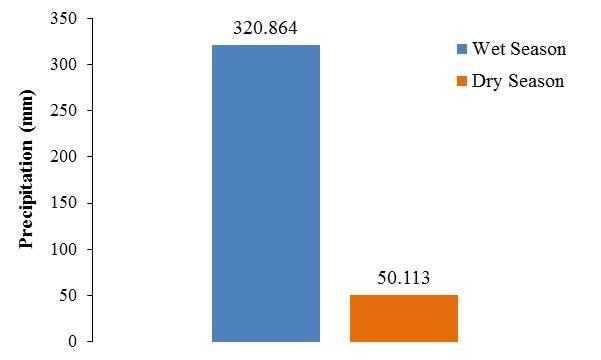
Figure 17. Cumulative precipitation during the wet (August – November 2012) and dry (January – the first two weeks of April 2013) seasons.
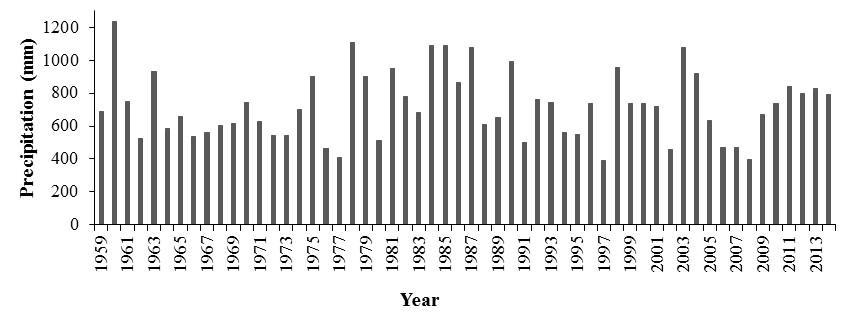
Figure 18. Cumulative yearly precipitation for La Parguera area, from 1959 to 2014. Precipitation records were obtained from the Magueyes Island meteorological station operated by NOAA.
Objective 4: Investigate the influence of the water circulation pattern in relation with the spatial and temporal distribution of the organisms.
Water levels in Bahía Fosforescente
Figure 19 shows the water level records at Magueyes Island and BF during the November 2012 and March 2013 deployments. The Magueyes Island water level was sampled at six minute intervals, and this tide gauge is maintained and operated by the NOAA National Ocean Service (NOS). The water levels at BF were obtained from the pressure record of the ADCPs, with a sampling interval of 30 minutes. From visual inspectionof Figure 19it is clearthat thewater levels at November 2012 and March 2013 present different characteristics. The most appreciable one is that during November 2012 the water level at Magueyes Island was consistently higher than at BF, and a priori this difference in water levels seems to be of a constant nature. In contrast, during March 2013 there are no substantial differences between the water levels at Magueyes Island and BF, with only minor differences in the peaks and troughs. It appears that no significant changes in water level phase between Magueyes Island and BF were present during both sampling periods. To verify the extent of these first observations, a more detailed analysis of the water level differences and spectral computations follows.
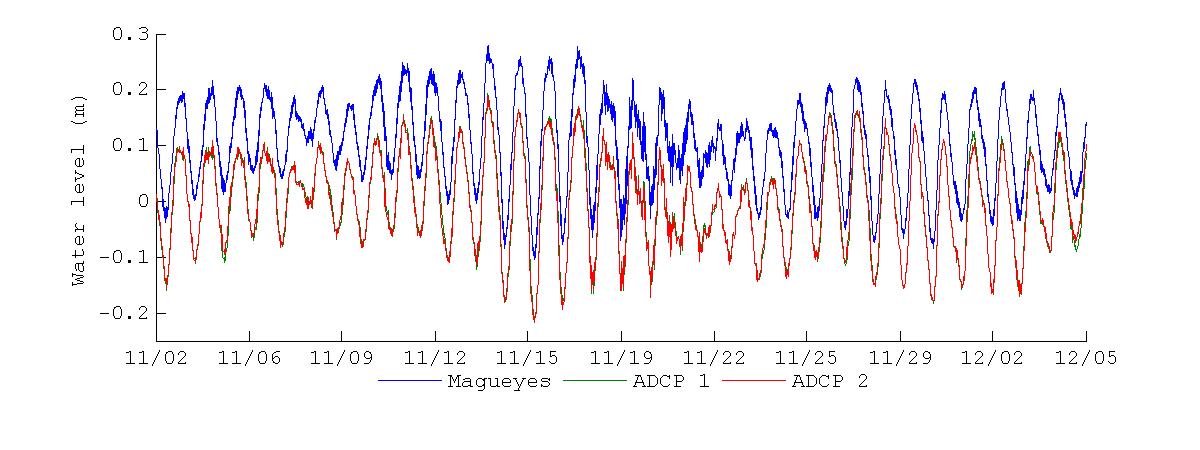
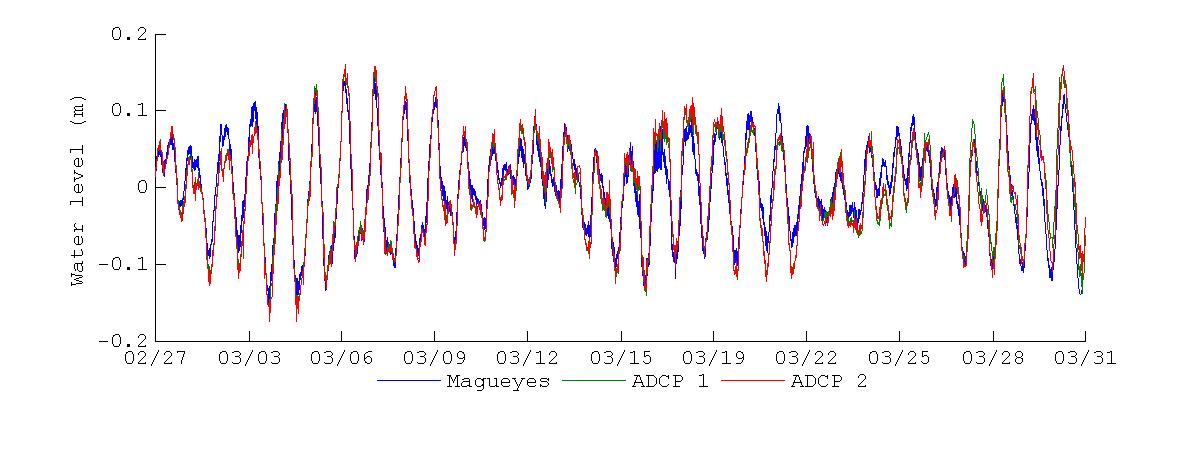
Figure 19 Water levels measured during the November 2012 (top) and March 2013 (bottom) deployments. Blue line represents the water levels at the tide gauge at Magueyes Island, green line the water levels at the ADCP at the bay entrance and red line the water levels at the ADCP at the back of the bay.
The water level differences between Magueyes Island and BF for the deployment periods are shown in Figure 20. As noticed previously, there was a dominant constant difference of about -0.1 m during the November 2012 deployment, along with short oscillations, except for November 25 - November 29, where there was a slight increase in the water level difference that spanned these days. For the March 2013 deployment, the difference of water level shows more variation, with no constant difference during the deployment. A noticeable difference between the two deployments is that the water level difference during March 2013 mostly oscillated about the zero line, further corroborating that there was no constant difference during this deployment.

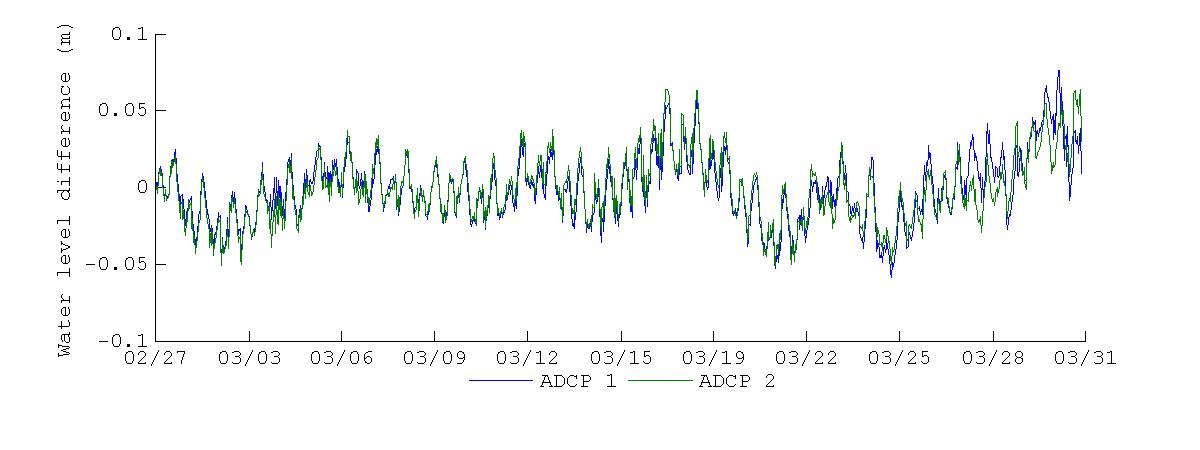
Figure 20. Water level difference between the Magueyes Island tide gauge and Bahía Fosforescente during the November 2012 (top) and March 2013 (bottom) deployments. Blue line represents the difference between Magueyes Island and the bay entrance and red line the difference between Magueyes Island and the back of the bay.
Dominant tidal constituents for all locations during the November 2012 deployment are shown in Figure 21. The main constituent at all locations is the K1 diurnal constituent, which has a period of 23.9344 hours. The next predominant constituent at all locations is the O1 constituent, with a period of 25.8193 hours. At the Magueyes Island location we then find a constituent that is not found at any of the other two locations in BF, the MM constituent with a period of 661.3111 hours.This constituent (knownas thelunarmonthly constituent)thus has aperiodof27.5546days, which would explain why there was an almost constant higher water level through the duration of the November 2012 deployment at the Magueyes Island location, while there was not a similar effect at BF
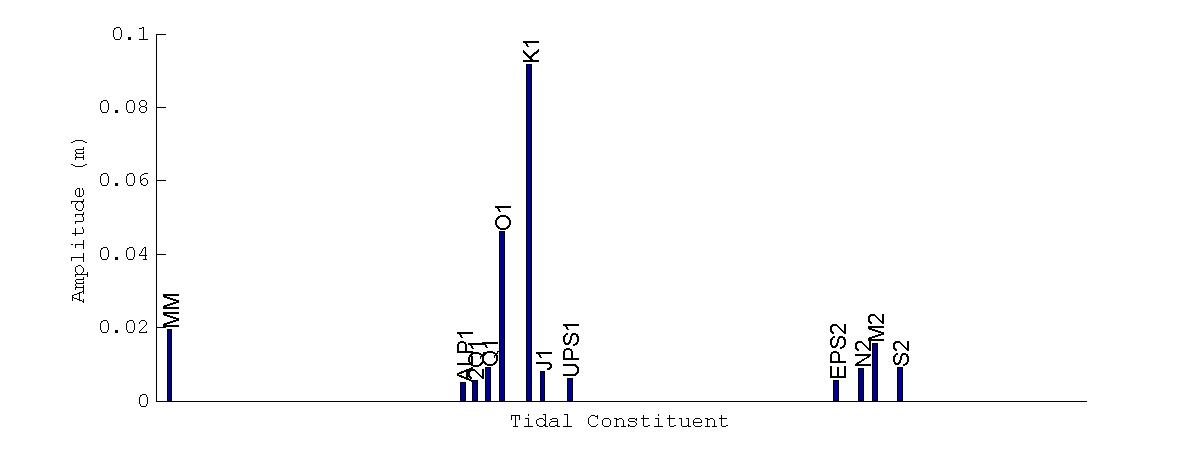
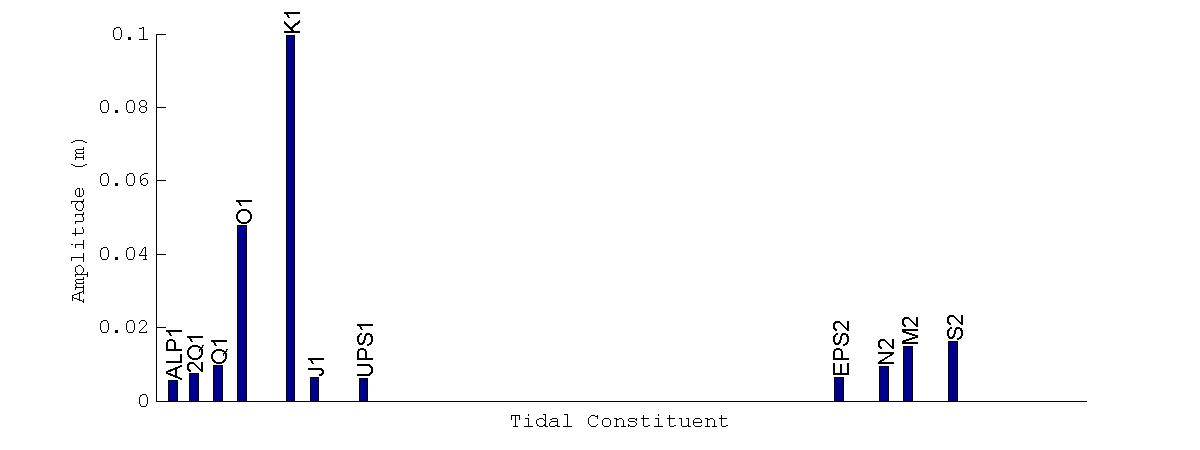

Figure 21. Dominant tidal constituents at Magueyes Island (top), Bahía Fosforescente entrance (center), and Bahía Fosforescente back (bottom) during the November 2012 deployment. X-axis represents the tidal periods from the harmonic decomposition. Labels on top of the bars describes the representative name of each tidal period.
Tidal constituents during the March 2013 deployment (Figure 22) show a different behavior than those from November 2012. First it is noticeable that the amplitude of the constituents is lower than for those during November 2012, by a factor of almost half for the dominant K1 constituent. Also, the O1 constituent has an amplitude almost equal to that of the K1 constituent, while during November 2012 the amplitude of the O1 constituent was about half than that of the K1 constituent. There is no contribution of the MM constituent during the March 2013 deployment at any of the stations. This could explain why in contrast to November 2012, there
was no constant increase of the water level at Magueyes Island when compared to the water levels at BF
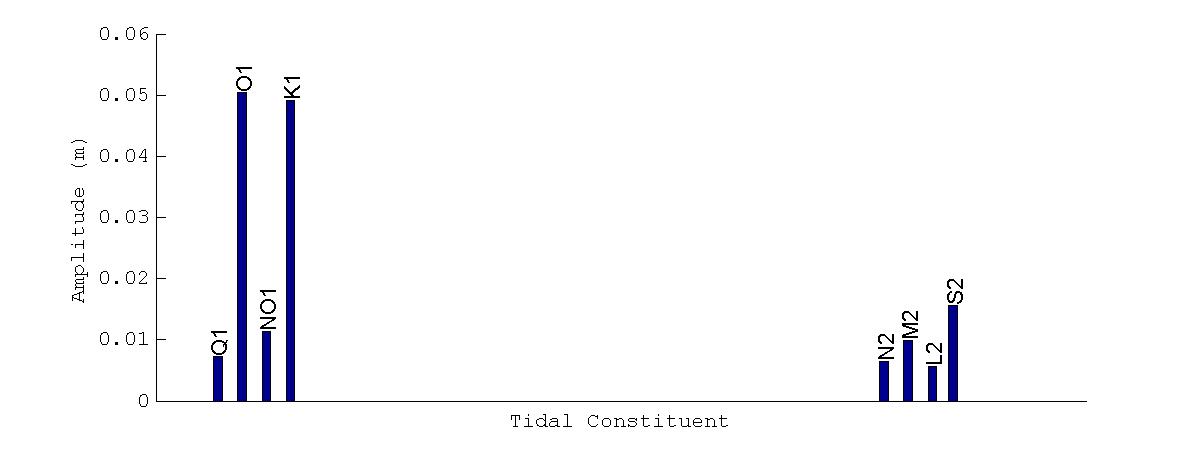

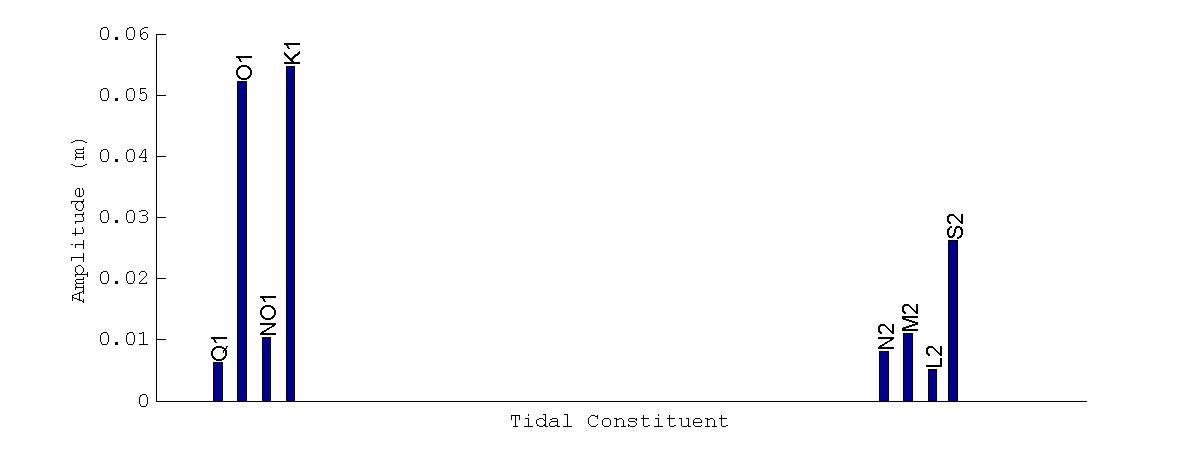
Figure 22. Dominant tidal constituents at Magueyes Island (top), Bahía Fosforescente entrance (center), and Bahía Fosforescente back (bottom) during the March 2013 deployment. X-axis represents the tidal periods from the harmonic decomposition. Labels on top of the bars describes the representative name of each tidal period.
Forthecaseofthesemi-diurnal constituents, Figures 21and 22showthattheircontribution to the water level at all stations is low, which confirms what can be determined from visual inspection of Figure 19, where the water levels appear to be predominantly diurnal. The low
amplitude of the M2 constituent is expected as the M2 constituent has a very small amplitude in the Caribbean Sea basin. An interesting result from the harmonic decomposition is that the principal semi-diurnal constituent S2 (12.0000 hour period) during the March 2013 deployment has a greater amplitude at BF than at Magueyes Island, while during the November 2012 deployment the S2 constituent had an almost equal amplitude at all three locations.
This harmonic decomposition of both deployment shows that there is some temporal variability in the tidal forcing of the water levels at Magueyes Island and BF. Thus in a monthly basis it can be expected that the water levels at BF can have a non-trivial variation, for example Figure 19 shows that the tidal range at BF can be of up to 0.3 m during November 2012, while during March 2013 the tidal range can then decrease to a maximum of up to 0.2 m. Also the data and the analysis shows that the tidal signal and water levels at Magueyes Island are not necessarily representativeofthose at BF,with thewaterlevels being predominantly higherat Magueyes Island when compared to BF
Bottom water temperature
The water temperatures measured by the ADCPs at the bottom of the bay were used to determine if there were variations in the temperature between the entrance and the back of the bay, as well as to determine if the heating and cooling cycles were dominated by the daily solar cycle or if there were additional mechanisms or events that influenced the water temperature in the bay. Inaddition,asthistemperaturerecordiscontinuous itallowstodetermineifthereisanyinteraction or relation between the changes in temperature and the observed currents in the bay. It is important to emphasize that this is the temperature measured at the bottom of the bay, so any heating would indicate that the solar heating is strong enough that it can heat the entire water column in a short amount of time. Likewise cooling at the bottom as measured by the ADCP would indicate enough loss of heat through the water column, sinking of colder water from the surface, or an influx of cold water into the bay.
Figure 23 shows the water temperatures at the bottom of BF during the November 2012 and March 2013 deployments. Visually it is clear that the temperature patterns were very different during each deployment. The first main difference is that temperatures were higher during the November deployment, with temperatures reaching 32C while during the March deployment temperatures reached 30C. Temperature at ADCP2 during the November deployment oscillated around the temperature observed at ADCP1, with temperatures oscillating by more than 2C. This is noticeable even at the end of the November deployment, when there was a sharp decrease in temperature at ADCP1 and the temperature at ADCP2 followed oscillating about this drop.
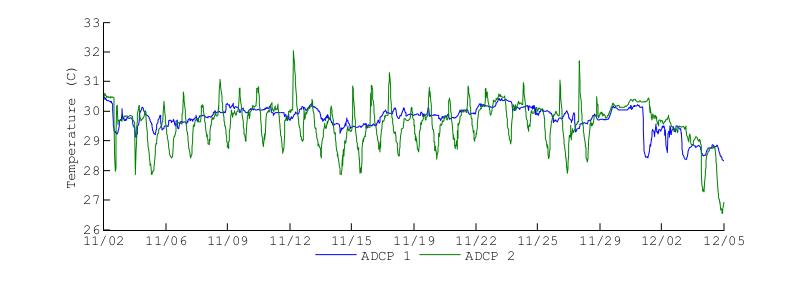
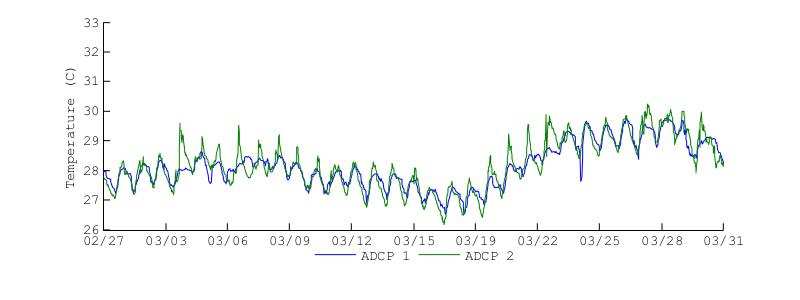
Figure 23. Water temperatures at the bottom of Bahía Fosforescente at the ADCP1 and ADCP2 locations during the November 2012 (top) and March 2013 (bottom) deployments.
During the March deployment the bottom temperatures at both entrance and back of the bay were very similar, with larger heating oscillations at ADCP2. In contrast to the November deployment, during the March deployments the temperatures at ADCP did not oscillate about the ADCP1 temperature. Most notably is that during the March deployment, for the most part, the temperatures at ADCP2 did not decrease below the ADCP1 temperatures as it happened during November and December. Overall, the bottom temperatures during this deployment observed a 1C increase at the back of the bay relative to the entrance, while maintaining a largely regular temperature pattern within each location.
Both deployments indicate that the bottom temperature at the bay entrance can be used as a background or "baseline" temperature for the bottom of the bay, while the bottom temperatures at the back of the bay maintaining a similar pattern but with larger daily fluctuations. This pattern seems to be related to the higher influence of coastal ocean. Since the entrance of the bay connects to the open ocean, the observed temperature patterns should be highly influenced by the exchange between the bay and the open ocean at the bay entrance The limited water volume at the bay causes larger temperature fluctuations than those observed at the entrance as observed at ADCP2. The clearest indication of the above mechanism is observed during November 30, 2012 to December 5, 2012 when there was a drastic drop in temperature at ADCP1, and the temperature at ADCP2 oscillated following this drop.
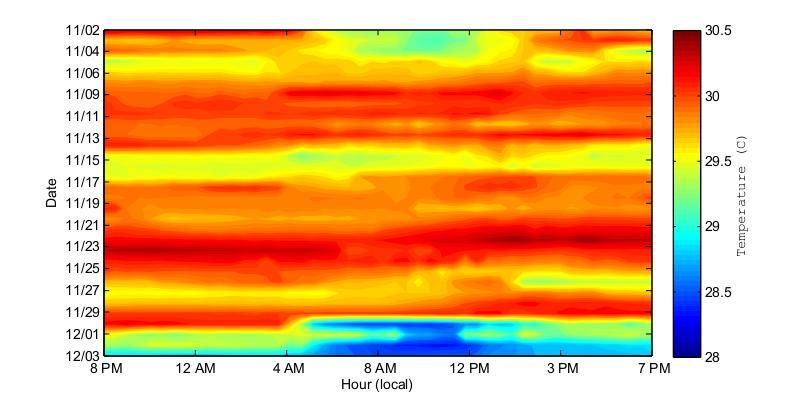

Figure 24. Water temperatures at the bottom of Bahía Fosforescente at the ADCP1 (top) and ADCP2 (bottom) locations during the November 2012 deployment. Temperatures are displayed at 24 hour intervals on the x-axis and the day is given on the y-axis.
To better understand if there were any temperature patterns that occurred or repeated at specific times, Figures 24 and 25 show the bottom temperature from 8 PM to 7 PM for each deployment day. In this way the daily heating and cooling cycles can be observed, as well as other unpredictable patterns which could be studied later. Figure 24 shows that during the November 2012 deployment there was a very clear dominant heating and cooling pattern at the back of the bay (ADCP2) while such a pattern was not observable at the entrance of the bay. At the back of the bay the bottom temperatures increased from about 4 PM to midnight, and then cooled from midnight to about 8 AM. In contrast, at the entrance of the bay there is no well-defined heating and cooling cycle.
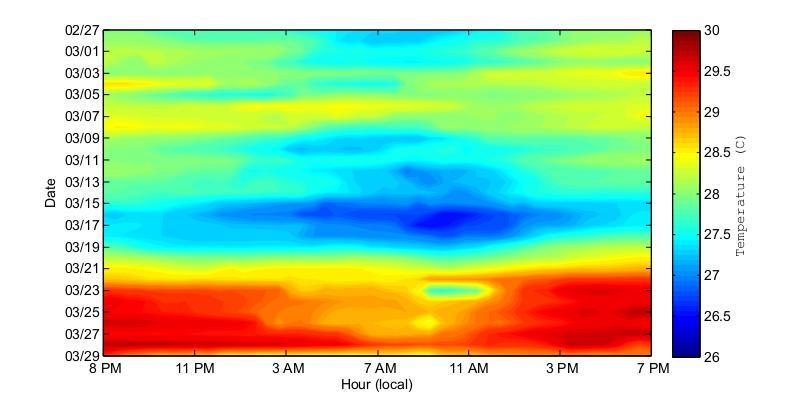
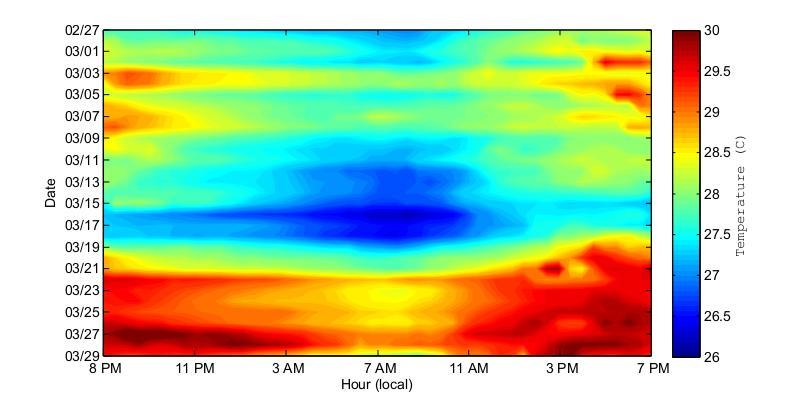
Figure 25. Water temperatures at the bottom of Bahía Fosforescente at the ADCP1 (top) and ADCP2 (bottom) locations during the March 2013 deployment. Temperatures are displayed at 24 hour intervals on the x-axis and the day is given on the y-axis.
During theMarch deployment(Figure25)theobservedtemperaturepatternsweredifferent from those in November. The graphs suggest a largely homogenous temperature distribution in the bay since no major difference between the entrance and the back of the bay were observed. The prevalent warm water conditions observed during March 21 to March 29 is of interest since it demonstrates potential changes in water circulation reflected on changes in temperature that may be significant to the environmental conditions experienced by the biological complex of the bay
Spectral analysis of bottom water temperature
Figure 26 shows the power spectrum density of the bottom water temperatures during the November and March deployments. Visual inspection of Figure 26 further corroborates what has been shown before, that during the November 2012 deployment there were differences in both amplitude and periodicity between the entrance and the back of the bay, while during the March 2013 deployment the observed temperatures at both locations were very similar.
During the November deployment the dominant periods at the entrance of the bay were 27.99, 23.05, and15.69 hours,whileat thebackof thebaythedominant periods were23.05, 24.49, and 11.88 hours. The period of 23.05 hours, which was observed at both locations, supports that the background temperature of the bay is determined by the temperature of the incoming water at the entrance, while the 11.88 hour period at the back of the bay corroborates the observation that there is a strong heating and cooling twice per day at this location.
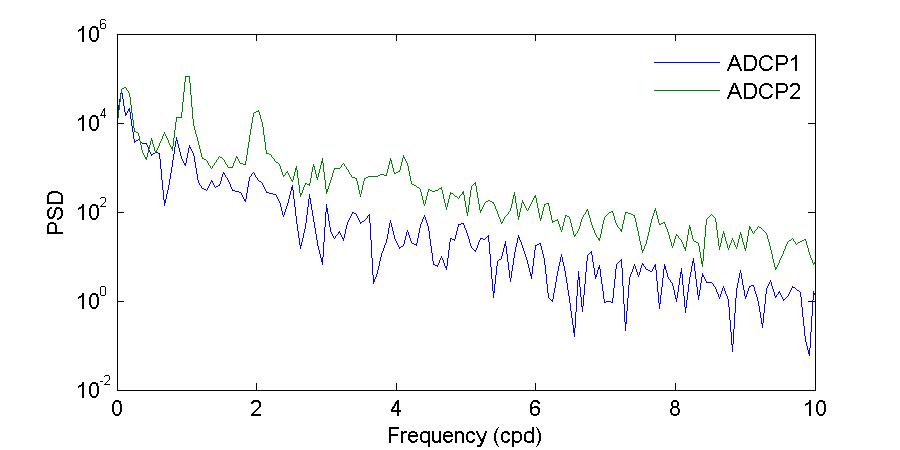
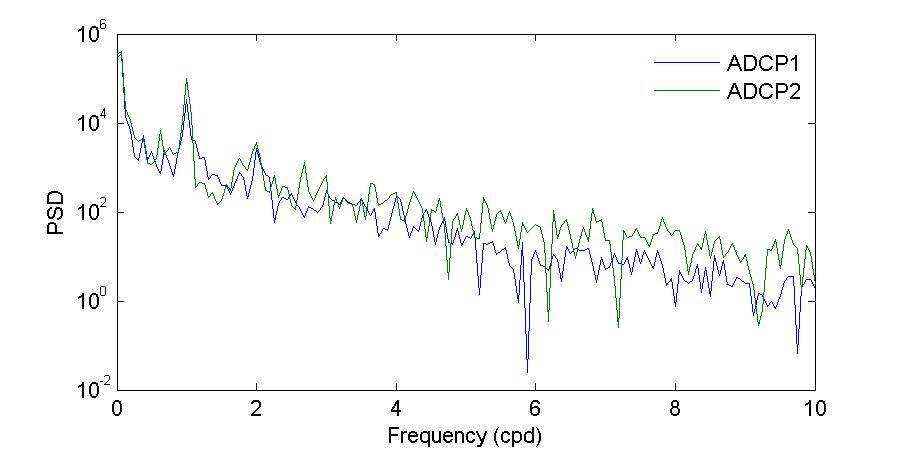
Figure 26. Power spectrum density (PSD) computed using the Thomson multitaper method for the bottom temperatures during the November 2012 (top) and March 2013 (bottom) deployments.
The shape of the March deployment spectra shows more amplitude similarities between both locations, agreeing with the observations of more homogeneous temperatures and limited variability between the sites. In terms of the peak periods, temperatures at the back of the bay had moredistinctpeaks during this deployment thanduringthe Novemberdeployment. Attheentrance of the bay the dominant periods were 64.00, 24.00, and 11.99 hours while at the back of the bay the dominant periods were 38.40, 17.69, 13.71, 11.99, and 8.93 hours. As during November, the period observed at both sites is the 11.99 hour period, the semi-diurnal cycle of heating and cooling. The 24.00 period at the entrance of the bay agrees exactly with the solar diurnal period (which for tides is the S1 constituent). None of the other periods reflect a tidal or solar forcing. The generation mechanisms and physical significance of these other periods should be explored in the future.
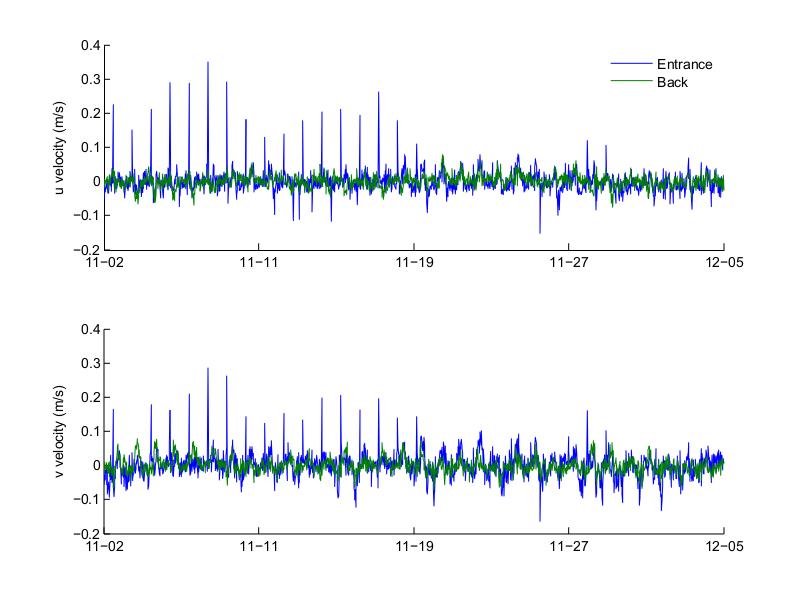
Figure 27. Top layer across- and along-channel (top and bottom, respectively) velocities at the entrance and back of Bahía Fosforescente during the November 2012 deployment.
Currents at Bahía Fosforescente
Analysis of the depth averaged currents at the two ADCP locations showed that due to the difference in flow direction between the top and bottom layers of the water column such a depth average analysis is not applicable for BF. Thus the analysis of the currents during the November and March deployments will be based on the top and bottom layers of the water column. Since the dominant component that affects the flow into and out of the bay is the along-channel velocity component (meaning the velocity component parallel to the bay entrance channel), from now on the analysis is based on this component, and velocity and along-channel velocity are used interchangeably, unless the across-channel term is explicitly used, referring then to the velocity component perpendicular to the bay entrance channel. In the case of the November deployment the bottom and top layers for the entrance were from 1.08-1.58 m and 3.08-3.58 m from the ADCP head, respectively. At the back of the bay the bottom and top layers were from 0.48-1.28 m and from 3.08-3.78 m from the ADCP head, respectively. For the March deployment the bottom and top layers at the entrance were from 0.3-1.6 m and from 2.9-3.4 m from the ADCP head, respectively. At the back of the bay the bottom and top layers were from 0.3-1.1 m and from 3.083.78 m from the ADCP head, respectively.
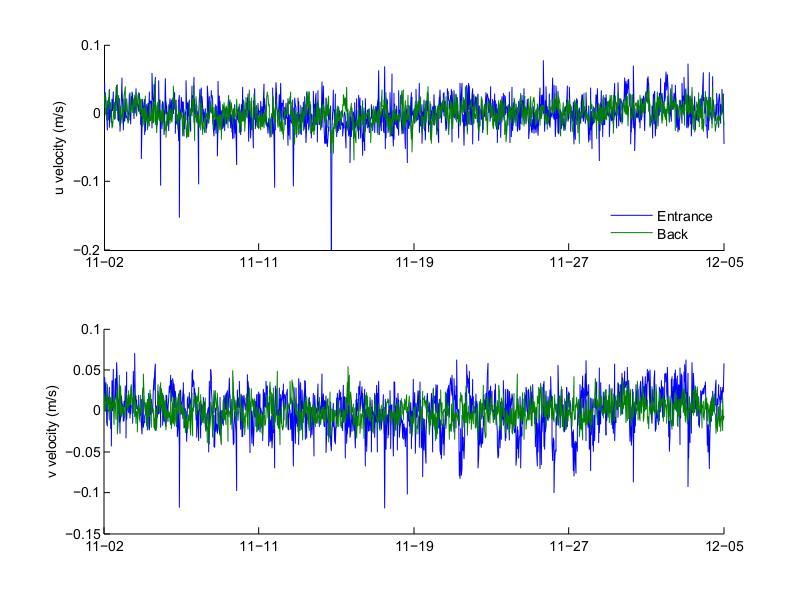
Figure 28. Bottom layer across- and along-channel (top and bottom, respectively) velocities at the entrance and back of Bahía Fosforescente during the November 2012 deployment.
Figures 27 to 30 show the top and bottom layer along- and across-channel velocities at the entrance and back of the bay for the November and March deployments. For both deployments the top layer along-channel velocity was predominantly into the bay, while the bottom layer was predominantly out of the bay. Velocities during the November 2012 deployment had higher amplitude than those measured during the March 2013 deployment, both at the top and bottom layers. During November the maximum top inflow velocity was 0.285 m/s at the entrance and 0.077 m/s at the back and the maximum bottom outflow velocity was 0.119 m/s at the entrance and 0.041 m/s at the back. For March the maximum top inflow velocity was 0.095 m/s at the entrance and 0.060 m/s at the back, while the maximum bottom outflow velocity was 0.071 m/s at the entrance and 0.046 m/s at the back. The velocities at the back of the bay mostly follow the general pattern observed at the entrance, similar to what was observed with the bottom temperatures, where the temperatures at the back of the bay oscillated following the temperatures at the entrance. The velocities during the March deployment also had a noisier signal than those during November, with few noticeable peaks during the March deployment.
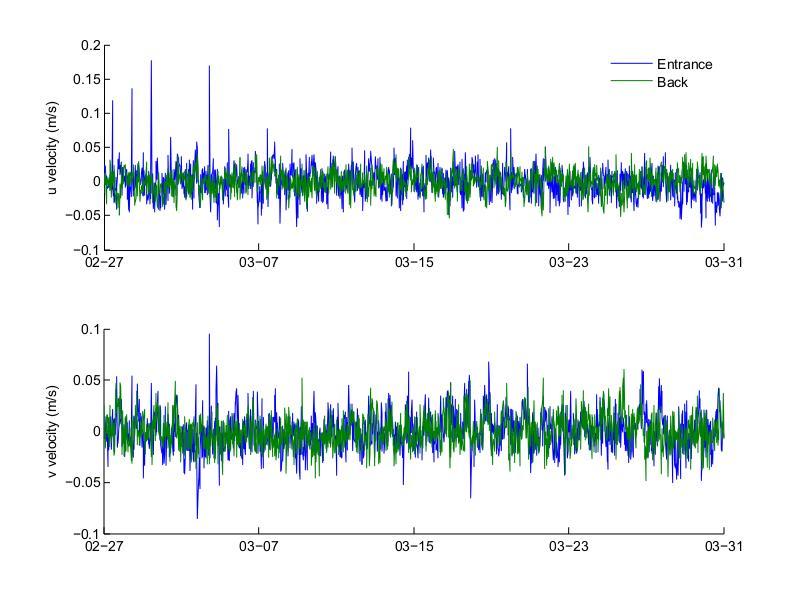
Figure 29. Top layer across- and along-channel (top and bottom, respectively) velocities at the entrance and back of Bahía Fosforescente during the March 2013 deployment.
The vertical profile of the along-channel velocity at the bay entrance during the November deployment is shown in Figure 31. It is evident that velocities do not exhibit a well-mixed, singlelayer behavior even though the depths of BF are shallow. For the most part the flow into the bay occurred on the top layer of the water column, as it was shown when the top and bottom depths were averaged in Figures 10 to 13. Similarly, the outflow mostly occurred at the bottom depths. A reversal ofthis trend occurred at sometimes,specificallyat thebeginningof therecord(November 2-5) and during a longer period of time from November 28 to December 4. During the latter there was in flow both at the surface as well as, progressively through the days, through the middle of the water column down to the bottom depths. This is an event that should be further explored as to what was its forcing mechanisms and significance, as it looks as if due to some given conditions the velocity field progressively spread down from the surface to the bottom during six days.
During the March deployment (Figure 31, bottom) the across-channel currents through the water column had an amplitude of half or less than those observed during November. In contrast to November, it is not clear from the figure that most of the inflow occurred through the top layer. Significant outflow occurred both at the top and bottom layers and similar to November, velocities did not exhibited a single-layer behavior. A phenomenon that was not observed during November is that there are many instances where inflow velocities occurred at various depths inside the water column, away from the top or bottom layers. These events had a duration of hours, with velocities in a different direction occurring on top and bottom of these inflow areas. This would cause a shear in the vertical column that was not evident during November. Another difference from the pattern observed during November is that the surface inflow velocities did not penetrated as much into the
water column, staying within the top 0.5 m of water, while in November penetration of up to 1.5 m was observed.

Figure 30. Bottom layer across- and along-channel (top and bottom, respectively) velocities at the entrance and back of Bahía Fosforescente during the March 2013 deployment.
These vertical profiles show that although it is evident that the vertical distribution of the velocity at the entrance of the bay is not uniform and cannot be described simply with a singlelayer approximation, the behavior of the velocities is very different between the two observed months. In particular the lower velocities and “choppiness” of the vertical velocity profile during March 2013 led to think that seasonality should have a great impact on the currents at the bay. It should be noticed that during March 2013 the wind speeds were in average higher than in November, and there was more variation in the wind directions. This could be the main cause behind the “choppiness” observed in March. Also from this profiles there is an indication that during March 2013 the velocities were predominantly out of the bay, while during November the inflow and outflow appear to be more balanced.


Figure 31. Vertical profile of the along-channel velocity at the entrance of the bay during the November 2012 (top) and March 2013 (bottom) deployments. Velocities are displayed at 24 hour intervals on the x-axis and the day is given on the y-axis.
To get a better understanding of the diel behavior of the observed currents, Figures 32 and 33 show the along-channel average velocities at hourly intervals (x-axis) during the deployment period (y-axis) During November (Figure 32) there was persistently an inflow current at the top layer that occurred at around 6 AM during the first 17 days of the deployment and also during November 28. On the bottom layer a there is a persistent outflow current occurring at different time between noon and 6 PM. In the case of the bottom this persistent outflow feature not occurs for a limited time at the same hour as is the case of the inflow feature on the top, but it has a longer duration spanning more than an hour. Looking back at the daily temperature contours (Figure 24) one can see that the timing of these events on the top and bottom layers coincides with the time during which there is an abrupt cooling (6 AM) and then a subsequent heating (noon - 6 PM) at the inside of the bay. This suggests that the inflow and outflow currents are being influenced by the daily cooling and heating cycle within the bay
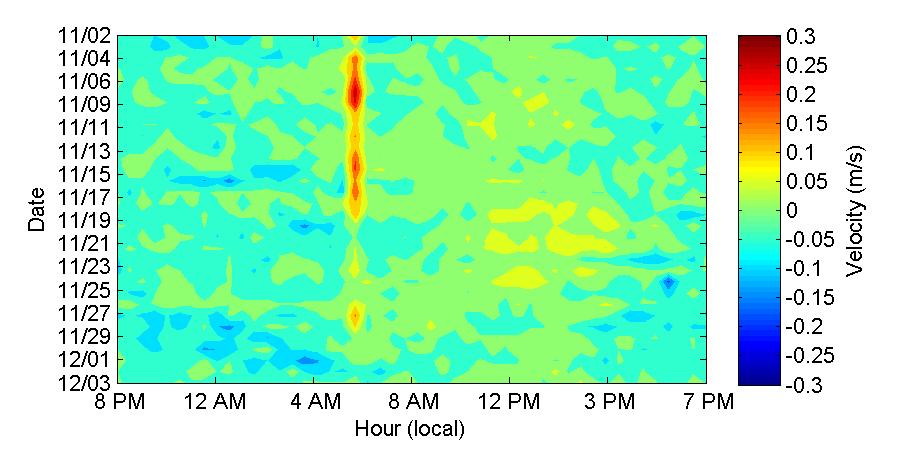

Figure 32. Along-channel velocities at the top and bottom layers of the entrance of Bahía Fosforescente during the November 2012 deployment.
During March (Figure 33) the currents pattern is different to what was observed during November, although the influence from the daily cooling and heating cycle from the inside of the bay is still apparent. At the top layer there were a couple of days where there was an inflow at around 6 AM as in November, but the majority of the inflow events occurred at times spanning from 11 AM to 5 PM. On March 3 there was an outflow event at the surface that had a duration of about four hours, and a shorter outflow event during March 17. No similar top layer outflow events were observed during November. At the bottom layer there were both inflow and outflow events. Bottom inflow events were persistent at about 6 AM while bottom outflow events were persistent at 6 PM. As mentioned previously for the observed currents during November, these times agree with the times when abrupt cooling and subsequent heating were present during March (Figure 25).
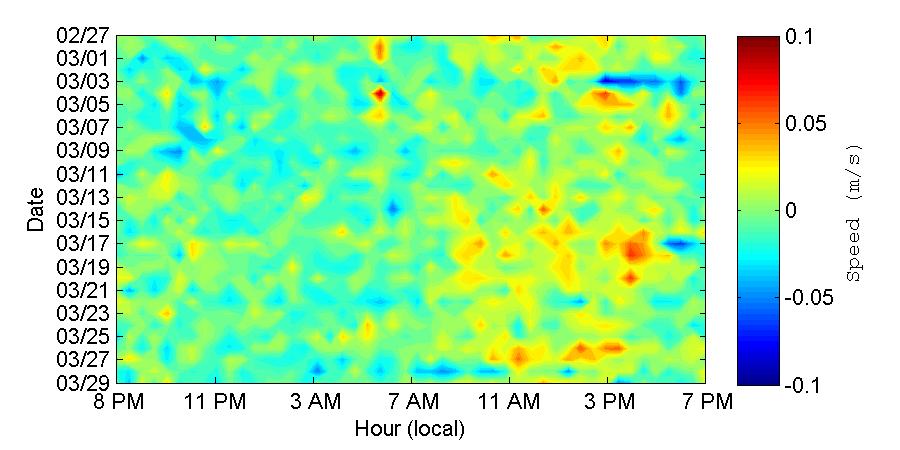

Figure 33. Along-channel velocities at the top and bottom layers of the entrance of Bahía Fosforescente during the March 2013 deployment.
Spectral analysis of along-channel velocities and comparison to winds and bottom temperatures
Given thatthereseems to beaperiodicityofabout 12to 24hoursin theobservedvelocities, a Thomson multitaper power spectral density estimate was computed on the time series to determine the dominant periods on the along-channel velocity records and compare them to the periods on the bottom water temperatures as well as the winds. Figure 34 shows the spectrum of the observed top and bottom along-channel velocities during November and March. The spectrum shows a dominant 24 hour period at both months and at both the top and bottom layers. The next dominant period is that of 12 hours for both months, and in the case of November 2012 there is another dominant period of 8 hours. The 24 hour period agrees exactly with the daily period that is also dominant for the bottom temperature and wind observations (Figures 26 and 35, respectively). All of these period peaks are also clearly observable in the wind spectrums for both months.
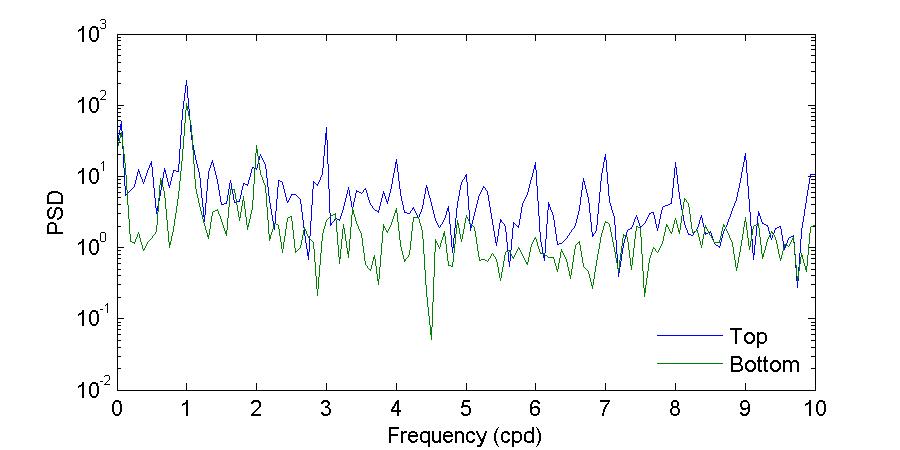

Figure 34. Multitaper power spectral density for the along-channel top and bottom velocities during the November 2012 (top) and March 2013 (bottom) deployments.
The comparison of the along-channel velocities spectra along with the bottom temperature and wind spectra indicates that the main circulation features at the bay result from a combination ofthedailycoolingandheatingcyclesaswellastheinfluenceofthedailywinds.Fromthevelocity spectra it can be said that the tidal cycles have little to no influence on the observed currents at the bay, as none of the dominant tidal periods is of dominance on the velocity spectra. Thus from this analysis the inflow and outflow currents at the entrance of the bay are dominated by the heating and cooling at the inside of the bay as well as the winds, with the inflow predominantly happening through the top layer of the water column and the outflow at the bottom layer during November 2012, while in March 2013 there was inflow both at the top and bottom layers, while outflow occurred predominantly through the bottom layer.
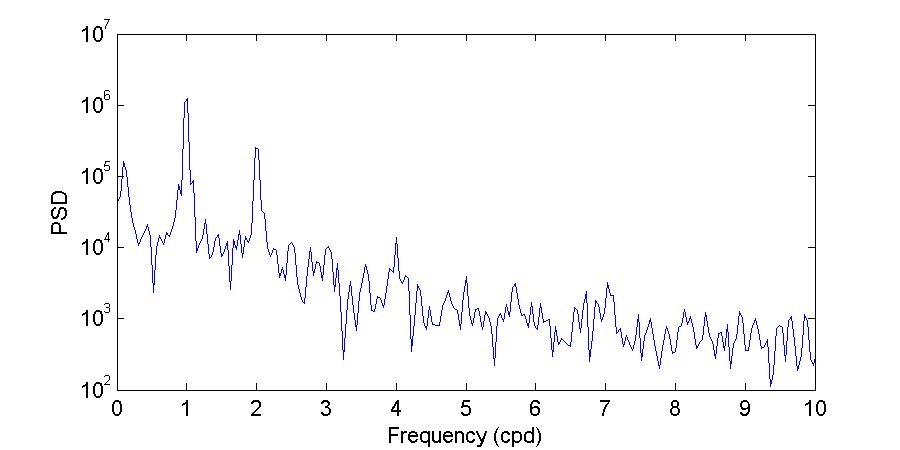
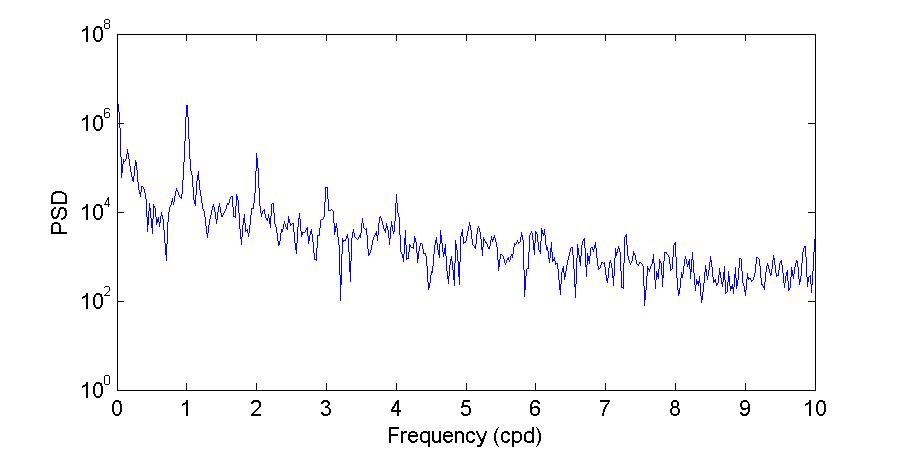
Figure 35. Multitaper power spectral density for the wind speeds during the November 2012 (top) and March 2013 (bottom) deployments. Winds were averaged in 10 minute intervals prior to the analysis to smooth the time series.
Tidal prism and flushing of Bahía Fosforescente
The tidal prism and flushing of the bay were estimated using the water level records from November 2012 and March 2013. The tidal prism and the flushing of the bay were calculated for each day of the deployments. This gives a more detailed description of how the bay is filled up or flushed on a daily basis, which can in turn be used to better determine relationships between the flushing of the bay and the daily concentration of dinoflagellates. Figure 36 shows the tidal prism during November and March. In this case the tidal prism is the total volume of water that went either into or out of the bay during each day. During November the total volume of water that was transported either into or out of the bay was greater than during March, reaching up to more than 6x10⁴ m3 while in March the maximum reached about 5x10⁴ m3. The minimum volume during November never reached 2 x10⁴ m3, while in March the minimum volume transported reached 1.5 x10⁴ m3 . This means that during November there was a greater volume of water being transported into or out of the bay, which agrees with the observation of faster velocities during this month than during March 2013. From visual inspection it appears that there is a general prism cycle of around 18 days for both months.
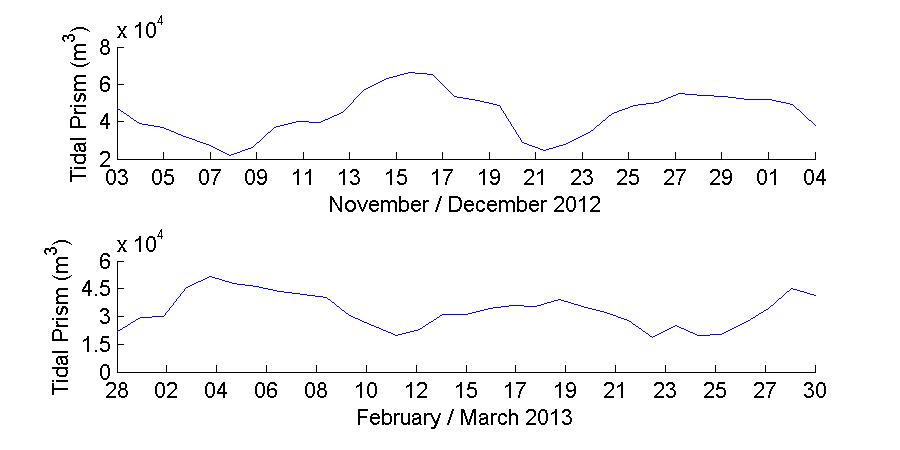
Figure 36. Daily tidal prism of the bay during the November 2012 (top) and March 2013 (bottom) deployments.
The daily inflow, outflow and residual volumes at the bay are shown in Figure 37. During November both inflow and outflow volumes reached higher magnitudes than during March. The average inflow and outflow volumes during November were 2.12 m3 and 2.29 m3 respectively, while in March the average inflow and outflow volumes were 1.62 m3 and 1.71 m3 respectively. The residual volumes represent if for a given day there was a gain or loss of water volume on the bay. Residual volumes for both months resulted in an average loss of water volume, where the average residual volumes were -1.72x10³ m3 during November and -9.69x10² m3. This is remarkable as this means that during November the bay had a loss of water that averaged an order of magnitude greater than that during March.
There seems to be a cycle of around 20 days in the residual volume during November and of around 8 days during March. This calculation of the inflow and outflow volumes on a daily basis shows that the transport of water into and out of the bay is not uniform neither on a daily or monthly basis. Thus an estimation of these volume transports using a shorter record of just days would not provide the same of detail, nor would capture any seasonal variations that could occur. In particular the difference in periodicity of the volume transport would not be captured by a shorter recording period, and a clear example of such an event that would be missed during a shorter record would be the flushing event during November 15-25, where through all these days there was a consistent loss of water volume from the bay.
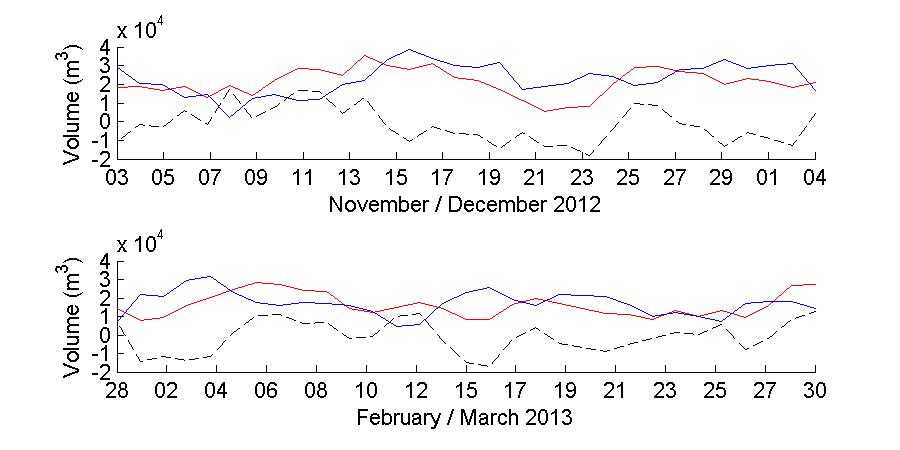
Figure 37. Daily inflow (red), outflow (blue) and residual (black) volumes during the November 2012 (top) and March 2013 (bottom) deployments.
OBJECTIVES ACCOMPLISHED
Objective 1 – Determine the daily, spatial and seasonal variability of P. bahamense and C. furca. This objective was achieved. Results indicated that seasons alone accounted for about 48% of the total variation in the dinoflagellate composition, while daily and spatial variation only accounted for ca. 10% of the total variation. Pyrodinium bahamense was the numerically dominant dinoflagellate during the wet season and a shift towards the dominance of C. furca were found during the dry season.
Objective 2 - Identify the environmental factors that may drive the fluctuations of species. This objective has been meet. A multivariate analysis showed that seasonal differences in dinoflagellates composition were better explained by salinity, dissolved organic matter fluorescence, pH and silicates, environmental variables that are significantly influenced by different precipitation extremes. Thus, results indicate that the alternations in the abundance of P. bahamense and C. furca at BF are intimately linked to seasons, the local weather and the resulting changes in the environmental conditions.
Objectives 3 - Examine the response of P. bahamense and C. furca to different nutrient enrichments. This objective was waived and changed to – a) Determine the actual BL at BF and evaluate the putative declining bioluminescence trend and b) Identify the role of different environmental conditions on BL. The seasonal trend in the dinoflagellate composition, described in Objective 1, was also reflected in the bioluminescence. High levels characterized the wet season and strongly correlated with the high cell densities of P. bahamense. During the dry season, dramatic decreases in P. bahamense populations resulted in simultaneous reductions in BL. This suggests that environmental changes exerted by different meteorological conditions are linked to variations in BL by a modulation in dinoflagellate composition. An evaluation of BL based on publications over the past fifty years showed variations, but not a declining trend, thus opposing
the notion of dwindling BL at the bay and supporting the idea that as during past decades, the present conditions remain favorable for the accumulation of abundant populations of bioluminescent dinoflagellates.
Objective 4 - Investigate the influence of the water circulation pattern in relation with the spatial and temporal distributionoftheorganisms. Adetaileddescriptionofthewaterlevels, bottom water temperature, winds, and currents in the bay was achieved for November 2012 and March 2013. The analysis shows the relationship of the bottom water temperature and winds on the observed currents, with very little or no influence of the tides on the currents. The current profile over the water column showed a two layer circulation regime, with inflow occurring predominantly on the top layer and outflow occurring on the bottom layer. Stratification was not possible to be directly measured or determined since although salinity, temperature, and density along the water column were measured with the CTD the complexity of the necessary data processing and analysis did not allowed for the completion of the task.
PROJECT IMPACTS AND PRODUCTS
1) This is the first study conducted at BF with a high spatiotemporal resolution that yielded vital information to help develop a robust link between environmental forcing and the response of dinoflagellate populations and BL at the bay. Results from this study provide substantial evidence to support that weather and the resultant environmental conditions are the principal factor controlling the alternating abundances of P. bahamense and C. furca. This represents a scientific advance in understanding the population dynamics of two potentially harmful dinoflagellates and show the importance of high-frequency monitoring to understand better the role of environmental forcing on the populations of these fast fluctuating organisms and especially in this time of global climate change. Furthermore, this study provided the first evidence to support that BL at BF are not decreasing and the bay maintain conditions favorable for the accumulation of abundant bioluminescent dinoflagellate populations. A well stablished long-term monitoring program will provide the best science based management approach to guarantee the role of this environment as an important habitat for protected species and for tourism.
The hydrodynamic observations of water levels, bottom temperature, and currents showed that there is variability both daily and seasonally in the measured variables. It was shown that the temperature inside the bay is modulated by the temperature of the water inflow at the bay entrance, which serves as a background temperature over which the inside temperature oscillates. The current measurements showed that a two layer circulation regime exists in the bay, with inflow occurring predominantly on the top layer and outflow occurring at the bottom layer. Circulation was dominated by the influence of the daily cooling and heating cycles inside the bay as well as by the winds. In addition the transport of water volume into and out of the bay was found to vary both daily and seasonal, with an estimated flushing time of about 20 days during November 2012 and about 8 hours during March 2013. During both months a net water volume transport out of the bay was observed, with a difference of one order of magnitude in water volume transport of out the bay occurring during November when compared to March. This variability in all measured hydrodynamic variables further shows the importance of high frequency, long term monitoring.
2) The methods employed in this study (i.e. FlowCAM and UBAT) and the knowledge gained were used to evaluate the status of another important BioBay in PR, Puerto Mosquito (PM) in Vieques. A moratorium for visiting this bay was established by the Department of Natural and Environmental Resources of Puerto Rico (DNER), due to an apparent “blackout” of the bay, and
visits were restricted only to Fridays, Saturdays, and Sundays from 6:00 pm to 12:00 am. During a multiagency task force, the DNER Secretary, Carmen Guerrero, requested the PI of this study to conduct bioluminescence measurements at PM and to collected water samples to determine the dinoflagellate abundances in order to assess the recovery of the bay to conditions pre-moratorium. The bay was monitored in two occasions, during the “blackout” and recovery, and two technical reports were prepared and shared with the DNER, Puerto Rico Environmental Quality Board, The Vieques Conservation and Historical Trust, and Fish and Wildlife Service Results from this study were invaluable in the decision to derogate the moratorium.
3) A technical report about Bioluminescent Bays and Climate Change was prepared for the Puerto Rico Climate Change Council. Also, we collaborated in the “mandatory and additional practices for bioluminescent bays” that were included in the Ecotourism Guide for the PR Tourism Company.
4) We published the first article related the dinoflagellate ecology at BF since 1971 (SolerFigueroa, B.M. and E. Otero. 2015. The influence of rain regimes and nutrient loading on the abundance of two dinoflagellate species in a Tropical Bioluminescent Bay, Bahía Fosforescente, La Parguera, Puerto Rico. Estuaries and Coasts 38:84-92 - Published online: 12 May 2014). Additionally, an article related to the Objective 3 of the study herein was submitted to the Journal of Experimental Marine Biology and Ecology (Soler-Figueroa, B.M. and E. Otero. Seasonal changes in bioluminescence levels and dinoflagellates composition in a tropical bioluminescent bay, Bahía Fosforescente, La Parguera, Puerto Rico).
5) Thesis and Dissertations – Deciphering Bahía Fosforescente: New Approaches towards the Understanding of this Unique Ecosystem (Dissertation of the PI; to be presented on May 11).
6) Presentations - Bioluminescence levels at Bahía Fosforescente: Myth vs Realitypresented at the 36th Association of Marine Laboratories of the Caribbean scientific meeting held in Ocho Rios, Jamaica (June 17 – 21, 2013). Also, at 5th Sea Grant Symposium at Mayaguez (February 20, 2013) and at “Segundo Congreso de Áreas Naturales Protegidas” at San Juan (August 28, 2014).
7) We initiated an activity in coordination with EcoElectrica, LP and a tourist service provider at La Parguera (Ismael Ramos) in order to develop a calibrated visual assessment of bioluminescence levels in BF. The idea is to evaluate if this instrument free monitoring assessment is of use as an accurate proxy of bioluminescence for future community based monitoring.
8) The PI of this study participated in an interview conducted by Aixa Alemán Díaz, a PhD student from the American University, Washington, DC. Aixa is working with an anthropological project related to the social use and perspective of corals reefs and bioluminescent bays in La Parguera. The knowledge gained during this study was shared during the interviewed.
9) The methods and findings of this study were shared by the PI in an interviewed conducted by the Travel Channel and are going to be presented in their America’s Greatest Outdoors program. The findings of this study and information related to BioBays were also shared with Professor Susanne M. Winterling from the Oslo Academy of Fine Art in Norway. She is exploring the phenomenon of bioluminescence in her work Bioluminescence of the Coastline Ecosystem in Puerto Rico and Immersion to create a blog and an exhibition that will include sculptural elements and architectural and photographic displays. More information of her work can by find in the following link: http://lopublico.betalocal.org/Susanne-Winterling
10) A video with the new technologies used in the study herein is being presented in the Oceánica exhibition at Plaza las Américas. Around 500 people visit weekly this exhibition.
11) A presentation on BioBays (“Fitoplancton, Bioluminiscencia y Bahías Bioluminiscentes”) was prepared and given to the following schools and/or organizations:
- High school students that will work at Tres Palmas Reserve.
- Employees of the Conservation Trust of Puerto Rico at Hacienda Buena Vista in Ponce (January 31, 2013).
- Teachers and community leaders during an educational workshop on Wetland Conservation of the Conservation Trust of Puerto Rico at Hacienda Buena Vista in Ponce (April 5, May 3 and May 31, 2013)
- Students of the Escuela Secundaria Especializada en Ciencias, Matemáticas y Tecnología, Caguas - night trip to BF and on site educational talk.
- Students of the Escuela Arturo Grant Padal, Lajas in their 1st Agricultural Fair (April 26, 2013).
- Personnel of EcoEléctrica, L.P. (May 17, May 30 and June 12, 2013).
- General community and employees of Ecoleléctrica during their Open House held on December 14, 2013 at their facilities in Guayanilla.
- Students participating in the Program Centro Universitario para el Acceso (CUA; May 29, 2013).
- Employees of the DNER and the PR Tourism Company. A field trip to the different ecosystems was also included (May 31, 2013).
- Teachers and students of the Colegio San José Superior, Caguas during their scientific fair week dedicated to the Bioluminescent Bays of Puerto Rico (January 27, 2014).
- Students of the Academia San Sebastían Mártir, San Sebastían (January 29, 2014)
- Student members of the Organización Histórico Cultural y Ambiental from the Escuela Superior de Cayey (May 14, 2014).
- Participants of a Writing Workshop coordinated by “Centro de Redacción de Español, UPRM” and the Sea Grant Program (September 20, 2014).
- Tourist service providers in Vieques during a workshop coordinated by DNER (July 24, 2014).
RECOMMENDATIONS
The fact that BL and the dinoflagellate populations at BF are strongly modulated by weather and runoff have profound management implications and warn managers of the sensitivity of this and other similar coastal ecosystems to changes in watershed practices and to climate change. At present it is unknown if the plasticity of the extant phytoplankton populations will cope with the more frequent rains and storms expected as a result of global climate change or to changes in land use pattern due to changes in human activities. These factors are capable of modifying the vertical structure of natural waters and the patterns of nutrient inputs, sediment loading, salinity and pollutant transport that may alter oxygen balance, light penetration and the overall bay productivity, thus potentially changing the capacity of the system to sustain the extant biological assemblages. Thus, our findings support the importance for establishing effective ecosystem based management for this important resource especially considering the increased pressures exerted on these coastal ecosystems.
The technologies and instrumentation used in this work (i.e. FlowCAM and UBAT) demonstrated to be useful tools to conduct and implement high frequency monitoring programs, in this and other coastal ecosystems, to gain a better understanding of the role of environmental forcing on the populations of fast fluctuating phytoplankton organisms, which represent the base
ofthetrophicfoodwebs. Furthermore,theinformationgainedbyacontinuousmonitoringprogram will provide long-term data that serve to assess the response of the phytoplankton community to climate change (Hays et al., 2005; Moore et al., 2008; Anderson, 2014).
A balance between management/conservation practices and usage (i.e. tourist operations) should be encouraged to maximize sustainability. Bioluminescence bays in general should be declared no-wake zones and no-anchoring zones to prevent destabilizing the bottom and sediment resuspension. Thus, the placement of speed signs and the installation of a mooring-buoy system are strongly recommended. These minimal efforts will provide a first step to safeguard and lessen any potential impact in these highly vulnerable and unique coastal ecosystems.
REFERENCES
Amador, J.A., P.J. Milne, C.A. Moore and R.G. Zika. 1990. Extraction of chromophoric humic substances from seawater. Mar. Chem. 29:1–17.
Anderson, M.J. 2001. A new method for non-parametric multivariate analysis of variance. Austral. Ecol. 26: 32-46.
Anderson, M.J., R.N. Gorley and K.R. Clarke. 2008. PERMANOVA+ for PRIMER: Guide to Software and Statistical Methods. PRIMER-E, Plymouth, United Kingdom.
Burkholder, P. R. and L. M. Burkholder. 1958. Studies on B vitamins in relation to productivity on the Bahía Fosforescente, Puerto Rico. Bull. Mar. Sci. Gulf and Carib. 8(3): 203-223.
Clarke, G.L. and L.R. Breslau. 1960. Studies of luminescense flashing in Phosphorescent Bay, Puerto Rico, and in the Gulf of Naples using a portable bathyphotometer. Bull. Inst. Océan. Monaco. 1171: 1-32.
Clarke K.R. and R.M. Warwick. 2001. Changes in marine communities: An approach to statistical analysis and interpretation. 2nd ed. Plymouth, UK: PRIMER-E, 172p.
Davies, T.W., J.P. Duffy, J. Bennie and K.J. Gaston. 2014. The nature, extent, and ecological implications of marine light pollution. Front. Ecol. Environ. 12(6): 347–355. doi:10.1890/130281
Dean, R.G. and R.A. Dalrymple. 2001. Coastal Processes with Engineering Applications. Cambridge University Press.
Dybas, C.L. 2011. Ripple marks The story behind the story. Oceanography 24(4): 8–12.
Glynn, P.W. 1973. Ecology of Caribbean coral reef. The Porites-reef-flat biotype: Part I. Meteorology and hydrography. Mar. Biol. 20: 297-318.
Gold, K. 1965. A note on the distribution of luminescent dinoflagellates and water constituents in Phosphorescent Bay, Puerto Rico. Ocean. Sci. 1:77-80.
Holmes, R.M., A. Aminot, R. Kérouel, B.A. Hooker and B.J. Peterson. 1999. A simple and precise method for measuring ammonium in marine and freshwater ecosystems. Can. J. Aquat. Sci. 56: 1801-1808.
Hölker, F., T. Moss, B. Griefahn, et al. 2010. The dark side of light: a transdisciplinary research agenda for light pollution policy. Ecol. Soc. 15: 13.
Koseff, J. R.; J.K. Holen; S.G. Monismith and J.E. Cloern. 1993. Coupled effects of vertical mixing and benthic grazing on phytoplankton populations in shallow, turbid estuaries. J. Mar. Res. Vol 51:843-868.
Kyba, C.C.M., T. Ruhtz, J. Fischer and F. Hölker. 2011. Cloud coverage acts as an amplifier for ecological light pollution in urban ecosystems. PLoS ONE 6: e17307.
Margalef, R. 1957. Fitoplancton de las costas de Puerto Rico. Invest. Pes. 5: 39-52.
Margalef, R. 1961. Hidrografía y fitoplancton de un área marina de la costa meridional de Puerto Rico. Invest. Pesq. (Spain) 18: 33-96.
McArdle, B.H. and M.J. Anderson. 2001. Fitting multivariate models to community data: a comment on distance based redundancy analysis. Ecology 82: 290–297.
Morquecho, L., R. Alonso-Rodríguez, J. A. Arreola-Liárraga, and A. Reyes-Salinas. 2012. Factors associated with moderate blooms of Pyrodinium bahamense in shallow and restricted subtropical lagoons in the Gulf of California. Bot. Mar. 55(6): 611-623.
Orrico, C.M., M.A. Moline, I. Robbins, B. Zelenke, A. H. Barnard, W. Strubhar, J. Koegler and C. Moore. 2010. A new tool for monitoring ecosystem dynamics in coastal environments: Longterm use and servicing requirements of the commercial Underwater Bioluminescence Assessment Tool (U-BAT). Oceans 2009, MTS/IEEE, 1–7.
Otero, E. 2009. Spatial and temporal patterns of water quality indicators in reef systems of southwestern Puerto Rico. Carib. J. Sci. 45: 168-180.
Parsons, T.R., Y. Maita, and C.M. Lalli. 1984. A manual of chemical and biological methods for seawater analysis. Oxford: Pergamon.
Pannard, A.; P. Claquin; C. Klein, B. Le Roy and B. Véron. 2008. Short-term variability of the phytoplankton community in coastal ecosystem in response to physical and chemical conditions’ changes. Est. Coast. and Shelf Sci. 80:212–224.
Pawlowicz, R., B. Beardsley, and Lentz, S. 2002. Classical tidal harmonic analysis including error estimates in MATLAB using T_TIDE. Computers and Geosciences, v. 28, p. 929–937.
Percival, D.B. and A.T. Walden. 1993. Spectral analysis for physical applications. Cambridge University Press.
Phlips, E.J., S. Badylak, E. Bledsoe, and M. Cichra. 2006. Factors affecting the distribution of Pyrodinium bahamense var. bahamense in coastal waters of Florida. Mar. Ecol. Prog. Ser. 322: 99-115.
Phlips, E.J., S. Badylak, M. Christman, J. Wolny, J. Brame, J. Garland, L. Hall, J. Hart, J. Landsberg, M. Lasi, J. Lockwood, R. Paperno, D. Scheidt, A. Staples and K. Steidinger. 2011. Scales of temporal and spatial variability in the distribution of harmful algae species in the Indian River Lagoon, Florida, USA. Harmful Algae 10: 277-290.
Phlips, E.J., S. Badylak, S. Youn, and K. Kelley. 2004. The occurrence of potentially toxic dinoflagellates and diatoms in a subtropical lagoon, the Indian River Lagoon, Florida, USA. Harmful Algae 3: 39–49.
Phlips, E.J., S. Badylak, M.A. Lasi, R. Chamberlain, W.C. Green, L.M. Hall, J.A. Hart, J.C. Lockwood, J.D. Miller, L.J. Morris, J.S. Steward. 2015. From red tides to green and brown tides: Bloom dynamics in a restricted subtropical lagoon under shifting climatic conditions. Estuar. Coast. 38(3): 886-904.
San Juan, A. E. and J. G. González. 2000. Distribution of nutrients in the Phosphorescent Bay at La Parguera, on the southwest coast of Puerto Rico. Proceedings of the 51st annual Gulf and Caribbean Fisheries Institute 1: 451-456.
Seixas, C. E. 1988. Patrones de distribución espacial y sucesión temporal en poblaciones de dinoflagelados de la Bahía Fosforescente, Puerto Rico. Ph.D. Thesis, University of Puerto Rico, Mayagüez. 88p.
Seliger, H.H., J.H. Carpenter, M. Loftus, W.H. Biggley and W.D. McElroy. 1971. Bioluminescence and phytoplankton successions in Bahía Fosforescente, Puerto Rico. Limnol. Oceanogr. 16(4): 608-622.
Seliger, H. H., W. G. Fastie, W. R. Taylor, and W. D. McElroy. 1962. Bioluminescence of marine dinoflagellates. I. An underwater photometer for day and night measurements. J. Gen. Physiol. 45: 1003-1017.
Sieracki, C.K., M.E. Sieracki, and C.S. Yentsch. 1998. An imaging-inflow system for automated analysis of marine microplankton. Mar. Ecol. Prog. Ser. 168: 285–296.
Smalley, G.W. and Coats, D.W. 2002. Ecology of the red-tide dinoflagellate Ceratium furca: distribution, mixotrophy, and grazing impact on ciliate populations of Chesapeake Bay. J. Eukaryot. Microbiol. 49:63–73.
Smalley, G.W., D.W. Coats and E.J. Adam. 1999. A new method using microspheres to determine grazing on ciliates by the mixotrophic dinoflagellate Ceratium furca. Aquat. Microb. Ecol. 17:167–79.
Smalley, G.W., D.W. Coats and D.K. Stoecker. 2003. Feeding in the mixotrophic dinoflagellate Ceratium furca is influenced by intracellular nutrient concentrations. Mar. Ecol. Prog. Ser. 262: 137-151.
Smetacek, V. and J.E. Cloern. 2008. On Phytoplankton trends. Science 319: 1346-1348.
Soler-Figueroa, B. M. 2006. Comparación temporal y espacial de factores bióticos y abióticos en la Bahía Bioluminiscente en La Parguera y Puerto Mosquito en Vieques. M.S. Thesis, University of Puerto Rico, Mayagüez. 93p.
Soler-Figueroa, B. M. and E. Otero. 2011. Daily, spatial, and seasonal variability of Pyrodinium bahamense and Ceratium furca at Bahía Fosforescente, La Parguera, Puerto Rico. ASLO Aquatic Sciences Meeting. San Juan, PR 13-18 Feb. 2011. http://www.sgmeet.com/aslo/sanjuan2011/viewabstract2.asp?AbstractID=7714
Soler-Figueroa, B.M. and E. Otero. 2015. The influence of rain regimes and nutrient loading on the abundance of two dinoflagellates species in a tropical bioluminescent bay, Bahía Fosforescente, La Parguera, Puerto Rico. Estuar. Coast. 38: 84-92.
Sweeney, B. M. 1981. Variations in the bioluminescence per cell in dinoflagellates. In Nealson, K. H. (ed.) Bioluminescence Current Perspectives. Burgess Publishing, pp. 90–94.
Usup G., and R.V. Azanza. 1998. Physiology and dynamics of the tropical dinoflagellate Pyrodinium bahamense. In Anderson, D. M., A.D. Cembella and G.M. Hallegraeff (eds.) The physiological ecology of harmful algal blooms. NATO ASI Series, Springer-Verlag, Berlin, pp. 81-94.
Usup, G., A. Ahmada, K. Matsuoka, P. T. Lim, and C. Pin Leaw. 2012. Biology, ecology and bloom dynamics of the toxic marine dinoflagellate Pyrodinium bahamense. Harmful Algae 14: 301-312.
Valiadi, M., S. C. Painter, T. J. Allen, W. M. Balch, and M. D. Iglesias-Rodriguez. 2014. Molecular detection of bioluminescent dinoflagellates in surface waters of the Patagonian Shelf during early austral summer 2008. PLoS ONE 9(6): e98849.
Walker, L. A. 1997. Population dynamics of dinoflagellates in two bioluminescent bays: Bahía Fosforescente and Puerto Mosquito, Vieques. M.S. Thesis University of Puerto Rico, Mayagüez.
