SOUTH EAST QUEENSLAND GREENFIELD MARKET REPORT DECEMBER 2025
About RPM
RPM is at the forefront of the property industry, setting new standards in market intelligence, expertise, and creativity. With a proven track record spanning three decades, our unsurpassed market knowledge and data-driven insights have ensured our partners achieve excellent outcomes, and our clients, exceptional returns.
Our services include:
• Project Sales & Marketing
• Research Data & Insights
• Land Transactions & Advisory
$4B+
55+ Highly respected, trusted development partner
land transactions
100+
Research partner of the Urban Development Institute of Victoria A multi-disciplined team of property experts
40,000+
Lot yield on current projects
Active projects across Queensland, New South Wales and Victoria
A Data Driven, Holistic Approach to Property
RPM’s Research, Data & Insights division provides in-depth analysis on current local and overseas economic and property market conditions. The team consists of economists, property experts, and GIS analysts that provide real-time market intelligence, and analytical and strategic advice.
Our knowledge and expertise are an invaluable resource for RPM’s developer clients, empowering them to make intelligent, informed, and strategic decisions when evaluating residential developments and investment opportunities.
Our data and analysis help clients maximise their marketing efforts and achieve sales targets on their estates. Each month we collect extensive data on approximately 350 estates in Victoria, 180 estates in Queensland and 180 in New South Wales, providing our clients with a comprehensive understanding of the market dynamics. This also underpins the core strategic decision-making of our own business.
We profile every lot including lot size, price, orientation, sqm rate and title status, monitoring through to final sale.
Volume of lots sold
Dollar per sqm rates
Stock release levels
Volume of stock returned to market
Your dedicated research team:
Michael Staedler General Manager Research, Data & Insights
Distribution of lots of a particular size
Distribution of price points
Activity levels by market, product & developer
Stock level fluctuations
Simon Brinkman Research Manager - QLD Research, Data & Insights
This rich data helps our team and clients to better understand:
Megha Saha Research Analyst Research, Data & Insights
Overview
• Queensland’s population growth is outpacing the national average, driven by overseas and interstate migration.
• SEQ housing supply is constrained; rental vacancies are tight, dwelling registrations are falling, and lot supply is at a decade low.
• Higher buyer budgets from recent rate cuts, alongside strong demand and scarce supply, are fuelling sharp price growth.
Queensland’s population growth remains a key driver of housing demand. In the year to March 2025, the state added nearly 99,000 new residents, growing 1.8% and outpacing the national average of 1.6%. Overseas migration continues to lead the way, contributing more than half of the increase, while interstate migration adds another quarter and natural increase accounts for the remainder. While arrivals from overseas have eased from last year, they remain above long term averages, sustaining demand for both rental and owner occupied markets.
Greater Brisbane illustrates the tension between growing demand and limited supply. Rental vacancies are just 0.9%, far below the 3% threshold considered healthy balanced market. New dwelling registrations fell 16% over the year, while established house listings dropped 8%. The housing supply shortage is being amplified by population growth, which is keeping prices elevated and stock turnover constrained.
Building approvals have improved over the year to September 2025. House approvals remain steady, but apartment approvals jumped 26%, signalling confidence in higher density projects despite feasibility pressures due to high construction costs.
Lot supply across SEQ is at the lowest level in more than a decade. Detached lot registrations fell to just over 8,000 in FY25, with Ipswich and Moreton Bay seeing the steepest declines. Annual demand is roughly 34,500 lots, leaving a shortfall of nearly 13,000.
Available stock is concentrated in higher priced segments, leaving many households unable to access entry level lots. Logan, Moreton Bay, and Ipswich are particularly constrained, where stock levels are well below the three month level considered balanced.
People are still moving into SEQ in strong numbers; housing supply is struggling to keep up, and gradual rate cuts have increased purchasers’ serviceability and budgets. As a result, we are seeing more people competing over less stock with more money to spend; with the inevitable result of rising prices. New available lots tend to be priced higher on each release, leaving many buyers waiting on the sidelines.
Clinton Trezise Managing
Opportunities and Risks in SEQ
Daniel Gradwell
Associate Director of Property
Looking at SEQ, what are the biggest risks developers are facing right now?
The main challenge has shifted. A couple of years ago, everyone was worried about construction costs and escalations. Costs are still high, but at least growth has stabilised and become more predictable. The bigger issue now is access to people; builders, contractors, and trades.
There’s enormous competition for resources. The industrial sector is booming, as well as government funded infrastructure, and that’s pulling builders away from residential projects. Both of these options offer attractive work: stable, well funded, and with fewer cost risks. That makes it harder for housing projects to secure the teams they need. From ANZ’s side, we mitigate that through dedicated state based construction managers who understand the local market and can identify risks early, but it’s still a key consideration for developers.
The
industrial sector is booming, as well as government funded infrastructure, and that's pulling builders away from residential projects.
Are there any notable differences in lending appetite between SEQ and regional Queensland?
It really depends on the scale of the regional centre. Markets like the Gold Coast, Sunshine Coast, Cairns, and Townsville still sit within our core appetite. They’re supported by strong population growth and active local economies.
Once you move into smaller, regional markets, it gets tougher. Pre-sales take longer and population growth isn’t as strong, so projects need to demonstrate clear demand. That said, if the fundamentals stack up and pre-sales flow, we’re still active in those areas.
There’s growing interest in prefab and modular housing. How is the finance sector approaching this space?
It’s a bit more complicated, and policies vary between lenders. Some have quite clear frameworks that align modular projects with standard development finance. We’ll definitely see more of this over time, not just because of affordability, but because modular homes can improve productivity.
Construction productivity in Australia has actually been going backwards for years. Prefab homes can help reverse that trend, while also rebuilding a bit of local manufacturing capability. So, it’s not the silver bullet, but it’s a really important piece of the housing supply puzzle.
Population and Housing Demand
Population Growth
98,636
QLD Population Growth - Year to March 2025
Queensland’s population grew 1.8% in the year to March 2025, adding almost 99,000 new residents and outpacing the national average of 1.6%. Growth was supported by a mix of overseas and interstate migration as well as natural increase, underscoring the state’s ongoing appeal for both domestic and international movers.
Net overseas migration remained the dominant driver, contributing just over half of total growth at 55%. Interstate migration added a further 24%, while natural increase accounted for the remaining 20%. Although overseas arrivals have eased, falling 33% from the previous year, they continue to sit above long term averages, reflecting the sustained population momentum underpinning Queensland’s housing and infrastructure demand.
Number of People
LongLong term average: +76,118 pa
Greater Brisbane Housing Supply and Population
Housing availability is falling across new builds, established homes, and rentals while the population continues to grow.
Greater Brisbane’s rental market remains tight, with vacancies at 0.9%, well below the 3% level considered healthy. Supply pressures are intensifying as new dwelling registrations fell 16% and established house listings dropped 8% over FY25.
Strong overseas and interstate migration is driving demand higher, putting further strain on the limited housing stock. Vacancy rates are unlikely to ease unless housing supply grows faster than population.
Greater Brisbane Vacancy Rate - June 2025
Household Purchasing Power
$694,000
Purchaser Capacity* - August 2025
During the post-Covid recovery phase in 2022, a household earning $120,000 could afford a home worth $936,444 at an interest rate of 2.41%. Historically low borrowing costs supported strong credit uptake and household spending.
As inflation accelerated, the RBA tightened monetary policy, reducing borrowing capacity to $621,444 by June 2024 when the standard variable rate reached 6.28%. Since then, gradual rate cuts have improved purchasing power by roughly $72,556, lifting it to around $694,000 at a 5.50% standard variable rate. Higher than anticipated October inflation figures have reduced the likelihood of further interest rate cuts into 2026.
Building Approvals and Land Supply
Queensland Building Approvals
39,605
Total Approvals - Year to September 2025
Building approvals in Queensland have risen over the year to September 2025, led by increases in both houses and apartments. Apartment approvals recorded a 26% annual rise - albeit off a low baseline but this signals a lift in confidence and investment in higher density residential projects.
Source: Australian Bureau of Statistics
SEQ Lot Registrations
At 16,049, lot registrations across SEQ have reached their lowest level in over a decade, down 32% over the past ten years and 11% in FY2025 alone. Historically, the region averaged 21,632 registrations annually, yet current housing demand requires roughly 34,552 new dwellings each year, leaving an annual shortfall of around 12,920 lots.
Source: Queensland Treasury, SEQ Regional Plan & RPM Research, Data & Insights
SEQ Detached Lot Registrations
Lot Registrations by Region
Lot Registrations - FY 2025
Standard Urban Lot* registrations fell to just 8,180 in FY25, the lowest level in a decade. Ipswich and Moreton Bay recorded the largest declines, down 33% and 25% respectively.
The gap between population driven demand and new lot supply points to a structural constraint rather than a short term market shift. Addressing future pressure on affordability and vacancy rates will require faster planning approvals, timely infrastructure delivery, and policies that bring development ready land to market at scale. Without these measures, population growth will be difficult to convert into actual housing supply.
*Standard Urban Lots refer to vacant detached land lots between 60-2,500sqm.
Source: Queensland Treasury
SEQ Available Stock
SEQ Overall Land Supply - At End of Q3 2025 0.87 months
SEQ has faced tight land supply over the past year, with overall stock below one month’s supply, far short of the three months considered a balanced market. Only Brisbane and the Gold Coast LGAs have stock at or above this level, though their median prices for remaining available stock is significantly higher at $920,000 and $1,315,000 respectively. Logan, Moreton Bay, and Ipswich are experiencing particularly acute shortages.
Logan has less than a week’s supply of land lots. The gap between the median sale price of $412,400 and the median price of unsold stock at $565,000 highlights that remaining stock is priced above what many buyers can afford.
Across the region, available land tends to be higher priced, while demand is focused on more affordable segments. This means turnover is constrained not by weak demand but by a shortfall of lots within the price range that aligns with current household borrowing capacity.
Source: RPM Research, Data & Insights
Property Market Trends and Prices
Greater Brisbane Property Prices
Despite these gains, residential land values are generally still considered reasonable relative to median house prices. Median House Price - Q3 2025 $1.03M
Greater Brisbane’s median house price has surpassed $1 million, reaching $1,030,000 in Q3, up 10% over the year. Median land prices rose 19% to $459,250, while unit prices increased 13% to $735,000.
Source: Pricefinder and RPM Research, Data & Insights
House and Land Package Affordability
$966,090
Median land prices have almost doubled since 2021, rising from $245,900 to $459,250, an 87% increase, while build costs have climbed by 52%, reaching $506,840. This brings the total House and Land package price for Greater Brisbane to around $966,090. However, this still sits below the current median established house price of $1,030,000 recorded in Q3. Greater Brisbane House and Land Price - Q3 2025
Source: ABS, Pricefinder and RPM Research, Data & Insights
Brisbane Median Property Price
SEQ Land Market
SEQ Most Common Lot Size - Q3 2025 375sqm
Over the past three years, SEQ’s top selling lot size has been 375sqm; a standard 12.5x30m lot. Lots of 350 and 336sqm are also gaining market share. Overall, most lots sold during this period have ranged between 300 and 600sqm.
SEQ Land Market
SEQ Lot Sales by Price Bracket Share of Sales by LGA
Lots Priced Above $500k - Q3 2025
Land prices across SEQ continued to climb, with 42% of lots sold priced above $500,000 and just 1% below $300,000. Another 36% are priced between $350,000 and $450,000, highlighting tightening affordability.
Moreton Bay remains the top performing LGA, accounting for 32% of sales in Q3. Logan follows with 22% and Ipswich 16%. These areas lead activity due to their high concentration of greenfield development and larger supply of new lots.
Source: RPM Research, Data & Insights
What does a 375sqm lot cost?
Source: RPM Research, Data & Insights - Q3 2025
$479,000
$450,900
Morayfield
Redbank Plains
$485,000
$385,000
$476,000
Narangba
$426,900
Deebing Heights
$415,000
Lilywood
Flagstone
S. Ripley
$581,500
$426,900
$341,700
Banya
Caboolture South
Riverbend
$519,900
$421,000
$637,000
Redland Bay
Greenbank
Ormeau Hills
Median Price by LGA
SEQ land price rose 21% to a median of $474,900.
Source: RPM Research, Data & Insights
Median Size by LGA
median lot size remained unchanged at 420sqm.
Source: RPM Research, Data & Insights
price per sqm rose 21% annually to $1,131/sqm.
Source: RPM Research, Data & Insights
Sales Activity by LGA
Overall, sales volumes have been limited by a shortage of available land rather than a lack of demand.
Source: RPM Research, Data & Insights
SEQ vs. Melbourne Lot Values
With the recent price growth in South East Queensland, the following charts compare how land values have evolved relative to Melbourne, and how each market responded to price escalation through changes in lot size.
Median land prices in SEQ have climbed to $474,900, sitting 19% above Melbourne’s $399,000. The gap in land size however is extensive. As Melbourne's land prices increased from 2016, the median lot size began falling to maintain affordable price points hovering around 350sqm over the past four years. In SEQ however, land sizes have remained relatively flat at 420sqm keeping upward pressure on prices.
Source: RPM Research, Data
SEQ vs. Greater Melbourne 375sqm Lot Value
On a like for like basis, SEQ's 375sqm lot values have nearly caught up with Greater Melbourne, at $421,500 compared with Melbourne’s $425,000. In Q3 2020, both regions were around $266,000. Melbourne’s sharp uplift widened the gap, which SEQ has since closed through sustained growth.
Source: Australian Bureau of Statistics
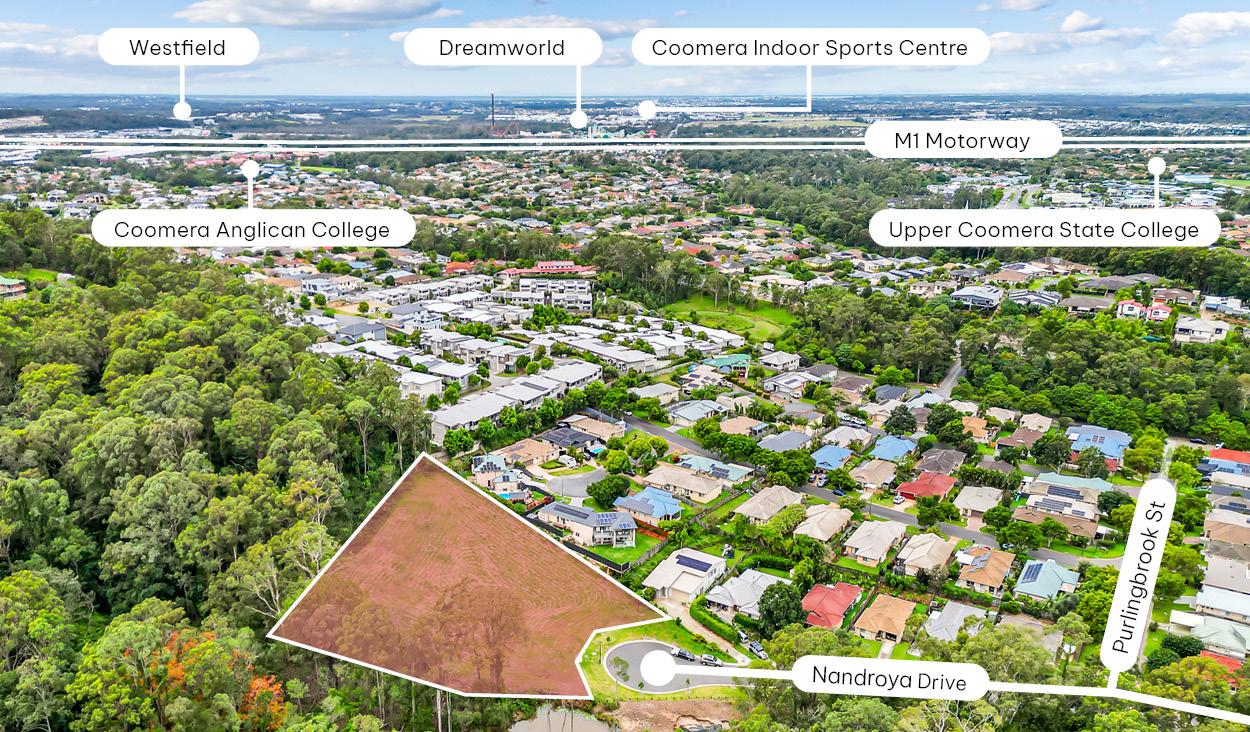
Development Sites
Development Sites
James Matley Sales Director Queensland Transactions & Advisory james@rpmgrp.com.au
The type of development land available is changing. Most of the straightforward, zoned, and serviceable sites have been taken.
Over the past six months, SEQ’s development land market has shifted significantly. What was once seen as a relatively affordable entry point for residential sites versus Victoria and New South Wales is fast changing. End product values and residual land assumptions are now adjusting to a structural undersupply, and the market is truly reflecting that reality.
Across all major SEQ corridors, end lot/product revenues are now consistently breaking $1,000/sqm, and in a growing number of projects this level is being materially exceeded. In our core greenfield markets, this shift in revenue has translated into land economics that have seen developers support acquisitions up to $4,000,000 Per Net Developable Hectare where project fundamentals align, particularly around density, product mix and efficient delivery.
On an implied per-lot basis, this equates to around $200,000+ per lot. We are also tracking an increasing number of transactions clearing approximately $3,000,000 per Net Developable Hectare (around $150,000+ per lot), which only a short time ago represented the upper bound of most groups’ underwriting. The per lot rate is indicative as we are also witnessing a structural re-alignment of target densities and lot sizes within the marketplace, with groups targeting higher yields or reworking Development Approvals to smaller lots.
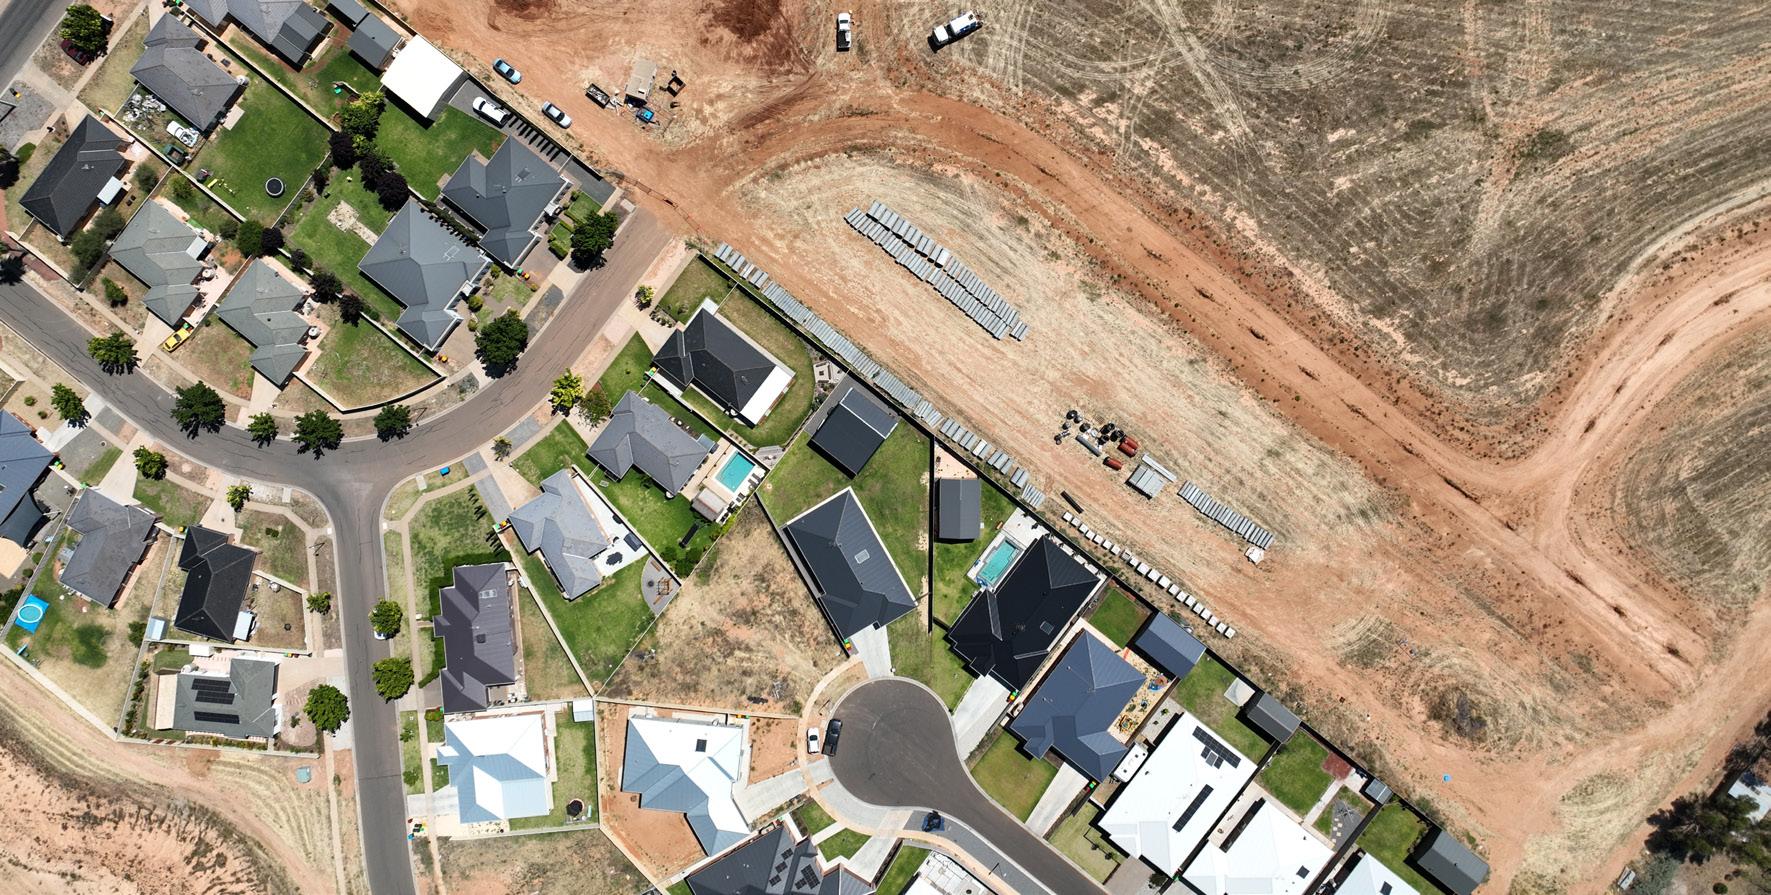
Pictured: 2 Nandroya Drive, Sold by RPM Transactions & Advisory QLD
Development Sites
This is taking place alongside elevated construction and holding costs. Some buyers are struggling to reconcile these new realities with their legacy feasibility models, pausing decisions or under bidding. Those who are well capitalised and confident in their assumptions are moving quickly, capturing the scarce stock that does come to market and moving aggressively on off market opportunities.
The type of land available is changing too. Most of the straightforward, zoned, and serviceable sites have been taken. What remains is most often more complex (e.g. fragmented ownership, servicing challenges, topography, flood risk, environmental overlays, or planning hurdles). This is pushing more capital towards shovel ready projects or sites already part way through the DA process, where timing and exit revenues are clearer and value can be created through optimisation rather than speculation.
Reflecting this, RPM is increasingly aware of and dealing on mandates from groups with substantial ‘dry powder’ seeking to acquire shovel ready or near term opportunities, raw sites, with undeveloped strategy and multi-year programs (3 years plus). Our current exclusive appointment on a 500+ lot development site in the Western Corridor of Ipswich is emblematic of this theme: a large-scale, DA-led opportunity in a highdemand corridor, with pricing expectations calibrated to the new reality of end-product values.
Developers who adjust quickly to this new pricing regime, by recognising both the higher achievable revenues and the scarcity of genuinely developable land, are the ones transacting. Those tied to old benchmarks risk being left behind, even as population growth, limited lot supply, and stronger purchaser capacity continue to underpin land values.
For details on recent transactions or opportunities, contact
James Matley james@rpmgrp.com.au
Headwinds
Affordability
Rising prices have reshaped the landscape for buyers, and Brisbane has emerged as the nation's second highest capital for house values.
Land Availability
Infrastructure, planning complexity, and limited active estates will keep land supply restricted.
Trade Shortages
A growing public sector project pipeline means securing subcontractors and labour is set to become more competitive.
Construction Costs
Construction cost growth is easing but prices are expected to remain elevated and unlikely to fall.
Tailwinds
Stimulus
The $50m Growth Acceleration Fund is one of two new initiatives aimed at unlocking land for housing in fast growing areas.
Population Growth
Queensland is set to see above average population growth in the coming years, supported in part by a large pipeline of construction jobs.
Interest Rates
Borrowing power has improved, but higher inflation figures make further rate cuts into 2026 unlikely.
Australian Dream
Home ownership remains a key goal, keeping the great Australian dream very much alive.
Outlook
Demand continues to outstrip supply for vacant land across all LGAs with less than one months supply across almost all catchments.
Population growth will continue to underpin housing demand in Queensland. Even if overseas arrivals remain below pre-pandemic levels, interstate migration is likely to keep Greater Brisbane’s population growing faster than the national average. That steady influx of new residents will maintain pressure on housing supply, keep vacancy rates low, and place upward pressure on prices.
Housing supply is unlikely to catch up quickly under the current conditions. Detached lot registrations are at historic lows, and approvals are rising only gradually. Developers planning new projects should expect extended delivery timelines and ongoing competition for available land. Infrastructure and planning approvals will be key, especially in high growth LGAs where development ready land is limited; if there are no changes to planning and policy, demand will continue to outpace supply.
Increasing approvals for apartments & townhomes provides some welcomed news however, uptake will remain sensitive to affordability, with a household earning $120,000 currently able to borrow around $694,000 at a 5.5% standard variable rate. Any change in interest rates could shift purchasing power and influence which segments of the market remain accessible. Developers targeting entry level buyers will need to design and price their products accordingly.
Land prices are likely to continue rising, though growth may moderate from the sharp increases seen in FY25. While the median lot sizes remain steady, we expect headline median prices to continue to increase.
Looking ahead, demand is set to remain strong, land will continue to be scarce, and timing will be critical. It will be more important than ever to understand how supply constraints shape pricing, and plan for product types to meet future demand.
Clinton Trezise
Managing Director
Queensland & New South Wales clinton@rpmgrp.com.au
Peter Neale
Managing Director
Queensland & New South Wales petern@rpmgrp.com.au
For more information, please visit: www.rpmgrp.com.au
For a detailed market analysis or a tailored report, email the team at: contactus@rpmgrp.com.au
RPM’s SEQ Team
Project Sales & Marketing
Clinton Trezise
Managing Director
Queensland & New South Wales clinton@rpmgrp.com.au
Research, Data & Insights
Michael Staedler
General Manager
Research, Data & Insights m.staedler@rpmgrp.com.au