VIC

Q2 2025
VICTORIA GREENFIELD MARKET REPORT

Q2 2025

Luke Kelly
National Managing Director Built Form
luke@rpmgrp.com.au
• Confidence has improved through Q2 due to February and May rate cuts.
• Construction costs remain a challenge due to labour shortages.
• Townhomes are at the centre of rising demand from multiple buyer segments.
• The pace of PSP approvals must lift if we are to meet housing targets.
After several challenging years, Victoria’s greenfield market is showing clear signs of a sustained recovery. Two rate cuts in February and May, combined with last year’s tax cut, have eased borrowing constraints and are steadily reigniting buyer confidence.
Lot sales across Melbourne and Geelong surged 48% in Q2 2025 to its highest quarterly level in three years, while auction clearance rates in Melbourne sit at an 18-month high. As ANZ’s Daniel Gradwell notes in this quarter’s feature interview, confidence has been the missing ingredient in recent years and is now starting to return.
That said, it’s not all smooth sailing; construction costs remain a key challenge. While material costs have stabilised, elevated labour costs are keeping overall construction costs high.
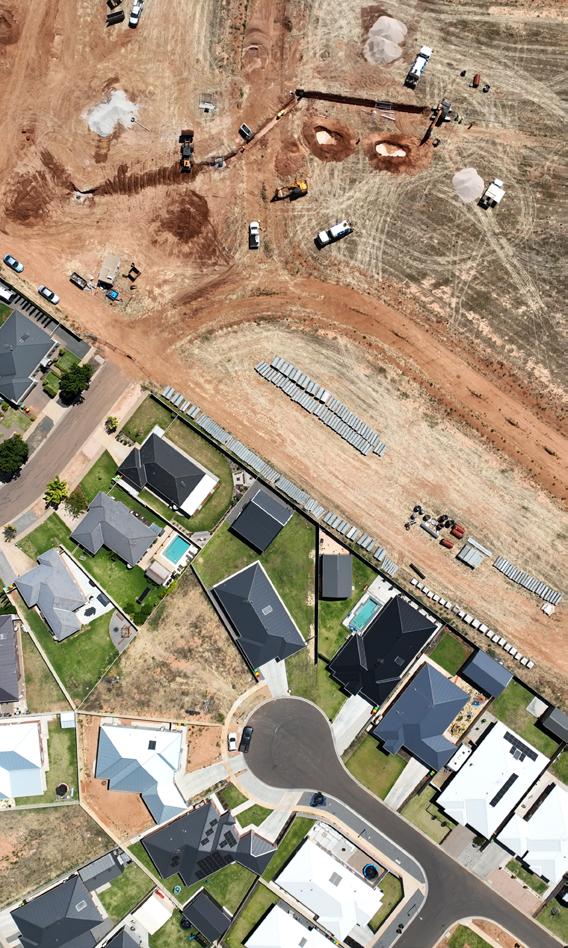
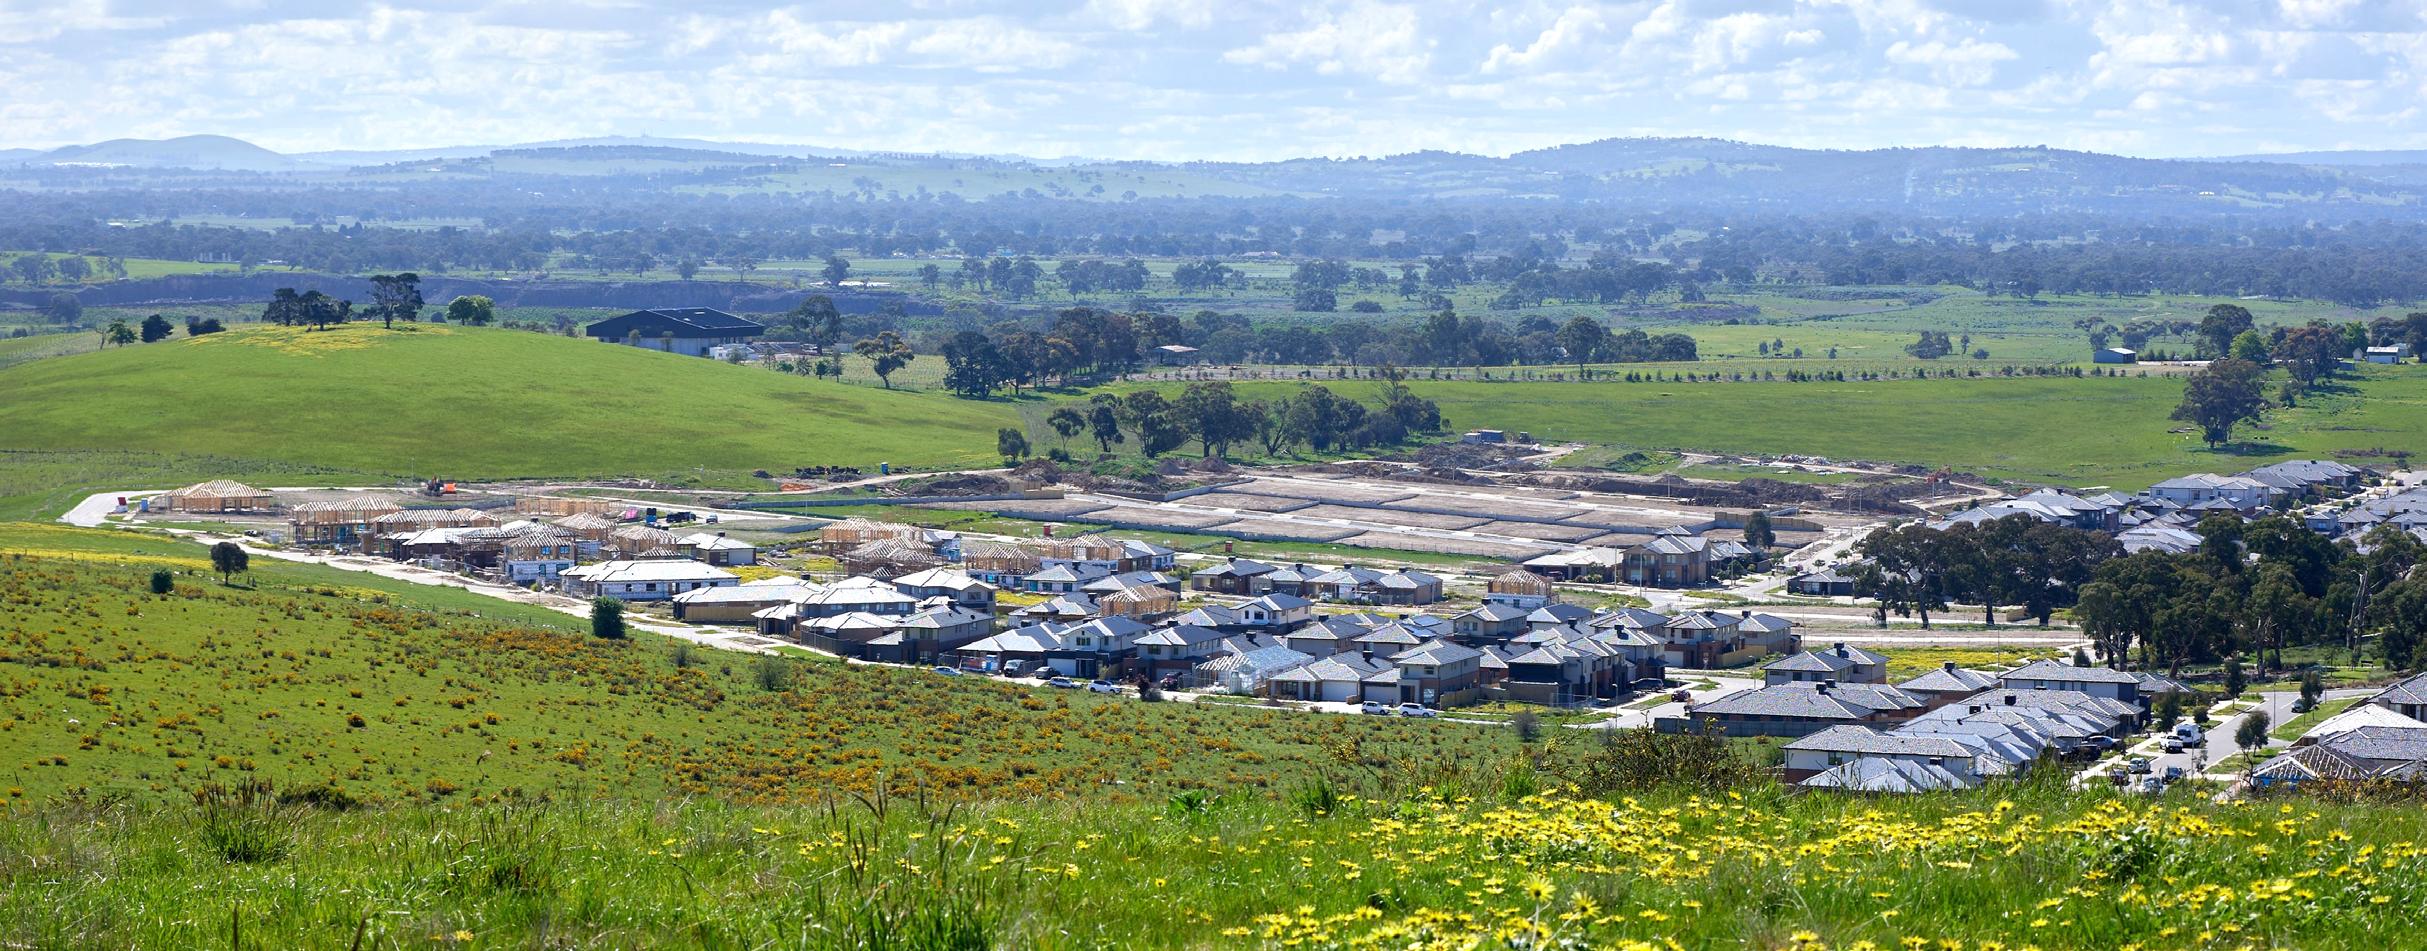
On the supply side, planning certainty is unlocking major long term opportunities. The long awaited Beveridge North West PSP, promising to deliver 15,000 homes, eight schools, and 80 hectares of open space, is a milestone for the northern corridor, joining other priority precincts such as Clyde South, Derrimut Fields, and Merrifield North.
Yet, PSP approvals have slowed to one or two per year, well below the 10-a-year pace seen in the mid-2010s. Faster, more efficient delivery will be essential if Victoria is to meet its housing targets.
Against this backdrop, greenfield townhomes are playing a bigger role in bridging the gap for budget conscious buyers and investors alike. We’re also seeing the return of previously sidelined buyer groups, including single parents, second home buyers, and lower income households who are reentering the fold following the rate cuts.
All at once, townhomes and smaller detached homes have come into focus for interstate investors, owner occupiers, and builders –placing this product firmly at the centre of multiple tightening force.
This quarter’s report explores these and other dynamics in detail. It unpacks the latest data and sentiment shifts shaping the Victorian greenfield market. We hope it provides a clear view of where demand is heading, what buyers are seeking, and how the industry is adjusting as confidence makes a steady return.
For more information, please visit: www.rpmgrp.com.au
For a detailed market analysis or a tailored report, email the team at: contactus@rpmgrp.com.au

A slowing economy has resulted in the cash rate moving towards stimulus levels.

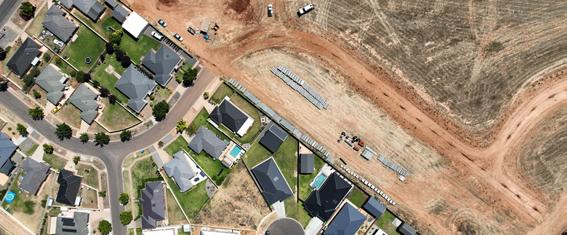
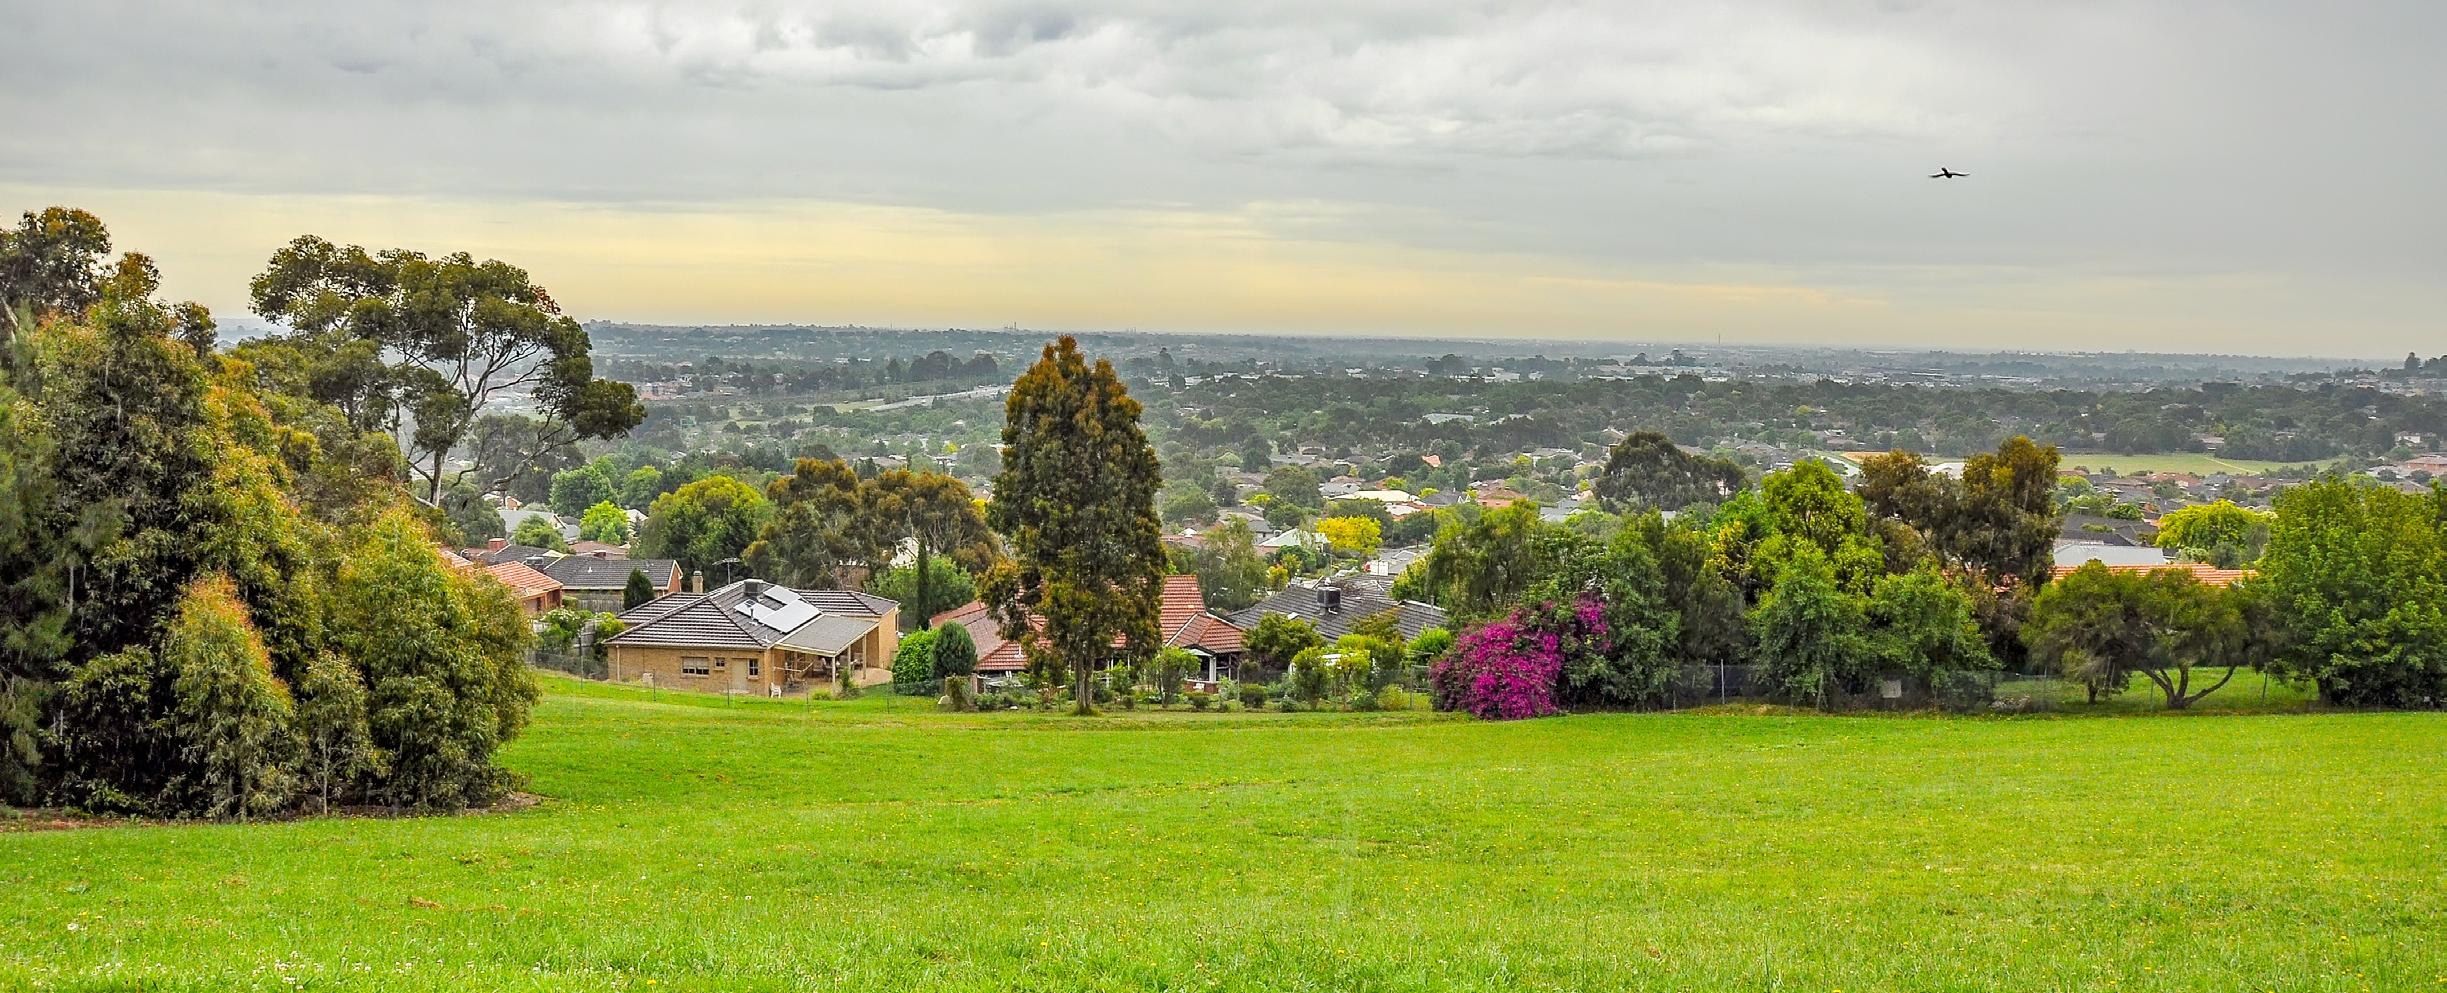
Momentum returned to Melbourne and Geelong new home market, with sales jumping 48% as rate cuts and incentives reignite demand.
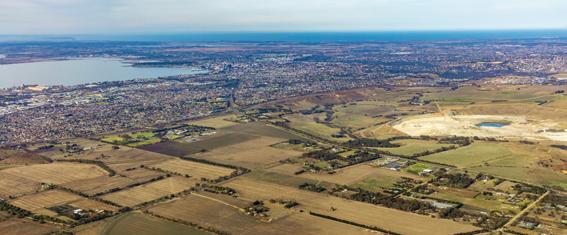
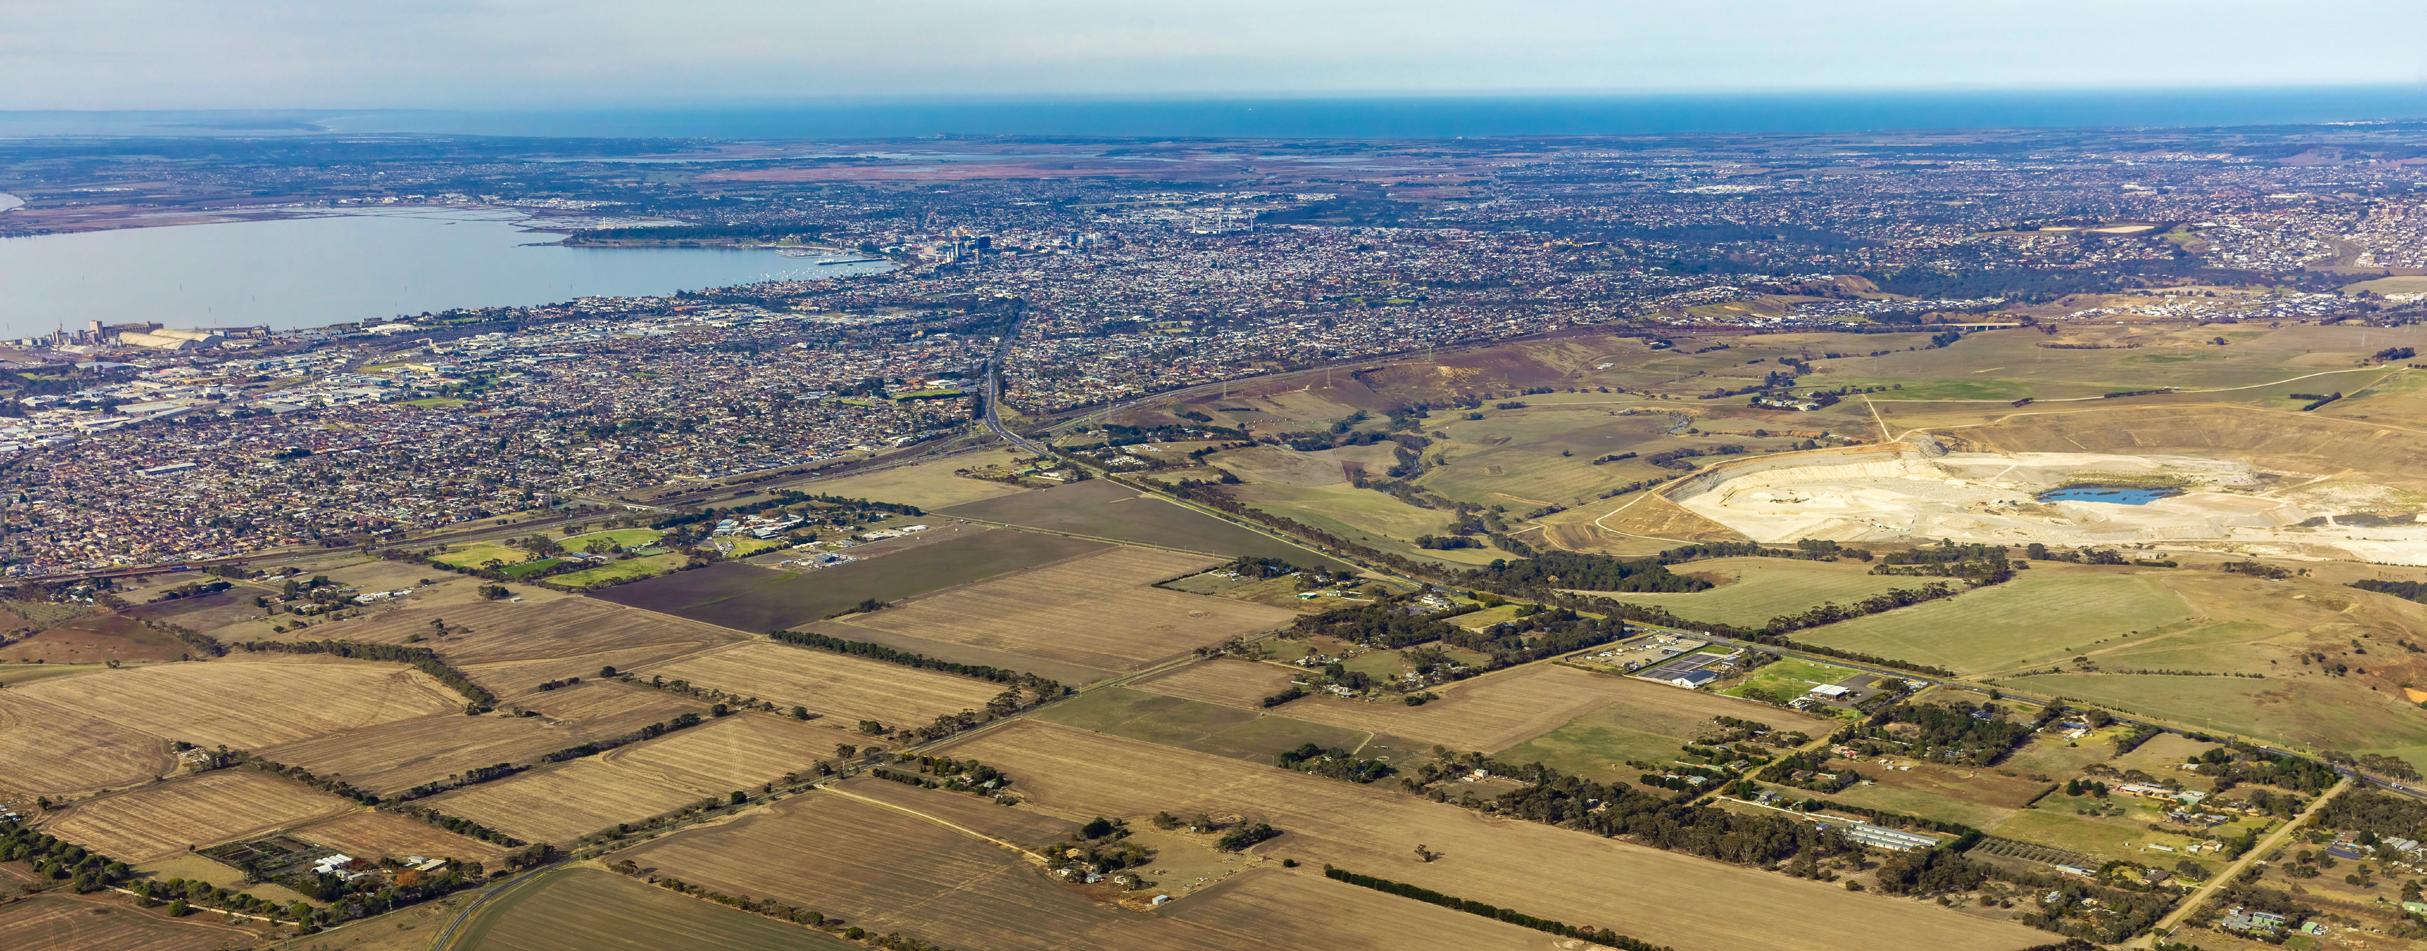
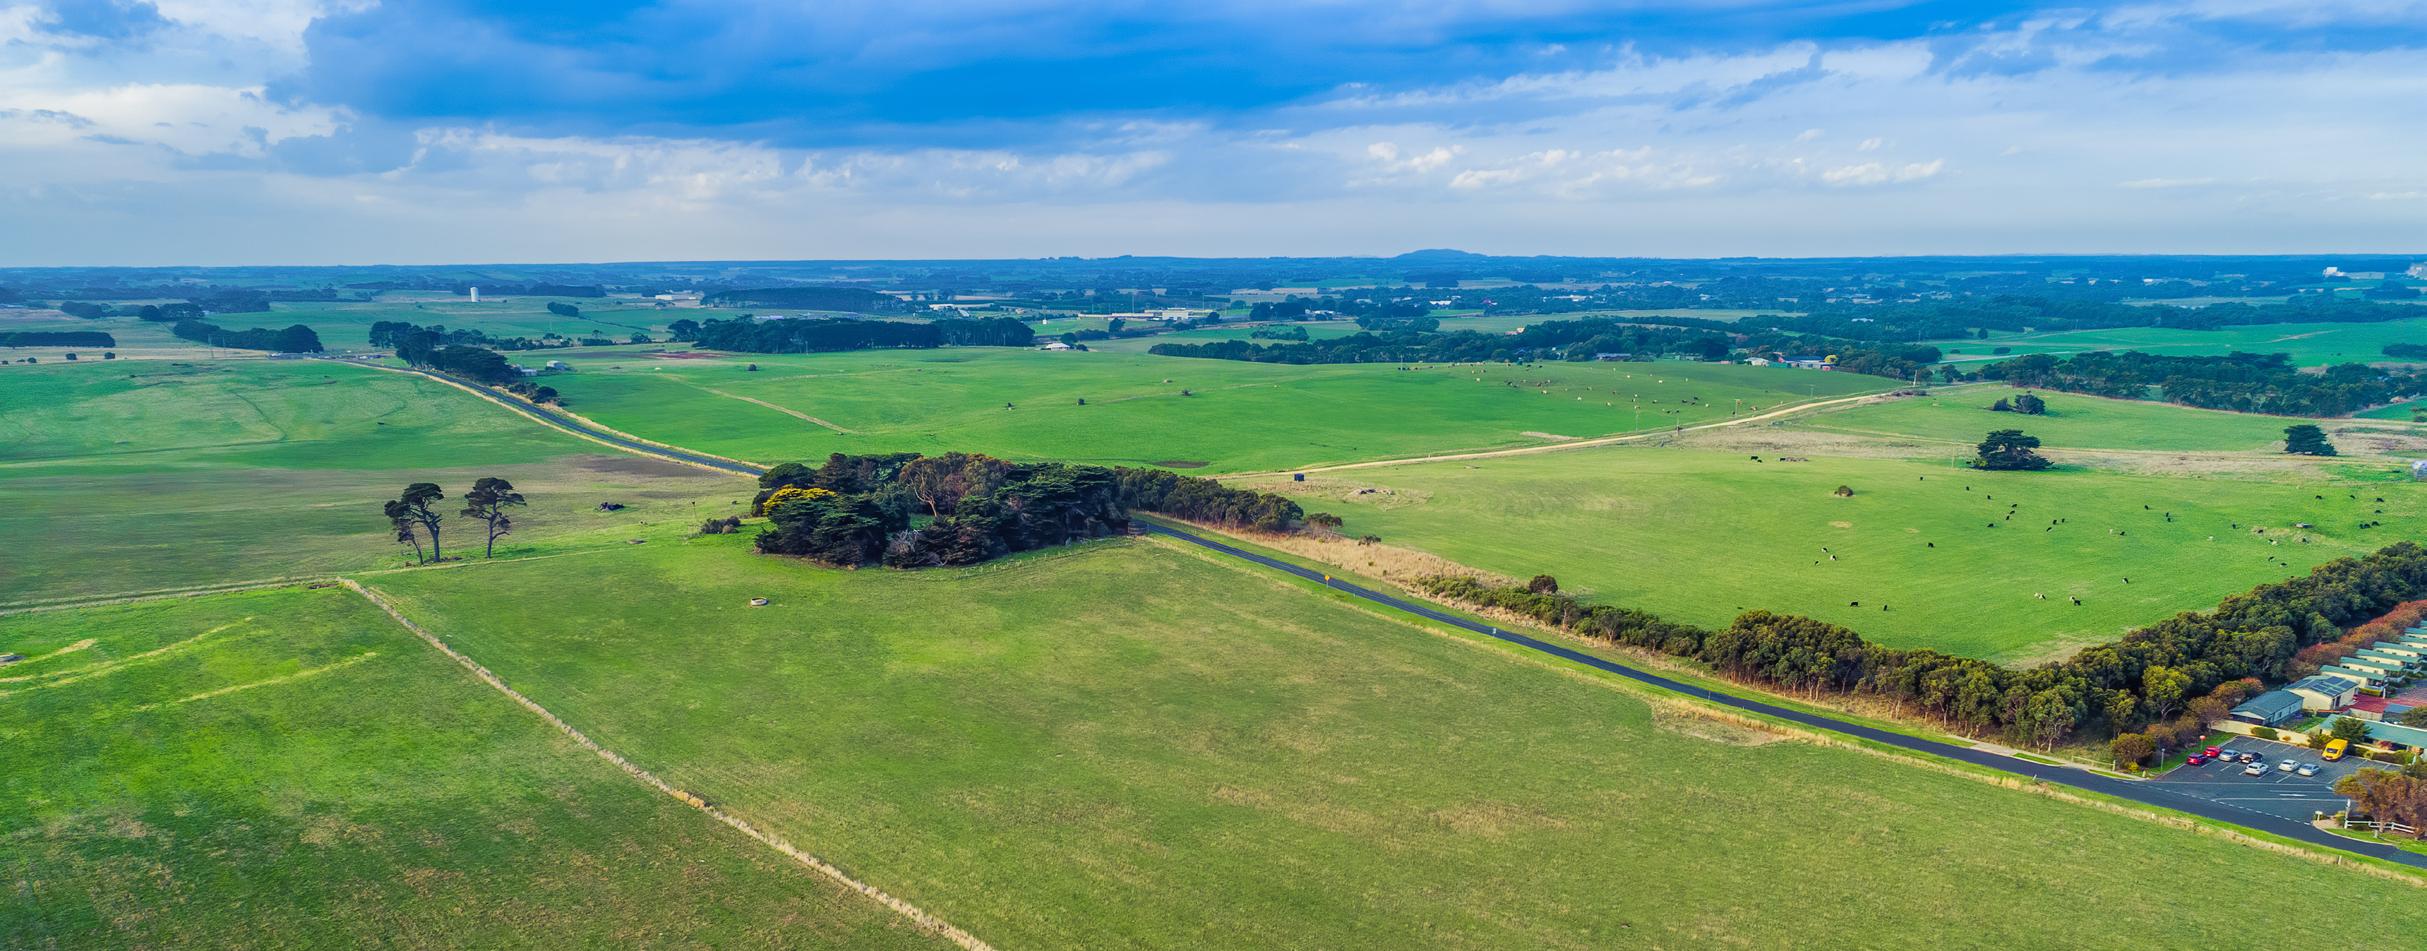
Affordability remains the backbone of the regional market’s resilience, helping to attract relocating metropolitan buyers and local purchasers.
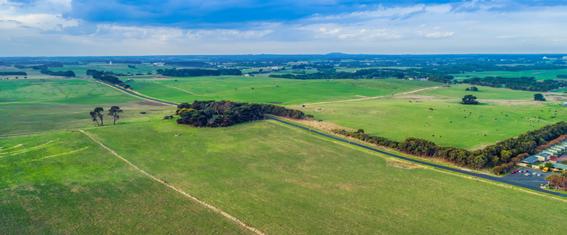
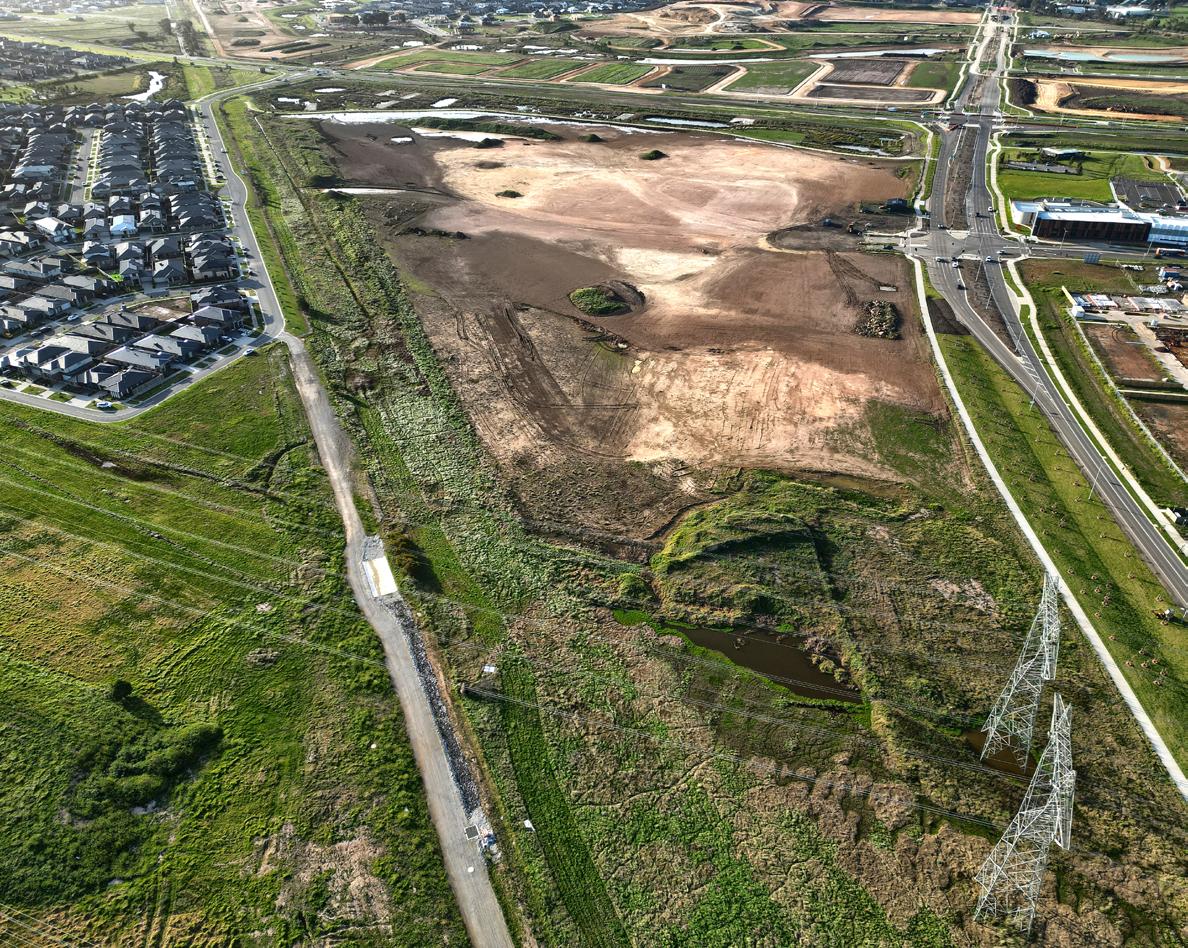
Beveridge North West showcases both the potential of well planned greenfield communities and the importance of efficient PSP delivery.
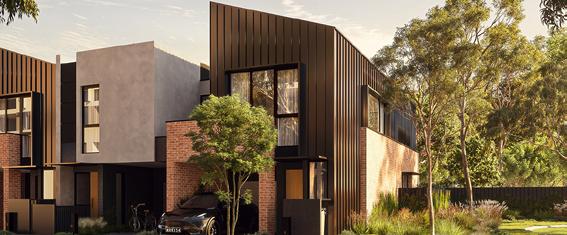
The convergence of multiple buyer groups is expected to keep upward pressure on townhome supply in the near term.
RPM’s Research, Data & Insights division provides indepth analysis on current local and overseas economic and property market conditions. The team consists of economists, property experts, and GIS analysts that provide real-time market intelligence, and analytical and strategic advice.
Our knowledge and expertise are an invaluable resource for RPM’s developer clients, empowering them to make intelligent, informed, and strategic decisions when evaluating residential developments and investment opportunities.
Our data and analysis help clients maximise their marketing efforts and achieve sales targets on their estates. Each month we collect extensive data on approximately 350 estates in Victoria, 140 estates in Queensland and 180 in New South Wales, providing our clients with a comprehensive understanding of the market dynamics. This also underpins the core strategic decision-making of our own business.
We profile every lot including lot size, price, orientation, sqm rate and title status, monitoring through to final sale.
Your dedicated research team:

Michael Staedler General Manager
Research, Data & Insights

Andrew Raponi
Senior Research Manager
Research, Data & Insights

Research Manager
Research, Data & Insights

Daniel Gradwell
Associate Director of Property
How are rebates and incentives factored into project financing?
We look through rebates and incentives whether from developers or governments. A good example is the HomeBuilder Grant; we were happy to finance projects supported by it, as was the broader industry.
HomeBuilder was interesting because it brought forward a lot of demand that already existed, especially in Melbourne greenfield projects. We saw a spike, followed by a gap. But overall, it didn’t fundamentally change the supply-demand equation, just the timing.
Incentives and rebates are fine, provided there’s underlying demand and the market isn’t entirely incentive-driven. If the market was completely reliant on incentives, we would start questioning valuations for future stages. But we haven’t seen anything alarming. It’s a cyclical industry but supply is still turning over at a decent pace. That gives us comfort that there’s still genuine demand.
ANZ Associate Director of Property Daniel Gradwell shares his take on how rebates influence financing decisions, what is driving price resilience, and construction cost pressures.
Have incentives affected settlement risk or valuations at the purchaser level?
Settlements are generally tracking fine. There may be isolated cases falling through, but nothing widespread.
At a macro level, Victoria’s unemployment rate is basically where it was a year ago, with 80,000 more people in work and that’s reassuring.
If unemployment were rising, we would be more concerned about settlement risk, but that’s not what we’re seeing. Over the past couple of years, even through the rate hiking cycle, settlement activity has held up well.
At a ground level, some fall overs are inevitable, but they remain low in number – which is positive. One thing we are watching is the timing of delivery; making sure stages are built and delivered before sunset clauses become an issue. That’s particularly important given ongoing construction industry challenges.
Build timeframes for detached houses have definitely stretched from around 6-8 months to now 9-12 months post Covid, and pre-development works have been impacted as well. Sunset clause issues aren’t widespread, but delays are something we’re monitoring closely.

What is contributing to continued delays in construction timeframes?
Delays are still happening but it’s not just because of housing demand. Major government-funded infrastructure projects are creating strong competition for labour. This is particularly true in Victoria.
Governments can pay more than private developers, so they’re attracting the trades and contractors. Engineering construction in Australia is up about 30% over the last decade. So even though we’ve got materials supply sorted, which was the main issue five years ago, we don’t have enough workers.
It’s not just a metro issue but the pressure is definitely concentrated around Melbourne’s middle and outer suburbs. Younger workers from the regions are also moving into the city to follow that infrastructure work, which adds to the labour crunch in the regions.
So, while building approvals are lower than during the HomeBuilder boom, timeframes are still lagging. It’s not because of demand, but because we’re trying to build everything – roads, rail, homes – at the same time with limited labour.
Is there still upward pressure on construction costs?
Absolutely. Material prices have stabilised, they’re not rising 10-15% year on year like they were, but they’ve settled at a higher level and aren’t coming back down.
The real issue, as mentioned, is labour. It’s still a huge component of construction cost, and there just isn’t enough of it. Workers have options. They can pick when and where they want to work, and that really squeezes the private housing sector.
How have the recent tax cuts and two interest rate reductions impacted borrowing capacity?
As a rule of thumb, for a standard owner occupier, a 1% movement in interest rate changes borrowing capacity by about 10%. With 50 basis points of cuts so far, that’s roughly a 5% uplift.
At ANZ, we’re expecting two more cuts this year. So, a full 100 basis points in total. That would bring about a 10% improvement in borrowing power.
It doesn’t take us back to 2021 levels, when rates were at record lows, but it’s a noticeable boost.
Have you seen an increase in loan enquiries since the recent rate cuts?
Yes, since around March or April this year, there has been a noticeable uplift in loan enquiries.
Auction clearance rates in Melbourne and Sydney are now at their highest levels in about 18 months. That’s important because these two cities have a high proportion of auction activity, and clearance rates are a good barometer of buyer confidence.
If we get two more rate cuts later this year, I think we’ll see even more momentum.
Confidence has been the missing ingredient in Melbourne for some time; not just in the housing market, but in the broader economy. Covid had a lingering effect, but these rate cuts could help bring some of that confidence back, support growth, and underpin stronger housing activity.
Has the finance approval process improved for purchasers?
Yes, it’s improved quite a lot. There’s strong competition in the finance sector; big banks, smaller banks, and even non-bank lenders are all playing their part.
Everyone is chasing mortgage growth. That’s led to faster turnaround times, better pricing, and more choice for borrowers. When we’ve seen rate cuts, like the two this year, banks have passed them on quickly, which reflects the competitive market.
It’s been a meaningful improvement compared to where things were in recent years.
Prices for development site land remain strong. Does that reflect optimism in the new home sector?
Definitely. Even though greenfield prices are elevated, it’s still one of the more affordable parts of the market, and that’s a big selling point.
We’re still seeing demand with enquiries, deposits, and presales ticking over. When you combine that with Victoria’s strong population growth, a resilient labour market, and rate cuts improving affordability, it paints a pretty positive picture.
However, construction delays and labour shortages are limiting how quickly we can bring new products to market. That’s likely to put a floor under prices.
We’re not forecasting a boom like Queensland experienced recently, but I do think we’ve turned a corner. Confidence is starting to return, and the outlook over the next couple of years looks more positive than it has been in a long time.

Tim Hyland
National Strategy Manager
Transactions
& Advisory
tim@rpmgrp.com.au
After years of anticipation, the Beveridge North West PSP has finally been approved, unlocking one of Melbourne’s most significant growth opportunities in the northern corridor.
For some landowners and developers, this moment has been more than 15 years in the making. With the PSP now in place, work can begin to shape a new community of 15,000 new homes, eight schools, and nearly 80 hectares of parks and sports fields. Major developers in this PSP include YourLand and Resimax, who have purchased land in recent years, along with a large tract of land owned by Yarra Valley Water, whose holding will form the centrepiece of the precinct.
The milestone arrives as momentum is building across the state’s long term greenfield plan. In recent months, Clyde South, Derrimut Fields, and Merrifield North have all been earmarked to commence in 2025-26. These precincts span both residential and employment uses, reflecting a broader approach to growth that balances housing supply with local employment opportunities.
Beveridge North West showcases both the potential of well planned greenfield communities and the importance of efficient PSP delivery.
Across these priority precincts, land values have begun to rise and deal terms are sharpening as developers act on the stronger sense of certainty around timing and delivery. Behind the scenes, landowners are moving to position their holdings to capture this upswing, guided by research backed advice from RPM Group to help navigate the complex mix of planning, infrastructure, and market dynamics.
Immigration driven population growth is placing sustained pressure on housing and PSP delivery is critical to ensure supply keeps pace.
The state’s target of 180,000 new greenfield homes over the next decade will rely on precincts like Beveridge North West moving from plan to reality without unnecessary delays. Affordable housing, local employment, and timely infrastructure all depend on it.
Yet, the reality with approvals has slowed dramatically. In the mid 2010s, Victoria’s Planning Authority regularly delivered up to 10 PSPs a year. Over the past five years, that figure has fallen to one or two annually.
Additionally, the cost of bringing each PSP to life has soared from around $700,000 to nearly $6 million. This steep 750% increase reflects declining government productivity and growing complexity in land servicing. Developers argue the bottleneck is causing inflated holding costs, constrained supply, and deepening affordability pressures.
Beveridge North West demonstrates the potential of well planned greenfield communities to meet the state’s growth needs, but also highlights the importance of consistent, efficient PSP delivery.
If Victoria is to meet its housing targets, the pace of PSP approvals must lift. Every delay leaves housing demand running further ahead of supply.

Luke Kelly
National Managing Director Built Form
luke@rpmgrp.com.au
The convergence of multiple buyer groups is expected to keep upward pressure on townhome supply in the near term.
Townhomes are fast becoming a key lever in Melboure’s greenfield market, as affordability shifts and buyer priorities realign.
The mix of interstate investor interest, emerging owner occupier affordability windows, and builder appetite for pipeline security has placed townhomes at the centre of multiple tightening forces.
Interstate investors who were once focused on Adelaide, Perth, and Brisbane are now increasingly eyeing Melbourne where the all dwellings median price sits at $803k, compared to $840k, $831k, and $934k respectively. This price gap is drawing investor capital back into Victora, particularly from those working within more defined borrowing limits.
With the average investor loan at approximately $673k nationally, and assuming a 5% deposit, budgets typically fall at or under $700k. This aligns closely with many medium density offerings in greenfield estates. A typical package might include a 150sqm lot priced between $200k-$250k and a townhouse build of $380K, delivering a complete turnkey package well within an investors budget at between $580k - $630k.
This townhome demand extends well beyond investors.
Easing interest rates are quietly reshaping owner occupier demand. For dual income first home buyers earning between $100,000-$110,000, the August rate cut and potential cut in November 2025 could lift purchasing capacity into the $590k-$622k range, making greenfield townhomes newly accessible.
Buyer segments that have been less visible in recent years, including single parents and budget conscious second home buyers, are also beginning to reemerge as affordability improves.
Even modest increases in borrowing power can translate to tens of thousands of dollars in additional capacity, nudging more households back within reach of townhome price points.
Builders are already acting ahead of a full retail recovery, securing small lots and medium density stock to maintain supply pipelines. This is taking place well before sentiment and activity have returned at scale across the broader market.
The intersection of these buyer groups is likely to place sustained pressure on townhome supply over the near future. In response, developers across the greenfield sector are reviewing land use strategies, rebalancing product mix, and securing planning flexibility to capture this evolving demand.
By year’s end, townhomes are increasingly likely to emerge as the strategic response to Melbourne’s housing affordability and demand inflection point.


Rod Anderson
National Managing Director Communities rod@rpmgrp.com.au
Momentum returned to Melbourne and Geelong’s new home market in Q2 2025, with gross lot sales climbing to their highest level in three years.
A total of 3,156 lots were sold across the growth corridors; a 48% jump on the previous quarter and 36% higher than the same time last year. While still 25% below the decade average of 4,183 sales per quarter, the scale and breadth of this recovery marks a significant step forward.
A key catalyst has been improving buyer confidence. The RBA’s 25 basis point rate cut in May built on February’s cut, adding to the boost in borrowing capacity already delivered by the July 2024 tax cuts. Together, these fiscal and monetary adjustments have helped ease the affordability pressures that have weighed heavily on new home demand in recent years.
Sales were also lifted by a strong appetite for titled and near-titled lots, which made up 59% of all sales
Momentum returned to Melbourne and Geelong new home market, with sales jumping 48% as rate cuts and incentives reignite demand.
in the quarter. Many of these blocks were offered with rebates and discounts, creating an incentive for buyers ready to move quickly. But because this segment tends to include older stock, it has also contributed to a slight increase in average selling time. Lots took an average of 190 days (just over six months) to sell in Q2.
Median lot size, which had temporarily lifted earlier this year, has now returned to its long-standing level of 350sqm. The 1.7% reduction in size translated to a 1.3% drop in median price, which fell to $393,000.
Despite the improved buyer activity, total market stock edged up slightly over the quarter to an estimated 6,178 lots. New releases climbed by 27% to 2,354 lots, the highest volume of quarterly supply since Q3 2022. Returned stock also rose, up 11% to 832 lots. While some risk around settlement persists (particularly tied to past shifts in borrowing capacity and construction costs) cancellation volumes remain well below the peaks seen in 2019 and 2020.
We survey all buyers on RPM managed estates in the greenfield market. The following illustrates demographic and purchase intent amongst all purchasers over Q2 2025. For a detailed analysis of any corridor, LGA, or suburb in Victoria, please contact our Research, Data & Insights team.
contactus@rpmgrp.com.au
$650-700k
$600-650k
$550-600k
$500-550k
$450-500k
$400-450k
Source: RPM Research, Data & Insights
Buyer activity in the Western corridor rose 28% in Q2 2025, with 1,045 lots sold, which is up from 817 last quarter.
Gains were almost entirely driven by Wyndham, as sales in Melton and Moorabool remained flat. Despite the lift, this remains Melbourne’s softestperforming corridor.
Stock is also moving slower, with average trading days rising to 189, marking the highest of all growth areas. Moorabool continues to record the longest selling times.
New lot supply in the Western corridor rose 8% in Q2 2025, with 679 new releases; which is largely in line with this time last year.
Most of the increase came from Wyndham, where supply hit its highest level since Q2 2022, supported by more active estates.
Returned stock climbed to 350 lots, largely driven by Melton, while Wyndham saw fewer cancellations, helping stabilise the overall market.
Combined with new releases, Wyndham’s supply to sales ratio sits at 98%, indicating a mild tightening in available stock despite the recent uplift in sales.
The median lot price in the Western corridor edged up to $384,000 in Q2 2025. This is a modest 0.3% rise from the previous quarter and 2% year on year.
Moorabool led the gains, with a $15,000 lift in its median, driven by larger lot sizes. This shift also pushed the corridor’s median lot size to 353sqm, marking its first increase since Q3 2022.
Buyer activity surged in the Northern corridor in Q2 2025, with lot sales up 59% to 996. All four municipalities contributed, led by strong results in Whittlesea.
The uplift increased the corridor’s share of Melbourne’s greenfield sales to 35%, bringing it close to its 10-year quarterly average. Despite the jump in demand, average time on market held steady at 158 days, still near peak levels.
Lot supply across the Northern corridor rose by 1,033 lots in Q2 2025, made up of 772 new releases and 261 returned lots. Most of the uplift came from Hume and Whittlesea, while supply in Sunbury declined.
Active estates increased from 60 to 63; the highest count in the medium term. With supply outpacing demand, the supply to sales ratio reached 104%.
Source: RPM Research, Data & Insights
The median lot price in the Northern corridor fell to $373,000 in Q2 2025, marking a 3% quarterly decline and the largest drop across Melbourne’s growth corridors. The fall was driven by smaller lot sizes in Hume and Whittlesea, which pulled the corridor’s median lot size back to 350sqm, reversing last quarter’s temporary lift.
Despite the price drop, Hume remains the corridor’s most expensive sub-market, with its median holding firm at $403,000.
The South East corridor recorded the strongest lift in buyer activity in Q2 2025, with gross lot sales rising to 788; a 65% quarterly jump and 45% higher year on year. It’s the corridor’s best result since Q2 2022, driven by solid gains in both Casey and Cardinia. The surge also lifted the corridor’s share of Melbourne greenfield sales to 28%, up from 25% in Q1.
However, average trading days rose to 176, which is the highest on record for the corridor. Cardinia continues to lag, with selling times double those in Casey and second only to Moorabool across Greater Melbourne.
New lot supply in the South East Corridor rose 22% in Q2 2025 with 579 new releases, the highest quarterly figure since Q2 2022 and 31% above the same time last year. The increase was driven by two new estate launches in Casey, lifting the number of active estates to 55.
Returned stock fell 24% over the quarter, with 135 lots coming back to market. This return to medium term average levels has helped ease supply pressures. Overall, total stock tightened, with the supply ratio falling to 91%.
Source: RPM Research, Data & Insights
Median lot prices in the South East fell 2% in Q2 2025 to $440,000, though it remains Victoria’s most expensive vacant land market. The price drop aligned with a 4% decline in median lot size to 359sqm, reflecting continued demand for more compact, affordable land as buyers remain highly cost conscious.

Sales activity in Greater Geelong picked up sharply in Q2 2025 with 327 gross lot sales. This is up 60% on the previous quarter and 88% higher than a year ago. The uplift was driven by strong buyer interest in Armstrong Creek and Lara.
Despite the rebound Geelong’s market share remains modest at 10%, as other growth areas also recorded solid gains.
Lots sold during the quarter spent an average of 320 days on market, the highest across all regions. Bellarine stock continues to take the longest to sell.
Greater Geelong saw one new estate launch in Q2 2025, bringing the total number of active estates to 37. New lot releases surged from just 63 in Q1 to 324; the highest level since Q3 2022. Returned stock held steady at 86 lots.
Together, new and returned stock totalled 410 lots for the quarter. With most of the increase driven by new product, the supply to sale ratio rose to 125%.
Source: RPM Research, Data & Insights
The Geelong Growth corridor recorded a slight decline in both median lot size and price in Q2 2025. Median lot size fell to 394sqm, while the median price eased to $380,000.
The shift was led by the Geelong LGA sub market, reflecting a clear trend toward smaller, more affordable lots as buyers remain focused on value.

Michael Staedler
General Manager
Research,
Data & Insights
m.staedler@rpmgrp.com.au
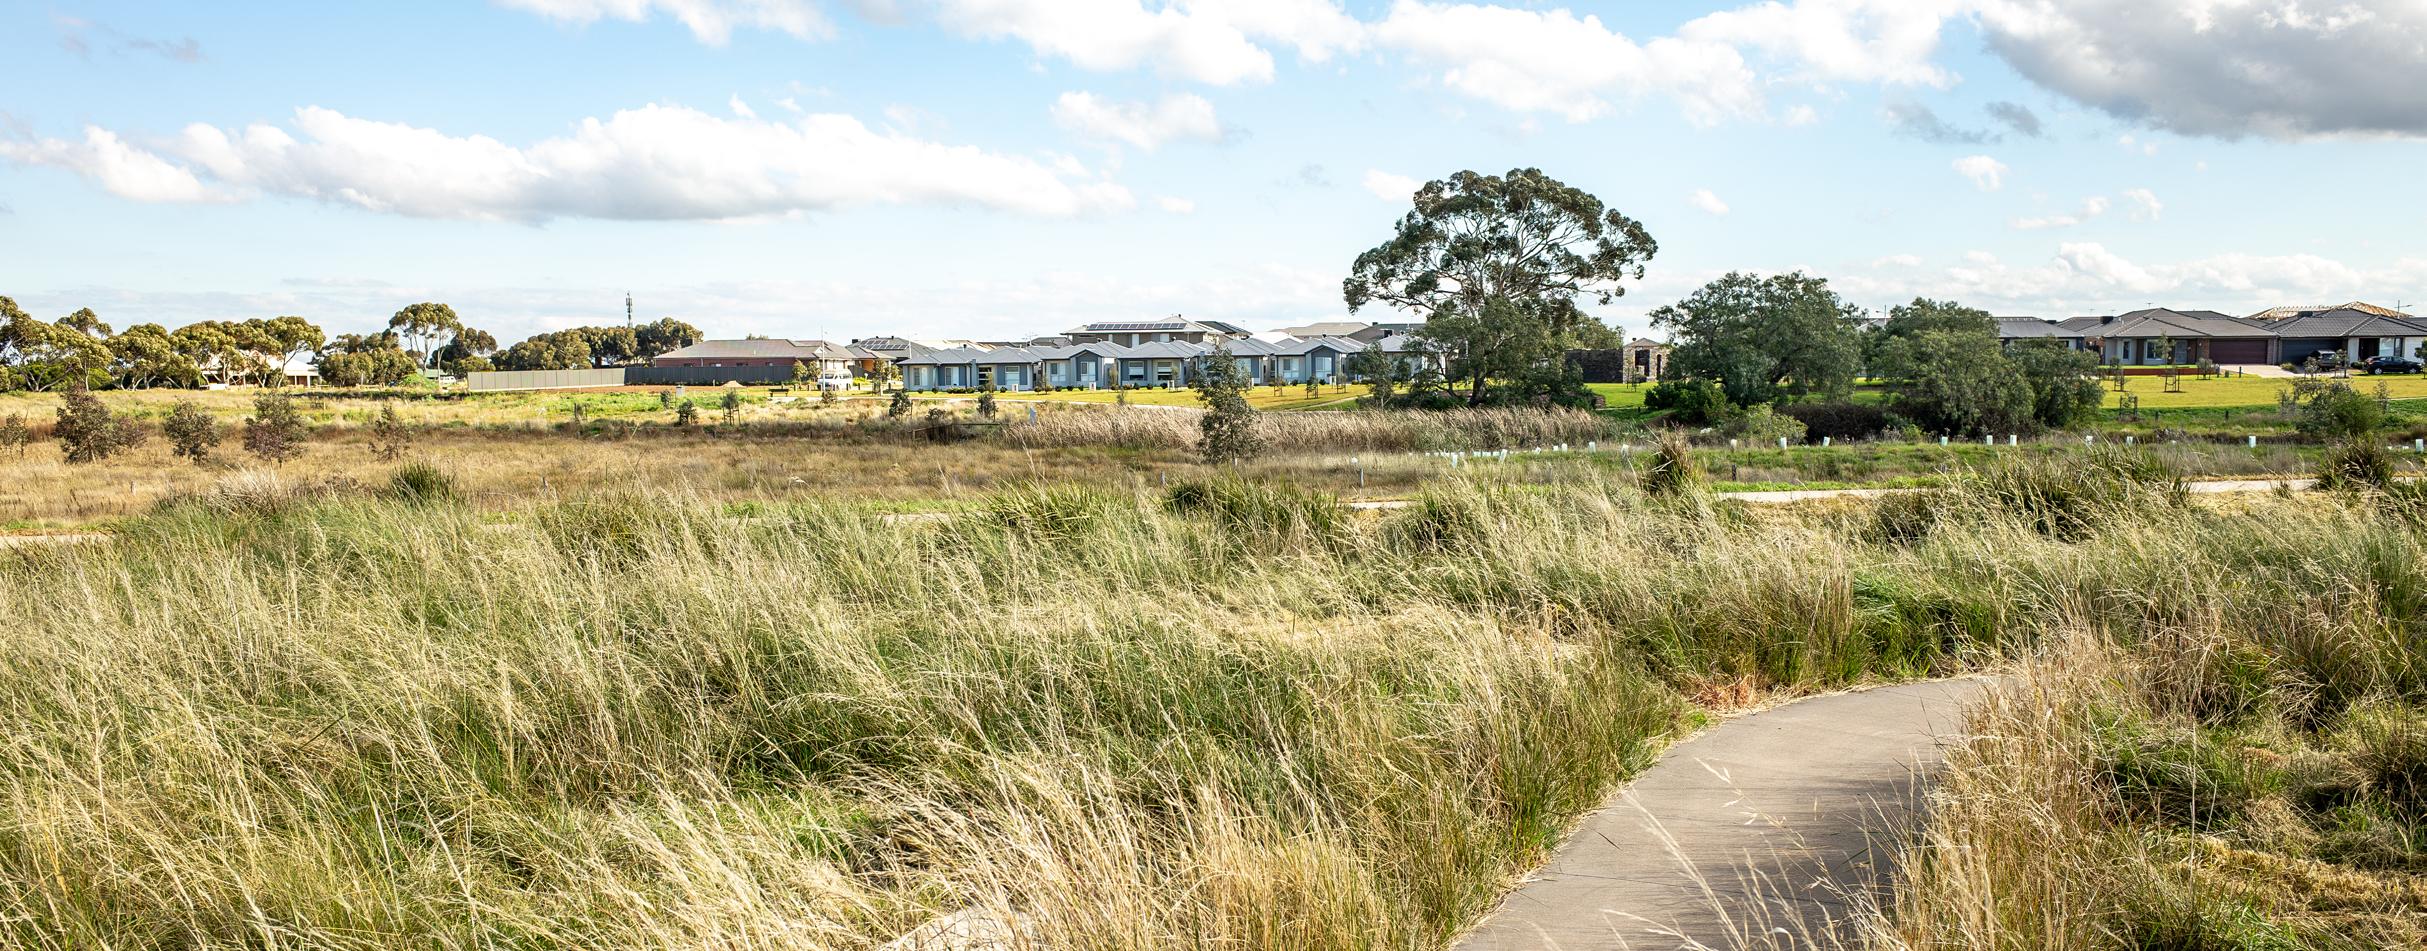
For several years, prospective buyers have had to delay their purchasing decision as rising costs pushed the dream of home ownership further out of reach.
Improved affordability, rebounding buyer sentiment, and ongoing population growth should drive a gradual return to long term average levels.
RPM Buyer Surveys reflected this shift; between FY2021 and FY2025, the median age of owner occupier purchasers rose from 33 to 38, while the median household income jumped nearly 50%, approaching $140,000. This affordability strain contributed to an extended downturn in lot sales, with volumes remaining below 1,000 per month for 34 consecutive months from July 2022 to April 2025.
But the tide has started to turn. May and June both recorded more than 1,100 lot sales, marking a clear inflection point in demand. Much of this lift can be attributed to the two rate cuts earlier this year, which improved borrowing capacity and lifted sentiment. Importantly, the headline sales data may still understate the momentum underway given the surge in secondary market activity as seen in a 50% decline in re-sale stock on market.
The August rate cut was widely expected following Q2 inflation figures, which showed annual growth easing to 2.1%, near the lower end of the RBA’s 2-3% target
range. One of two additional cuts may follow by year end. This series of monetary policy shifts is set to expand the pool of eligible buyers and unlock pent up demand.
Incentives will remain part of the equation for now. Rebates and discounts are expected to persist to accelerate the absorption of titled and near titled stock. At the end of June, titled lots made up 41% of available supply, with another 30% due to title before the end of 2025. However, with total developer stock sitting at over 6,100 lots, price growth is expected to remain subdued. Historically, upward pressure on lot prices has only emerged when stock levels fall to about one-third of current volumes.
While conditions aren’t ripe for a price surge, the building blocks for a sustained recovery in sales activity are firmly in place. Improved affordability, rebounding buyer sentiment, and ongoing population growth should drive a gradual return to long-term average levels in the months ahead.
For more information, please visit: www.rpmgrp.com.au
For a detailed market analysis or a tailored report, email the team at: contactus@rpmgrp.com.au

Rod Anderson
National Managing Director Communities rod@rpmgrp.com.au
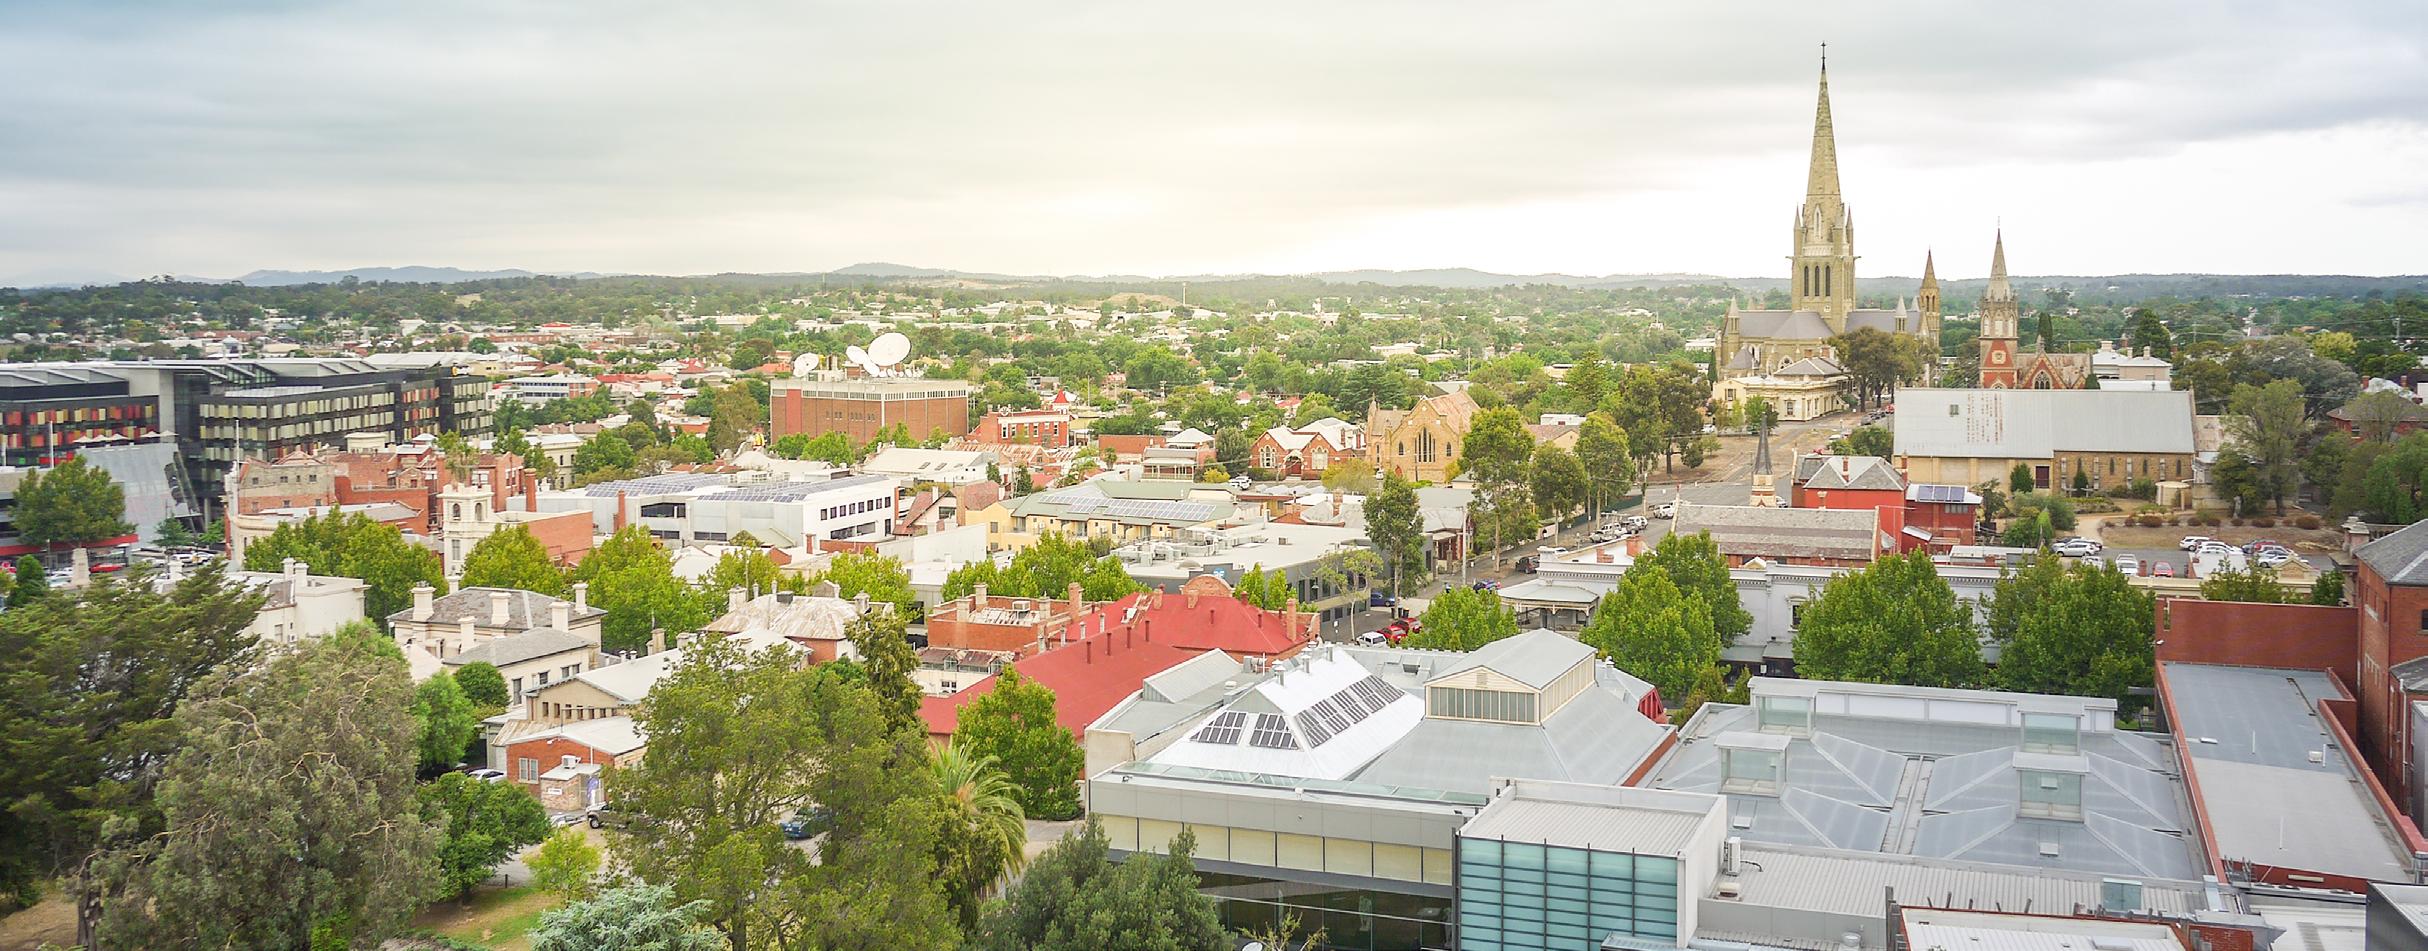
Sales activity in regional Victoria strengthened over Q2, bouncing back from a slow start in 2025.
After a flurry of activity at the end of 2024, the market softened in Q1 before recovering modestly in Q2. Most regionals areas recorded improved sales compared to Q1, supported by the RBA’s second interest rate cut in May, which brought the cash rate down to 3.85%. This shift likely helped bolster buyer confidence and improved borrowing capacity, particularly for first home buyers and upgraders.
The lift in demand coincided with a notable increase in new lot releases. Following a subdued first quarter for supply, developers reentered the market in greater numbers, signalling renewed confidence in the regional sector’s ability to absorb new stock. While Ballarat and Bendigo saw minor quarter on quarter declines, other locations such as Drouin and Warragul nearly doubled their Q1 sales, suggesting strong pockets of buyer appetite still exist, especially when paired with end of financial year incentives.
Affordability remains the backbone of the regional market’s resilience, helping to attract relocating metropolitan buyers and local purchasers.
Affordability remains the backbone of the regional market’s resilience. Median lot prices held steady or fell slightly across most regions, reinforcing the price advantage regional areas maintain over their metropolitan counterparts. This continued affordability helps attract both relocating metropolitan buyers and existing local purchasers.
Despite the rate cuts, economic headwinds persist. Elevated inflation and cost of living pressures are still weighing on sentiment. Still the signs of recovery are encouraging. A more competitive price point, coupled with increased supply, has helped stabilise the regional market’s performance as we head into the second half of the year.
The challenge now is to maintain this momentum, especially as developers respond to evolving buyer preferences and broader pressures.

Ballarat recorded 79 lot sales in Q2 2025, down 13% from the previous quarter and 25% below the same time last year. The decline likely reflects a post incentive slowdown and longer trading periods delaying buyer decisions.
Ballarat’s western region remained dominant, accounting for 92% of sales (73 lots), while activity in other areas was minimal: just three sales in the south, two in the east, and one in the north. Source: RPM Research,
Only 15 new lots were released in Ballarat in Q2 2025, a sharp 75% drop from the previous quarter. All were concentrated in the western region, with no new supply elsewhere.
The fall in releases reflects a strategic pivot by developers toward clearing existing stock rather than introducing new supply. Meanwhile, 124 lots were returned to market (the highest in five years) driven by affordability pressures and weakening buyer confidence.
Total stock rose 6% to 855 lots, while stock overhang increased 8% to 776 lots.
Source: RPM Research, Data & Insights
Ballarat’s median lot price fell 7% in Q2 2025 to $285,000, down $20,000 from last quarter and $30,000 lower year on year.
Median lot size also declined by 8% to 462sqm, though it remains 3% above Q2 2024 levels. As a result, the price per square metre rate edged up slightly to $617/sqm.
Bendigo recorded 62 lot sales in Q2 2025, down 21% from the previous quarter and 35% lower year on year. This decline suggests the market is cooling after the early year uplift driven by incentives and discounts.
Despite softer sales, supply expanded, with 103 new lots released marking a 72% increase from Q1. Most of the new stock was concentrated in the northern and eastern regions, reflecting developer confidence in the market’s ability to absorb additional supply in the second half of 2025.
A total of 11 lots were returned to market in Q2 2025, contributing to a rise in overall supply. Combined with the sharp increase in new releases, total stock reached 350 lots; the highest level since Q3 2020.
Stock overhang rose 22% to 288 lots, with the majority concentrated in the northern region. This highlights potential for developers to target future releases in other areas to help rebalance supply across the corridor in the second half of the year.
In Q2 2025, Bendigo’s median lot price fell 5% from the previous quarter and 7% from the same time last year to a median of $265,000. This drop was driven by weaker sales in the northern region, where smaller, lower-priced lots made up over half of total activity.
Median lot size also contracted by 10% to 515sqm. As a result, the price per square metre rate rose by a material 6%.
Drouin and Warragul saw lot sales surge 76% to 81 lots in Q2 2025, reaching the highest quarterly total since Q2 2021. Drouin slightly outpaced Warragul with 42 lots sold versus 39.
This boost was driven by strong rebates, discounts, and incentives aimed at closing out the financial year, alongside two new estates launching in Drouin. Together, these added 104 lots to the market and sparked renewed buyer interest.
The sales uplift was matched by new releases and moderate cancellations, pushing total stock to 347 lots. This was a 23% rise from the previous quarter and 24% higher year on year. Despite strong sales growth, stock overhang remained high at 266 lots, up 13% quarter on quarter and 18% from Q2 2024.
Demand for regional relocation is expected to stay strong, supported by expansions in Nar Nar Goon and Pakenham East. Elevated stock levels may help ease supply shortages, while recent interest rate cuts could further boost buyer confidence and activity.
Source: RPM Research, Data & Insights
The Drouin and Warragul region saw its median lot price rise 6% over the quarter to $343,000, though this remains 2% below the same period last year.
The median lot size fell 6% to 532sqm, driving a 13% increase in price per square metre rate to $645/sqm.

Following a slight dip in Q1 2025, the Macedon and Mitchell regions saw sales rebound in Q2, with 36 lots sold. This was a 13% increase from the previous quarter but 3% below the same time last year. The rise was likely driven by end of financial year incentives such as rebates and discounts.
New lot releases increased 59% over the quarter to 27 lots but remain down 45% year on year. This cautious supply growth reflects developers’ efforts to balance stock levels amid soft demand and a subdued market.
In Q2 2025, 10 lots returned to market due to cancellations. This was a 29% decline from the previous quarter and 55% down from the same period last year. While both sales and new releases saw modest growth, stock overhang remained relatively steady at 331 lots, signalling a cautious but stable market.
Source: RPM Research, Data & Insights
Over Q2 2025, the median lot price in Macedon and Mitchell held steady, rising marginally by $950 to $415,950. This was a 7% yearly increase. The median lot size remained unchanged at 647sqm, resulting in a slight lift in the median price per square metre rate to $643/sqm.
Michael Staedler General Manager Research, Data & Insights m.staedler@rpmgrp.com.au
The regional market is likely to find a more balanced rhythm in the coming months. After a measured rebound in Q2, momentum appears to be rebuilding, though cautiously.
The second interest rate cut in May added fuel to buyer confidence, and the August reduction should extend that sentiment further.
Demand for a regional lifestyle remains compelling, particularly among buyers seeking affordability and more space. However, shifting workplace expectations could temper some of the tree change movement, with more employers encouraging at least partial returns to the office.
That said, activity is still expected where the numbers make sense. Developers who offer smaller, more appropriately priced lots stand to benefit, especially as the established home market shows signs of fatigue. Buyers remain cost conscious, and the product mix will need to reflect that without compromising too heavily on liveability.
The second interest rate cut in May has added fuel to buyer confidence, and the possibility of another reduction later in the year could extend that sentiment further. But the impact of monetary policy takes time. The full effect of these rate changes won’t be felt until later in 2025 and much depends on how inflation and broader economic conditions play out over the next two quarters.
The regional market’s outlook hinges on its ability to remain agile. Developers will need to keep a close eye on their pricing, stay responsive to changing household budgets, and continue delivering projects that meet buyers where they are now, not where they were.
For more information, please visit: www.rpmgrp.com.au
For a detailed market analysis or a tailored report, email the team at: contactus@rpmgrp.com.au
Research, Data & Insights

Michael Staedler
General Manager
Research, Data & Insights
m.staedler@rpmgrp.com.au

Andrew Raponi
Senior Research Manager a.raponi@rpmgrp.com.au

Laurence Rao
Research Manager - VIC laurence@rpmgrp.com.au

Simon Brinkman
Research Manager - QLD simon@rpmgrp.com.au
Executive, Sales and Marketing Leadership


Luke Kelly
National Managing Director
Built Form luke@rpmgrp.com.au

Rod Anderson
National Managing Director
Communities rod@rpmgrp.com.au

Peter Grant
National Managing Director Business Development peter@rpmgrp.com.au

Imogene Schaefer
General Manager
Marketing imogene@rpmgrp.com.au
Michael Vilar
General Manager
Medium Density michaelv@rpmgrp.com.au

Greg Rankin
General Manager Communities gregr@rpmgrp.com.au

Johnathon Driessen
General Manager
Communities johnathon@rpmgrp.com.au

Tim Hyland
National Strategy Manager
Transactions & Advisory tim@rpmgrp.com.au
For detailed insights or custom reporting, contact the team at: contactus@rpmgrp.com.au