VIC

Q3 2025
VICTORIA GREENFIELD MARKET REPORT
Q3 2025

Luke Kelly
National Managing Director Built Form
luke@rpmgrp.com.au
• Market momentum is returning, supported by strengthening fundamentals.
• Education led activity is emerging as a major signal of future demand.
• Sales activity is improving with confidence gradually rebuilding.
There is a quiet but unmistakable lift in Victoria’s greenfield market. After two years coloured by caution, rising costs, and fluctuating sentiment, momentum is beginning to return. It is shaped by long term fundamentals, including population growth, improving affordability, and the steady realignment between what buyers want and what developers bring to the market.
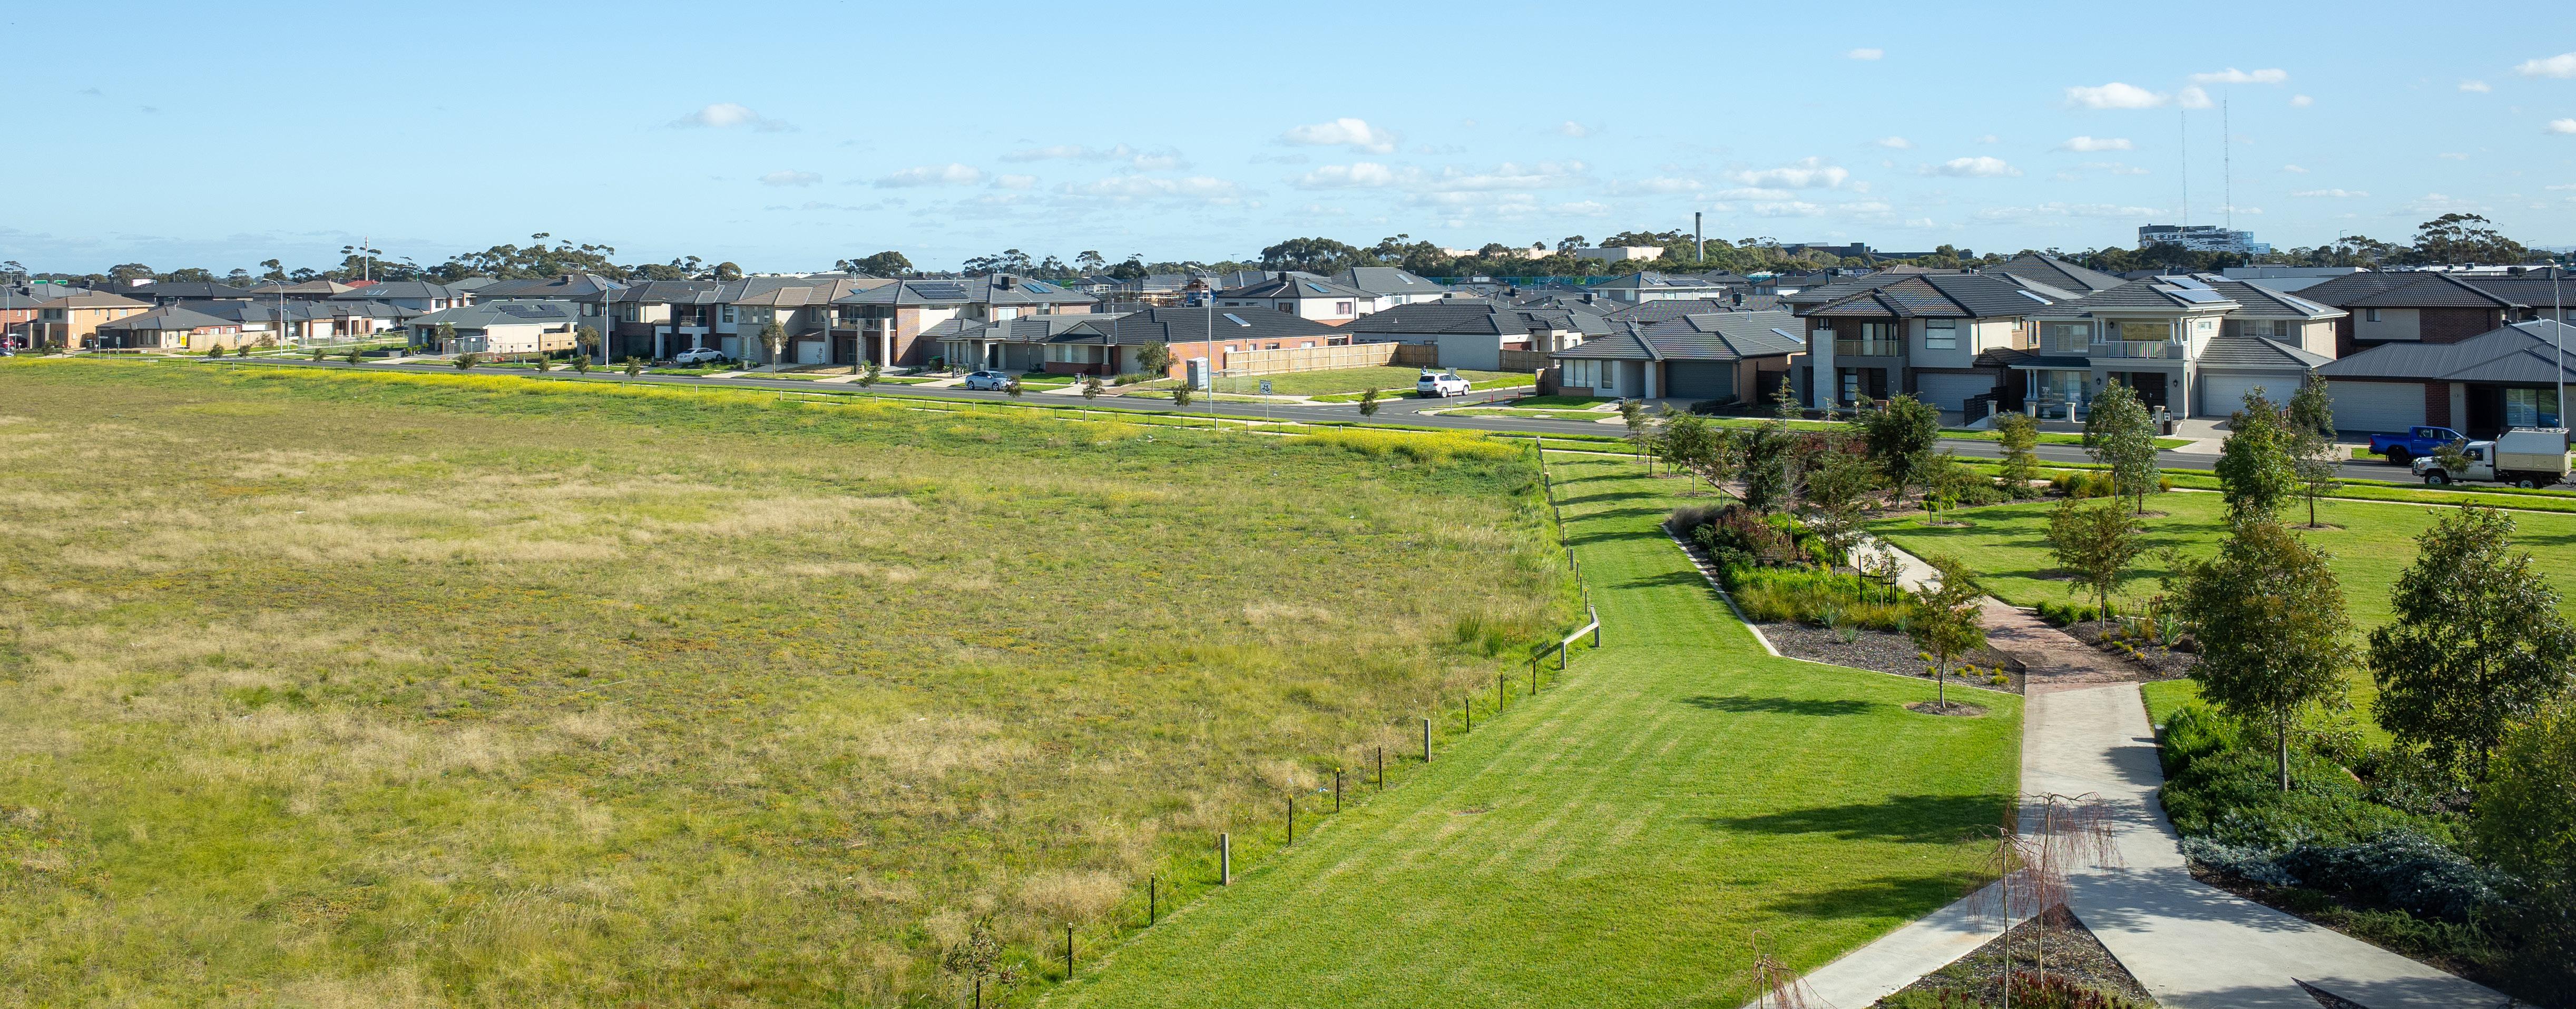
One of the signs is coming from families. Across Melbourne’s growth corridors, demand is intertwined with a desire for community and access to education. School providers are acting earlier, engaging sooner, and securing sites that anchor future neighbourhoods. The recent run of high profile education transactions show how deeply this demand runs. Providers are planning for larger catchments, stronger connections to transport, and the type of long term growth that gives new communities their identity from day one.
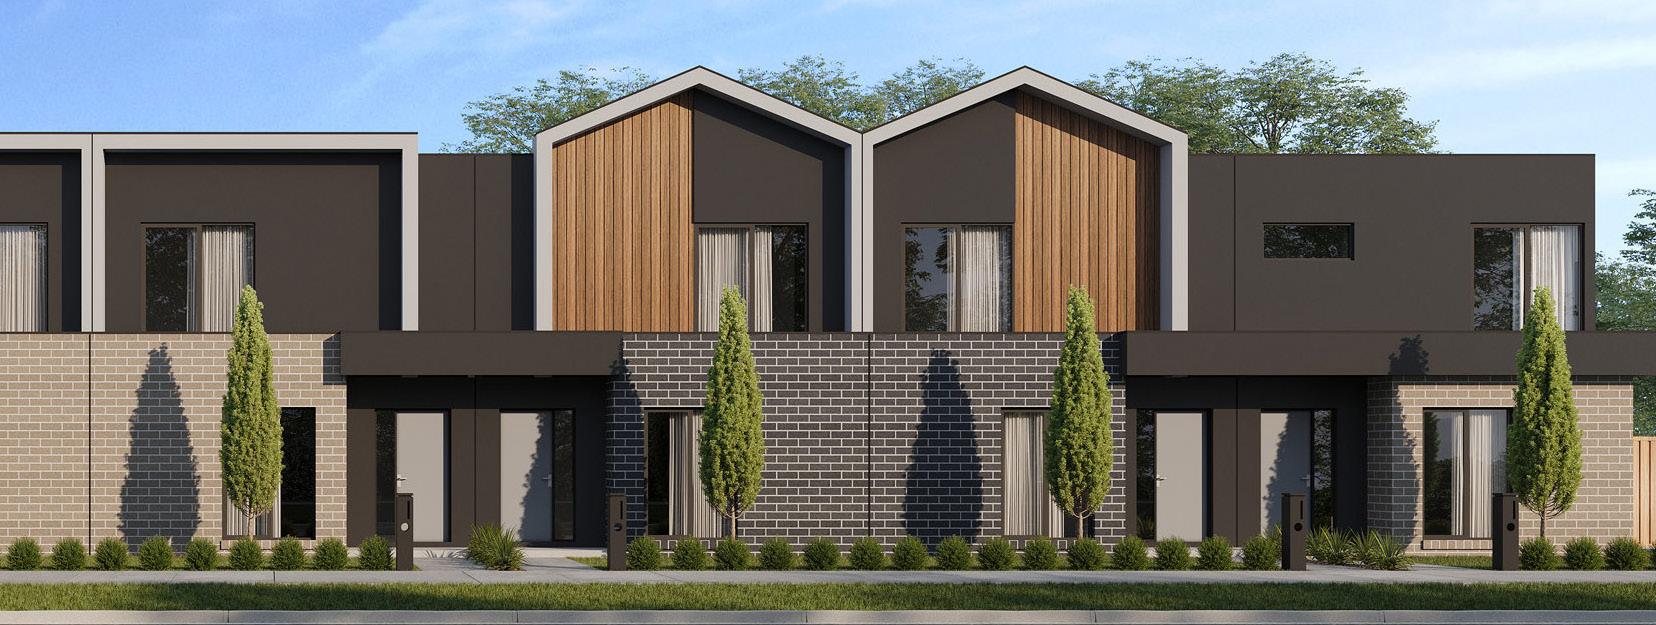
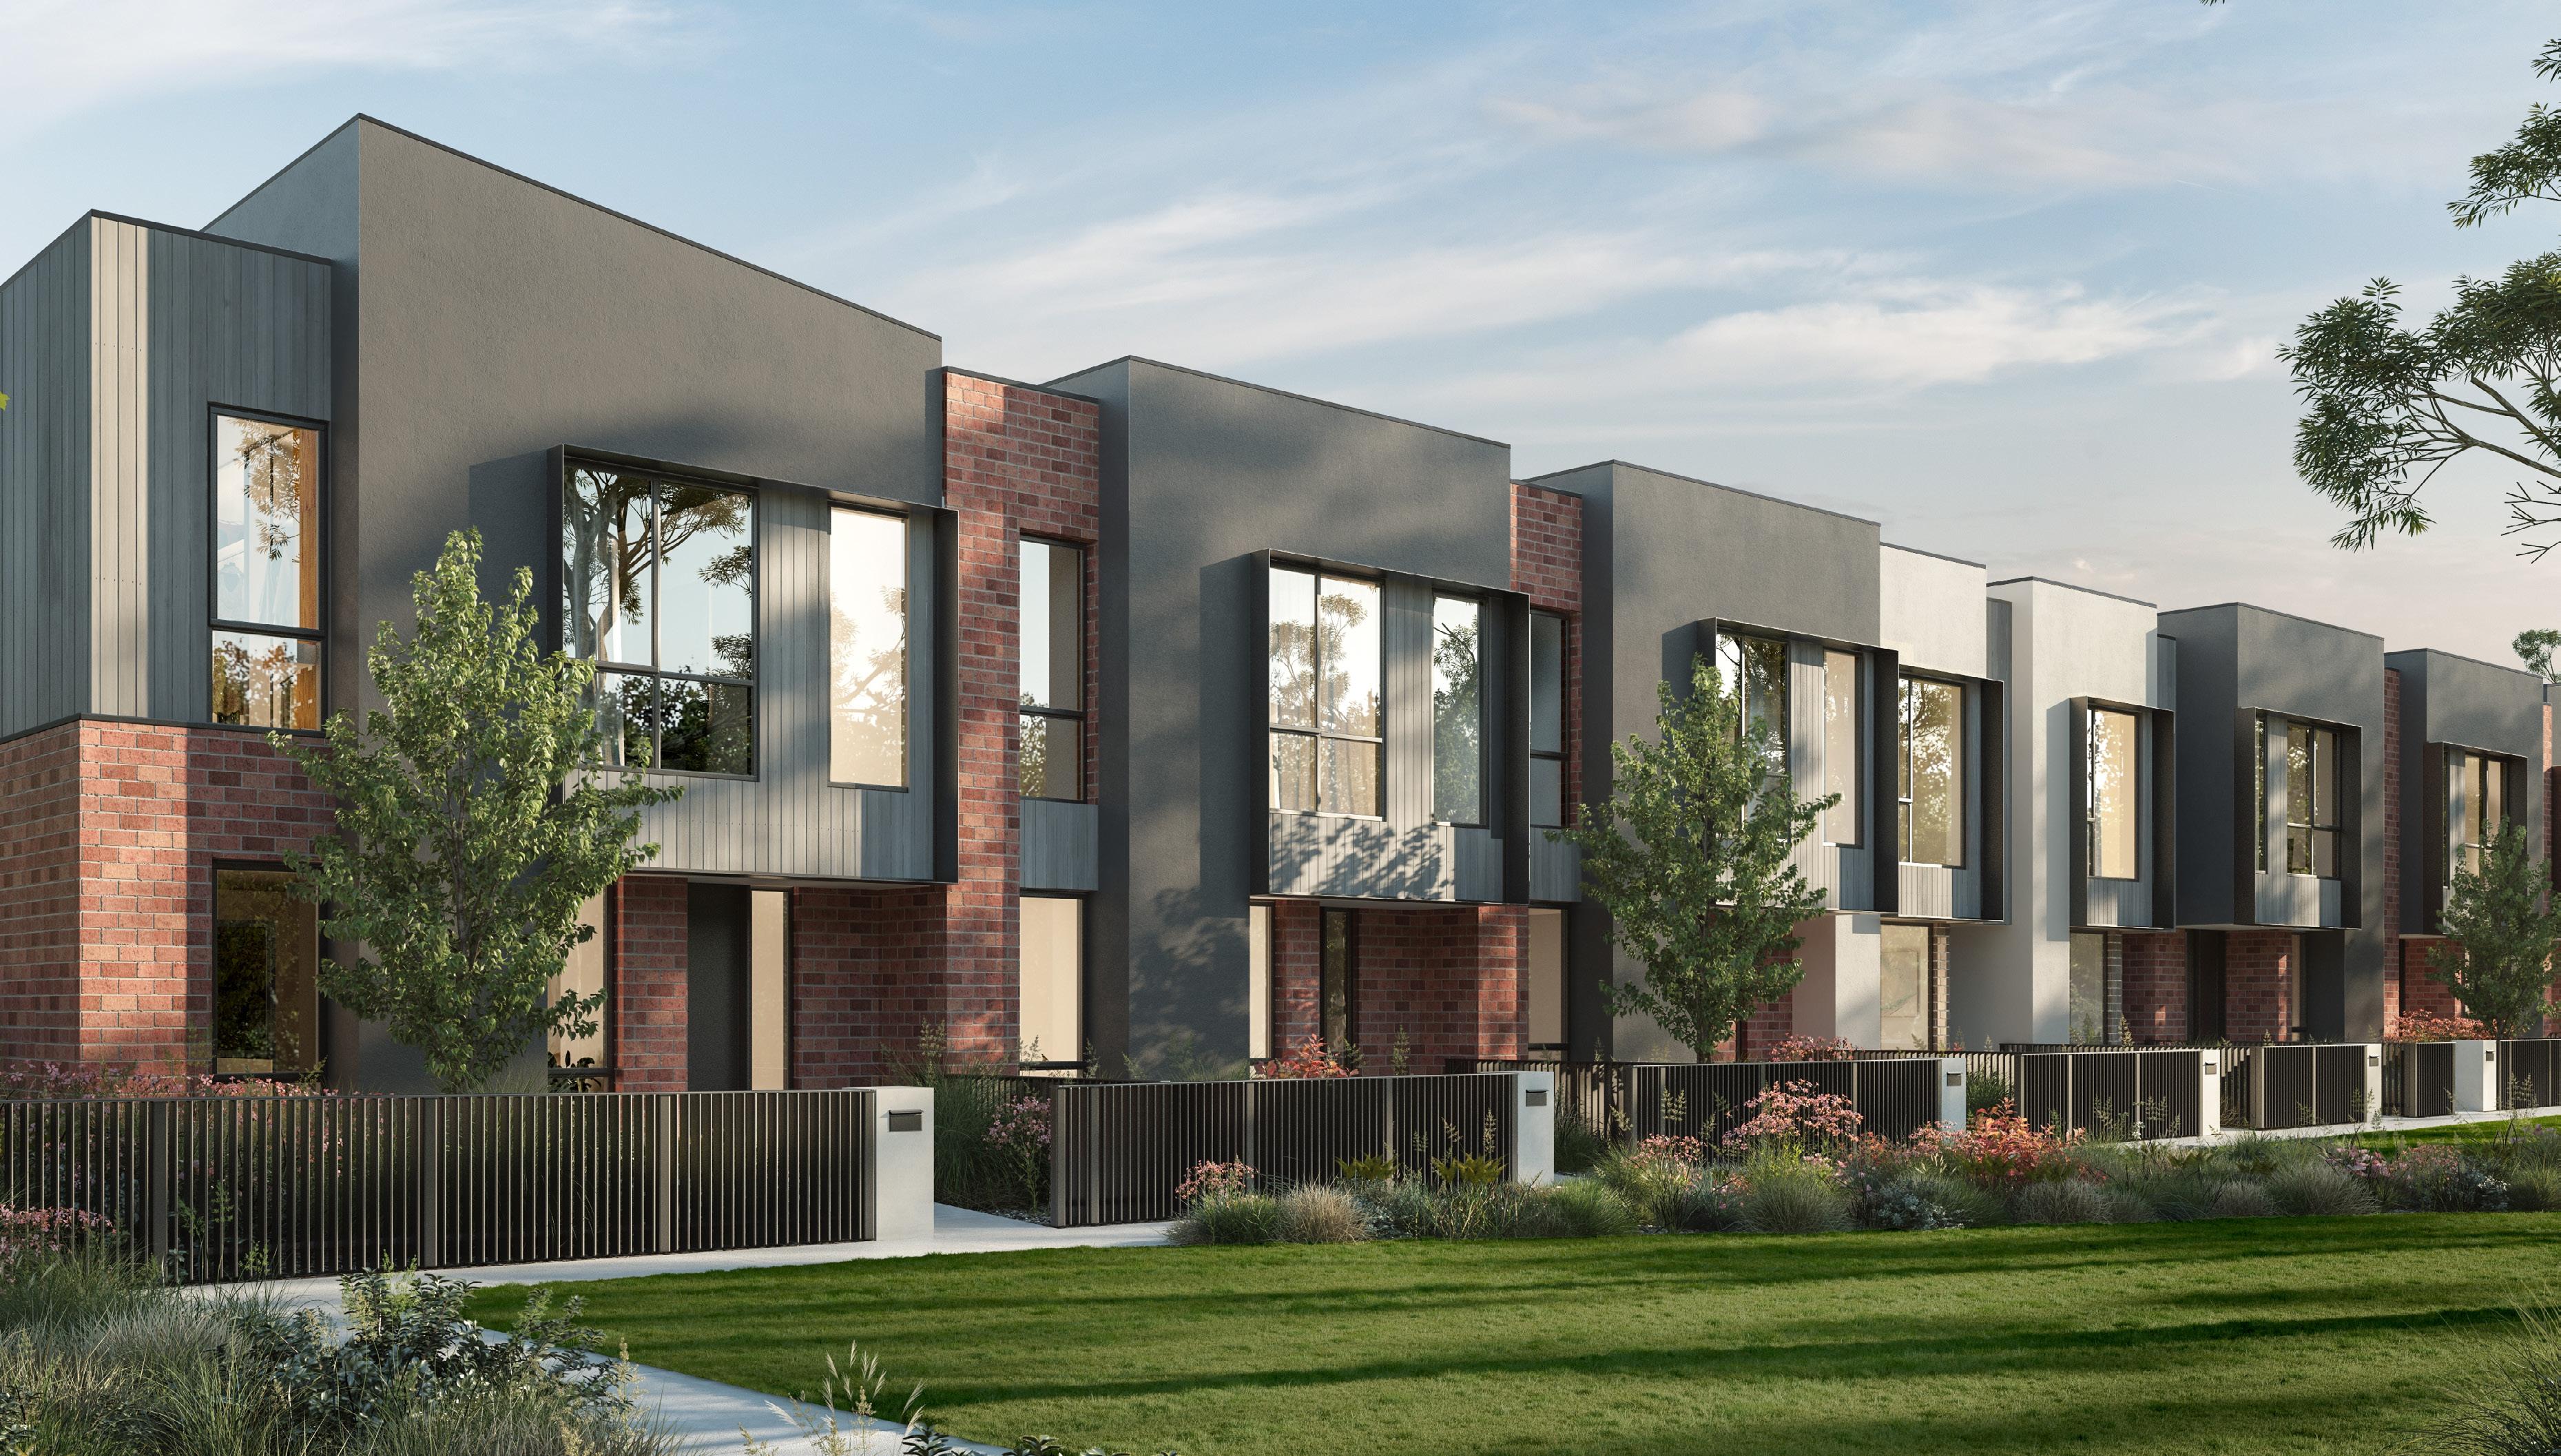
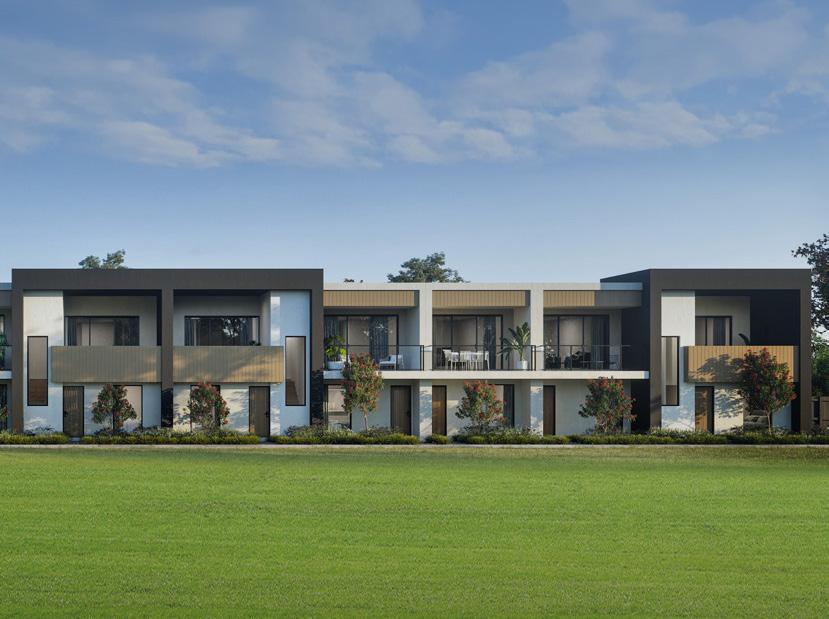
Medium density is also gaining momentum. Buyers who spent much of 2025 waiting out the uncertainty are now reentering the market, driven by improving borrowing power and a growing sense that conditions won’t materially ease in the near term. Townhomes, in particular, are benefiting from this recalibration. They remain one of the few pathways into the market for households earning around $100,000, and with investor interest returning, competition is gradually building.
Land markets across Melbourne and Geelong are telling a similar story. Q3 delivered the strongest quarterly sales result in more than three years, supported by modest price growth and steady improvements in affordability. Buyers remain price sensitive, though they’re more optimistic than they were six months ago.
The regional market is moving in step. While broader cost of living pressures remain, confidence has lifted following multiple rate cuts earlier in the year, and the regional market continues to benefit from its relative value and lifestyle appeal.
The greenfield market is certainly strengthening with intent. The next phase of recovery will be shaped by how effectively developers align products with household budgets, how quickly community infrastructure keeps pace, and how buyers adapt to a higher for longer rate environment. Although challenges remain, it’s key to note that the foundations are strengthening and sentiment is improving.
For more information, please visit: www.rpmgrp.com.au
For a detailed market analysis or a tailored report, email the team at: contactus@rpmgrp.com.au

With inflation ticking up, the cash rate has held steady for a third consecutive meeting.

Planning for schools in Melbourne’s fastest growing areas.
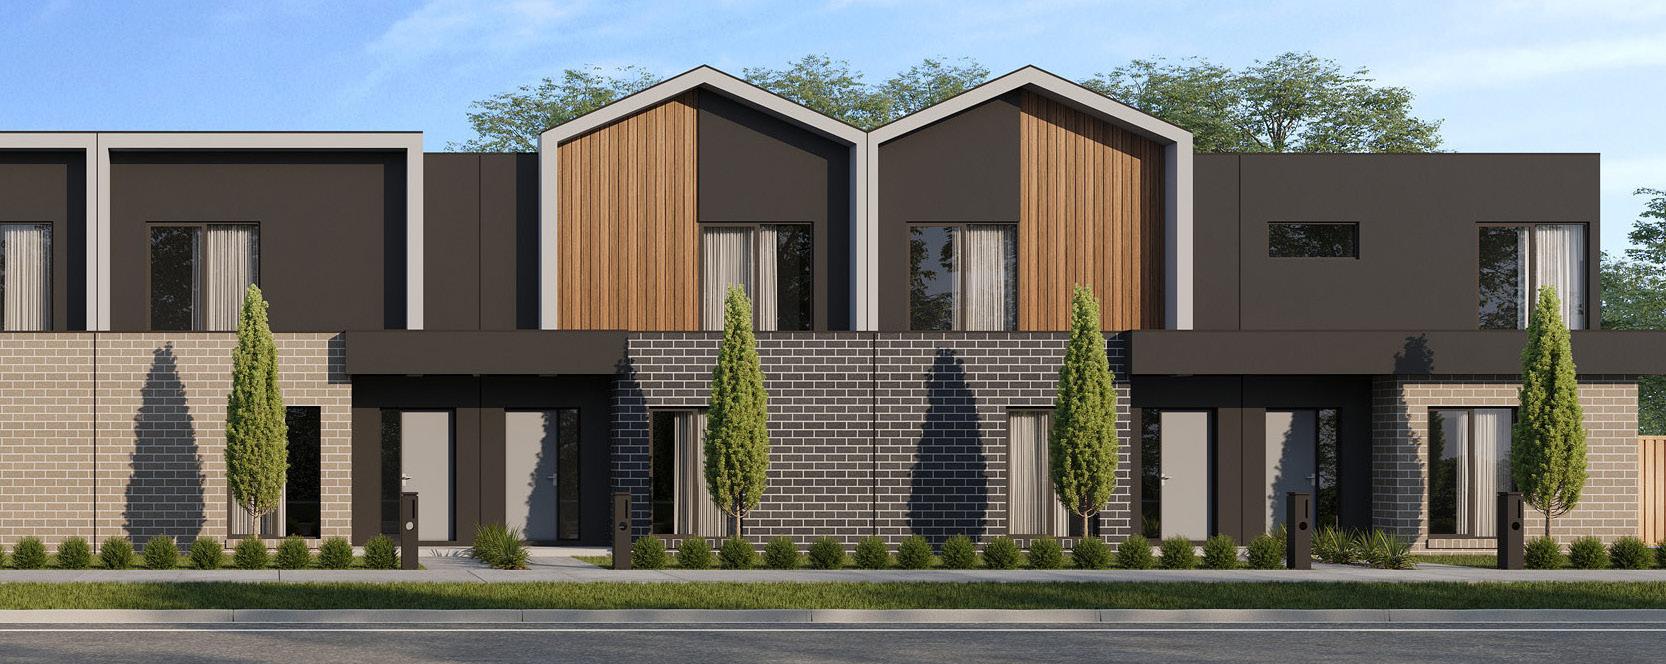
There is growing momentum across the medium density market, driven by steady demand from both owner occupiers and returning investors.
RPM’s Research, Data & Insights division provides indepth analysis on current local and overseas economic and property market conditions. The team consists of economists, property experts, and GIS analysts that provide real-time market intelligence, and analytical and strategic advice.
Our knowledge and expertise are an invaluable resource for RPM’s developer clients, empowering them to make intelligent, informed, and strategic decisions when evaluating residential developments and investment opportunities.
Our data and analysis help clients maximise their marketing efforts and achieve sales targets on their estates. Each month we collect extensive data on approximately 350 estates in Victoria, 140 estates in Queensland and 180 in New South Wales, providing our clients with a comprehensive understanding of the market dynamics. This also underpins the core strategic decision-making of our own business.
We profile every lot including lot size, price, orientation, sqm rate and title status, monitoring through to final sale.
This rich data helps our team and clients to better understand:
Volume of lots sold
Dollar per sqm rates
Stock release levels
Volume of stock returned to market
Your dedicated research team:

Michael Staedler General Manager Research, Data
& Insights

Distribution of lots of a particular size
Distribution of price points
Activity levels by market, product & developer
Stock level fluctuations
Andrew Raponi
Senior Research Manager
Research, Data & Insights

Laurence Rao
Research Manager - VIC
Research, Data & Insights

Daniel Gradwell
Associate Director of Property
The Federal Government’s 5% deposit scheme has generated a lot of interest. From a banking perspective, what are you seeing so far in terms of its impact on the market?
It’s still early days, we’ve only had a month’s worth of data, but the initial signs are interesting. Around 10% of homes that transacted in October used the scheme, which sounds big, but first home buyers typically make up about 20% of the market anyway. So it’s definitely adding demand, but not a huge step change.
What we can see, though, is that the lower end of the market is showing the strongest growth in four years. The lowest quartile of property values had the most noticeable price uplift in October, followed by the middle segment, while the top end was fairly steady.
That tells us the scheme is giving extra momentum to entry level buyers, and that pattern is consistent across all capital cities.
The lower end of the market is showing the strongest growth in four years.
Are you seeing broader shifts in buyer sentiment or product type preference?
I think we’re back to a bit of that classic FOMO; buyers can see prices moving again, even in markets like Melbourne that had been lagging. When you open the door wider for first home buyers, it becomes a bit of a race to get in.
While we don’t yet have data by product type, I’d expect most of the activity to be focused on greenfield and apartment markets rather than detached homes in the inner and middle rings. That’s where affordability aligns with the buyer segments the scheme is designed to support.
How have settlement conditions been tracking in Victoria?
Settlement delays have been more common than outright cancellations. Developers are having to allow a bit more time as banks ask for additional documentation or updated valuations, but overall, settlements are still proceeding.
The main macro factor to watch is employment. While Victoria’s economy has lagged some other states, unemployment remains relatively low. If that holds, we expect settlement risk to keep easing, especially as confidence improves through 2026 supported by lower interest rates and stronger demand from first home buyers.

Tim Hyland
National Strategy Manager Transactions & Advisory tim@rpmgrp.com.au
Families moving to Melbourne’s growth corridors are driving strong demand for well located, reputable education providers. For many, proximity to quality education is as important as access to transport networks or town centres.
Working closely with private and non-government education providers, RPM Transactions & Advisory (T&A) secures sites that are strategically positioned within new and emerging communities, ensuring education is accessible, integrated, and future ready.
Our approach is informed by rigorous analysis of population trends, school age projections, and household demographics. We also look beyond the immediate area when considering the population base, recognising that families are willing to travel for quality education.
RPM research shows that the catchment surrounding Wollert is expected to reach approximately 350,000 residents, including more than 60,000 school aged children, by 2041. This type of knowledge, analysis, and forecasting gives education providers the confidence to submit strong offers for well located land.
RPM T&A recently sold a 10 hectare Wollert Private School site, located across from the Mason Quarter and Lyndarum North communities in Melbourne’s northern corridor, to Hume Anglican Grammar for a record breaking price. Adjacent to the future Major Town Centre, proposed East Wollert Sports Reserve, and the planned Wollert Train Station, the site is perfectly positioned to serve a rapidly growing community.
Securing a high calibre provider like Hume Anglican Grammar represents a major win for both the Wollert region and the wider corridor.
The team’s understanding of how independent and faith-based school groups plan long term campus growth and connectivity gives these providers the confidence to secure strategic sites such as this.
Nearby, the team also sold the Woodstock Private School site. The 2.6 hectare site is located within the Atticus Estate in Donnybrook, offering a strategic entry point for private education providers into one of Victoria’s fastest growing areas. With the Donnybrook/ Woodstock corridor having now sold almost 6,000 lots, the demand for school infrastructure is immediate.
In Fraser Rise, established inner-Melbourne education provider St Mary Coptic Orthodox College secured a 4.5 hectare school site within the Aldo estate in the heart of the Melton growth corridor.
The site’s flexibility and proximity to the future Plumpton Major Town Centre and sporting reserve made it a standout opportunity.
Backed by thorough analysis and market insights, the buyer had the clarity to make a confident and considered move. RPM T&A advised on forecast changes to homebuyer demographics and sales rates to ensure long term, sustainable outcomes for the community.
RPM T&A’s strength lies in its deep understanding of how school operators plan for growth, including campus scale, student intake projections, and connectivity with surrounding infrastructure. Just as importantly, each site is considered within the context of the community around it, from town centres and transport links to recreational spaces and more. This consultative approach helps education providers make strategic, informed decisions and ensures future schools are embedded within thriving communities from the outset.
Since June 2025, RPM T&A has secured over $50 million in school site sales, connecting high calibre education providers with thriving new communities across Victoria. From early education providers to primary and secondary schools, the team’s expertise spans the full spectrum of the education sector.
The RPM team demonstrated exceptional market knowledge and professionalism throughout the sale process of the Wollert private school site.
Their strategic approach and strong relationships with education providers helped deliver an outstanding result that supports the long-term vision for Cedar Woods’ Mason Quarter community.
Ryan Beer Project Director, Cedar Woods
Luke Kelly
National Managing Director Built Form luke@rpmgrp.com.au
There is growing momentum across the medium density market, driven by steady demand from both owner occupiers and returning investors.
Unit prices lifted 2.1% in Q3 to reach $645,500, the highest level in almost three years. It marks a clear turnaround from early 2023 when Melbourne lagged other capitals amid weak sentiment and high listings.
Q3 headline CPI rose 1.3% for the quarter and 3.2% annually, above the RBA’s 2-3% target band, suggesting further rate cuts are now likely deferred into 2026. For Melbourne townhome buyers, these factors mean that waiting for another rate cut could mean missing out on stronger growth that is already unfolding in the market.
At the current price of around $575,000, a new build turnkey greenfield townhome remains attainable for a household income of just over $100,000. Should interest rates be cut again sometime next year, the resulting increase in borrowing capacity would lift that figure to roughly $588,000. In other words, households that have the capacity to buy today yet are waiting for rate cuts that may or may not arrive soon, risk paying more as prices continue to climb.
Historically, the new home market has followed the trajectory of the established housing market. If that pattern continues as expected, a townhome purchase today might increase in value by 5% by 2026. This potential growth could likely outweigh the modest financial relief a future rate cut could deliver.
First home buyers also continue to benefit from a suite of government and developer incentives, including stamp duty savings and the 5% deposit scheme. The impact is already clear in the market, with buyers responding strongly to greenfield townhome offerings.
At Eliston Place in Clyde, Stage 1 is almost sold out and Olio in Officer is now nearing its final stage release. Clear and consistent communication around government incentives and available stock continues to play an important role in encouraging buyers to engage sooner. With developer promotions already tracking fewer and smaller than previously, reinforcing the value of existing incentives can help bring forward demand, particularly among first home buyers who remain highly sensitive to perceived affordability shifts.
Owner occupiers accounted for around 61% of townhome buyers so far this year, with 65% being first home buyers. Yet, many potential entrants remain cautious, holding back for lower rates while local and interstate investors steadily return, adding competitive pressure to an already constrained supply.
Current buyer behaviour suggests that demand will continue to accumulate as affordability pressures persist, and households adjust to a higher-for-longer rate environment. While some buyers remain cautious, many are recognising that structural affordability issues won’t resolve in the near term, prompting earlier purchases. For developers, this points to a window where well priced, well located townhomes are set to attract increasing interest, particularly as incentives narrow, supply remains constrained, and competition intensifies across the market.

Rod Anderson National Managing Director Communities
rod@rpmgrp.com.au
Melbourne and Geelong growth areas recorded 3,649 gross lot sales in Q3 2025, up 16% from the previous quarter. This was the strongest quarterly performance in over three years, continuing the recovery that began earlier in 2025.
Improving affordability underpinned the lift in buyer activity. The Reserve Bank of Australia’s (RBA) third 25 basis point rate cut in August, fully passed through to home loan rates, expanded borrowing capacity and boosted confidence.
Ongoing developer incentives, including rebates and discounts, further encouraged buyers to re-enter the new home market. Titled lots were the focus of these offers, accounting for 41% of sales. As a result, the average time on market improved slightly to 177 days.
RPM Buyer Surveys show that first home buyers remained the dominant group, representing 47% of all owner occupier sales. Upgraders increased their share
Strong buyer confidence drove continued demand for new homes, sustaining higher sales activity.
to 42%, narrowing the gap and supporting stronger family (couples with children) demand. This shift drove interest in larger homes, with demand for dwellings above 30sqs now nearly matching that for homes between 21-25sqs.
Despite higher borrowing capacity, land prices remain restrained. Buyers remain sensitive amid elevated construction costs. Melbourne’s median lot price rose 1.5% to $399,000, alongside a 1.1% increase in median lot size to 355sqm, keeping the price per square metre rate stable.
Stock levels remain elevated but are falling. Improved conditions encouraged developers to accelerate new projects, with 13 estates launched in Q3 (the most since Q4 2021) lifting new supply 18% to 2,733 lots. Stock returns fell 30% to 584 as settlement risk eased. Overall, 5,685 lots were available at the end of Q3, down 5.5% from the previous quarter.
3,649
+16% over quarter | +54% annually. Lots Sold
Trading Days of Lots Sold
Down slightly from 185 days last quarter.
We survey all buyers on RPM managed projects in the greenfield market. The following illustrates demographic and purchase intent amongst all purchasers over Q3 2025. For a detailed analysis of any corridor, LGA, or suburb in Victoria, please contact our Research, Data & Insights team.
contactus@rpmgrp.com.au
$650-700k
$600-650k
$550-600k
$500-550k
$450-500k
$400-450k <$400k
Source: RPM Research, Data & Insights
1,208 +17% vs. Q2 2025
Gross Sales - Q3 2025
Gross sales in the Western growth corridor rose 17% to 1,208 lots in Q3, maintaining its position as the city’s most active with a 33% market share. Wyndham remained the top performing subregion, with strong sales across both its northern and western development fronts. Melton also recorded modest gains, though activity in its western estates remained subdued.
Notably, titled lots made up 49% of all sales in the West (above the other two metropolitan corridors) keeping average trading times elevated in around 182 days.
987+52% vs Q2 2025
New Lots Released - Q3 2025
Both Wyndham and Melton added five new estates in Q3, though their impact on supply varied. Lot releases in Melton more than doubled from last quarter’s low base, while Wyndham’s remained steady.
Overall, new supply in the Western growth corridor rose 52% to 987 lots, while stock returns fell 23% to 296 lots, largely due to fewer cancellations in Melton. Combined new supply and stock returns slightly exceeded lot absorption, resulting in a modest increase in total lots on the market by quarter’s end.
The median lot size in the Western growth corridor rose 1.7% in Q3 to 360sqm, extending the upward trend that began in Q2 after more than two years of stability at 350sqm. The increase was largely driven by lot sales in Wyndham.
In response, the median lot price edged up 0.5% to $386,000. However, price growth lagged behind size growth, reflecting buyer sensitivity to affordability and limiting upward pressure on per square metre prices.
1,106
The Northern growth corridor recorded 1,106 gross lot sales in Q3, up 9% for the quarter but marking the smallest gain among the four corridors, with its share of total sales easing to 30%. Softer activity in Whittlesea and Sunbury tempered overall growth, allowing Hume to reclaim its mantle as the corridor’s highest selling subregion.
Average trading days improved to 148, while titled lots accounted for just 29% of total sales – the lowest proportion across all corridors. Strong performance in large masterplanned communities along Donnybrook Road and Sunbury helped maintain consistent release and steady monthly sales.
New Lots Released - Q3 2025 794 +3% vs Q2 2025
New supply in the Northern growth corridor rose just 3% in Q3 to 794, the smallest quarterly increase across all corridors. Both Whittlesea and Mitchell recorded fewer releases, and Northern was the only corridor without a new estate launch during the quarter.
On a positive note, stock returns to the market fell sharply by 43% to 148 lots, the largest decline among all corridors. With steady new supply and strong sales activity, total stock on the market edged lower by the end of Q3.
Source: RPM Research, Data & Insights
$386,650
Median Lot Price - Q3 2025
vs Q2 2025
In Q3, the Northern growth corridor saw its median lot price rise 3.4% to $386,650, pushing it just above the Western corridor and ending its status as the most affordable.
Unlike the upward trend in other metropolitan corridors, the median lot size held steady at 350sqm, driven by sales in the larger Hume and Whittlesea subregions. As a result, the median price per square metre rate also increased 3.4%.
957 +22% vs Q2 2025
Gross Lot Sales - Q3 2025
Sales in the South East growth corridor surged 22% in Q3, marking the strongest quarterly increase, driven by an uptick in Cardinia. Casey remained the dominant subregion, contributing around two thirds of the corridor’s 957 gross lot sales and lifting its share of total metropolitan activity slightly to 26%.
Lot sales also outperformed the ten year quarterly average by 9%, while lots sold moved faster than in any recent quarter, with an average time on market of just 141 days.
+18% vs Q2 2025
New Lots Released - Q3 2025
New supply in the South East growth corridor rose 18% in Q3 to 685 lots, driven entirely by Casey, where three new estates were launched – the only new estates across the corridor. Stock returns fell 41% from the previous quarter, improving to 79 lots.
With sales continuing to outpace supply, total available stock at the end of Q3 dropped below 1,000 lots, reaching its lowest level since mid-2024.
Source: RPM Research, Data & Insights
The South East growth corridor remains the most expensive new home market, with the median lot price easing slightly by 0.3% to $437,500. The median lot size increased 1.4% to 364sqm, causing the median price per square metre rate to fall.
Within the corridor, Casey’s median lot price held steady, while Cardinia saw a modest decline. This reflected stronger sales activity in the more affordable East Pakenham front and smaller lot sizes sold in Officer.
+16% vs Q2 2025
Gross Lot Sales - Q3 2025
The Greater Geelong growth corridor saw 378 lots sold in Q3, up 16% on the previous quarter. Despite this uplift, the corridor’s share of total sales remained steady at 10%, unchanged from the previous two quarters.
Armstrong Creek continued to drive activity, accounting for around two thirds of all sales. Titled lots made up a substantial 61% of sales, with another 11% expected to title by the end of 2025. This has extended the average time on market to 338 days.
-18% vs Q2 2025
New Lots Released - Q3 2025
The Geelong growth corridor was the outlier in Q3 for both new supply and stock returns compared with Melbourne corridors. New lot releases fell 18% to 267, while stock returns edged up 2% to 88 lots.
Three new estates launched during the quarter, but none were in the higher activity subregions of Armstrong Creek or Lara, and the smaller lot yield of these projects limited their impact on overall supply. As a result, total available stock saw only a modest reduction by the end of Q3.
Source: RPM Research, Data & Insights
$376,900
The median lot price in the Geelong growth corridor continued its gradual decline in Q3, falling 0.8% to $376,900. This brings the overall correction over the first nine months of 2025 to 3.1%.
Smaller lot sizes have been a key factor, with the median lot size slipping 1% in Q3 to 390sqm and down 2.5% over the year.


Rod Anderson National Managing Director Communities rod@rpmgrp.com.au
Q3 2025 extended the recovery seen in Q2, with the regional land market posting its strongest quarterly performance of the year. Sales were supported by ongoing discounts and promotional offers, while rising developer confidence led to a noticeable increase in new lot releases.
Bendigo more than doubled its Q2 result, leading the regional gains, while other markets also recorded solid quarter on quarter growth. September usually signals a seasonal slowdown after the June rebound, which is often driven by end of financial year incentives. This year, however, sales defied expectations. Q3 volumes were around 70% higher than the same period in 2024, and nearly 90% above September 2023, reflecting stronger buyer sentiment and a steady recovery in the regional market.
Regional markets are defying seasonal trends, with sales surging, supply rising, and affordability keeping momentum strong.
Affordability remains a central driver. Regional lots continue to offer a price advantage over metropolitan greenfield sites, attracting both local buyers and city relocators. Median lot prices were broadly stable or slightly lower than last quarter, preserving this edge and supporting ongoing demand.
Monetary policy has also influenced the market. Following two rate cuts earlier in 2025, the RBA reduced the cash rate a third time in August to 3.60%.
Lower borrowing costs are expected to expand capacity for first home buyers and upgraders, reinforcing market confidence. At the same time, broader economic pressures, including cost of living and persistent inflation, continue to constrain growth.
Rate cuts provide short term relief, but the regional market will need to navigate these headwinds for the remainder of the year.


+35% vs Q2 2025
Gross Lot Sales - Q3 2025
Ballarat recorded a noticeable lift in sales activity over Q3 with 107 lots sold. This marked a 35% increase from the previous quarter, although it remained 4% below the same period last year.
Activity was concentrated in the western region, which accounted for 85% of all sales. The southern region saw moderate movement with 11 lots sold, while the eastern and northern regions remained quiet, recording just three and two lots respectively.
Source: RPM Research, Data & Insights
+287% vs Q2 2025
Cancellations returned 23 lots to the market. Despite this, total stock declined 4% to 822 lots. Strong sales activity further eased stock overhang by 8%, leaving 715 unsold lots at the end of Q3. New Lots Released - Q3 2025
Over Q3, Ballarat saw 58 new lots released, up 43 lots from last quarter. The majority were in the western region, with just two additional lots in the east, reflecting developers’ growing confidence that the market can absorb extra supply.
Source: RPM Research, Data & Insights
$285,000 N/C vs Q2 2025
Median Lot Price - Q3 2025
Over Q3, the median lot price in Ballarat remained steady at $285,000, unchanged from the previous quarter but 10% lower than the same period last year. Meanwhile, the median lot size edged down 3% to 448sqm compared with Q2 and was 1% smaller than Q3 2024. This combination pushed the median price per square metre rate slightly higher to $636/sqm.

Lot Sales - Q3 2025
Bendigo saw a remarkable surge in sales over Q3 with 166 lots sold, the strongest quarterly total since September 2020. This was an increase of 104 lots from the previous quarter and 117 more lots than Q3 2024.
Activity lifted across all regions, with the north leading the charge, accounting for 72% of total sales. Developers released 86 new lots during the quarter, down 17% from Q2, with supply concentrated in the northern and eastern regions and just seven lots added in the west. The decline in new releases indicates the market is still absorbing stock from the previous quarter.
Source: RPM Research,
During Q3, 23 lots were returned to the market due to cancellations; double the number recorded in the previous quarter. Combined with new releases, total stock levels lifted to 391 lots. Strong sales activity helped reduce the stock overhang by 22% from Q2, leaving 225 unsold lots at the end of the quarter.
While stock remains concentrated in the northern region, availability in the eastern and western areas increased, providing a broader mix of options likely to support ongoing buyer activity.
$262,000 -1% vs Q2 2025
In Q3, Bendigo’s median lot price softened slightly to $262,000, down 1% from last quarter and 5% lower than the same time last year. The decline reflects strong sales in the northern region, where smaller, more affordably priced lots dominated activity. The median lot size eased 1% to 512sqm, resulting in a modest 1% fall in the price per square metre to $512/sqm.
Source: RPM Research, Data & Insights Median Lot Price - Q3 2025

+39% vs Q2 2025
The Drouin and Warragul region recorded a strong lift in sales over Q3 with 103 lots sold, marking a 39% increase from the previous quarter. It was the first time sales had reached triple figures since Q2 2021, signalling renewed buyer confidence.
Warragul led with 73 sales, while Drouin contributed 23. The pickup was supported by end of financial year rebates and incentives, along with the August rate cut, which helped reenergise demand and bring more buyers back into the market.
Source: RPM Research, Data & Insights Gross Lot Sales - Q3 2025
Over Q3, 86 new lots were released, marking a 27% decline from the previous quarter. Combined with modest cancellations, total stock rose 4% to 384 lots, sitting 46% higher than the same period last year. Strong sales activity helped trim the stock overhang to 281 lots, down 3% from Q2 but still 28% above Q3 2024.
Elevated stock levels are likely to help ease supply constraints, while recent first home buyer incentives could provide an additional lift to buyer confidence and activity through the remainder of the year.
Source: RPM Research, Data & Insights
$316,000
The Drouin and Warragul region recorded a median lot price of $316,000 in Q3 2025, down 8% from the previous quarter and 1% lower than the same time last year. The softening reflects strong sales in Warragul, where smaller, more affordably priced lots continue to dominate activity. The medium lot size fell 5% to 504sqm, leading to a 3% decrease in the price per square metre, which settled at $627/sqm.

+75% vs Q2 2025
Gross Lot Sales - Q3 2025
After a slow start to 2025, the Macedon and Mitchell regions bounced back strongly in Q3, recording 63 lot sales, marking a 75% increase from the previous quarter and double the volume of Q3 2024. This marked the highest quarterly total since Q3 2022.
Developers responded to the renewed demand with 47 new lots released over the quarter, up 74% from Q2. The rising releases indicate developer confidence that the market can absorb additional stock while carefully managing supply.
Source: RPM Research, Data
New Lots Released - Q3 2025
A new estate launch in the Macedon Ranges lifted supply, with 47 lots released in Q3 and marking a 74% increase from the previous quarter. Cancellations returned nine lots to the market, taking total stock to 370 lots.
Even with stock reaching its highest level this year, strong sales helped reduce the stock overhang, which closed the quarter at 307 lots.
Source: RPM Research, Data & Insights
$390,000 -6% vs Q2 2025
Median Lot Price - Q3 2025
In Q3, the Macedon and Mitchell regions recorded a median lot price of $390,000, down 6% from the previous quarter. Despite this decline, prices remained 13% higher than Q3 2024. The softening largely reflects strong sales in Mitchell, where lower price points were prevalent. Median lot size rose 5% to 680sqm, which saw the price per square metre ease slightly, settling at $574/sqm.
Source: RPM Research,

Michael Staedler
General Manager
Research,
Data & Insights
m.staedler@rpmgrp.com.au
Despite the pause on further rate cuts, underlying demand in the new home market remains solid.
New home demand in the both the metropolitan and regional land markets responded strongly to improving affordability though 2025. The three 25 basis point rate cuts in February, May, and August, combined with the stage 3 tax cuts, boosted purchasing power.
Gross lot sales across Melbourne and Geelong averaged 3,402 across Q2 and Q3 2025, marking a 57% rise on the 2,166 average gross sales over the previous 11 quarters from Q3 2022 to Q1 2025. Despite this surge, sales remain below the new home market’s ten year average of 4,155 gross lot sales per quarter.
Momentum may fluctuate in the short term. Prospects for another rate cut this year have dimmed after Q3 headline CPI exceeded expectations, rising 1.3% for the quarter and 3.2% annually, above the RBA’s 2-3% target range. This could delay further monetary easing into 2026. Developer promotions, although fewer and smaller than previously, are expected to continue through the end of the year and may offset some buyer caution.
The market still carries a high number of vacant lots, either titled or expected to be titled in Q4 2025, estimated at 57% of current supply. End of year campaigns will focus on absorbing this stock.
The expanded Home Guarantee Scheme could further support demand. Growth corridor postcodes recorded strong uptake over FY24/25. While guarantees were mostly for established homes, this activity supports a market where vendors can sell and upgrade, echoing RPM Buyer Survey findings showing a rise in second family home purchases in Q3.
These buyers are generally less sensitive to changes in interest rates. However, first home buyers will continue to benefit from the market’s abundant affordable options, including townhomes and small lot housing code products. Townhome approvals are increasingly prominent in the greenfield sector, reinforcing that supply is aligned with demand. Coupled with solid population growth and existing pent up demand, lot sales are expected to trend higher through the remainder of 2025.
For more information, please visit: www.rpmgrp.com.au
For a detailed market analysis or a tailored report, email the team at: contactus@rpmgrp.com.au
Research, Data & Insights

Michael Staedler
General Manager
Research, Data & Insights m.staedler@rpmgrp.com.au

Andrew Raponi
Senior Research Manager
a.raponi@rpmgrp.com.au

Laurence Rao
Research Manager - VIC laurence@rpmgrp.com.au

Simon Brinkman
Research Manager - QLD simon@rpmgrp.com.au
Executive, Sales and Marketing Leadership


Paul McMahon
Chief Operating Officer paul@rpmgrp.com.au

Imogene Schaefer
General Manager
Marketing imogene@rpmgrp.com.au
Tim Hyland
National Strategy Manager
Transactions & Advisory tim@rpmgrp.com.au

Luke Kelly
National Managing Director Built Form luke@rpmgrp.com.au
Michael Vilar
General Manager
Medium Density michaelv@rpmgrp.com.au


Rod Anderson
National Managing Director Communities rod@rpmgrp.com.au
Greg Rankin
General Manager
Communities gregr@rpmgrp.com.au


Peter Grant
National Managing Director
Business Development peter@rpmgrp.com.au
Johnathon Driessen
General Manager
Communities johnathon@rpmgrp.com.au
For detailed insights or custom reporting, contact the team at: contactus@rpmgrp.com.au