FERC Project No. 14787
Black Canyon Hydro, LLC January 2023
Final License Application
Exhibit D: Project Cost and Financing Seminoe Pumped Storage Project
Final License Application – Exhibit D Seminoe Pumped Storage Project January 2023 | i Contents 1.0 Estimated Cost of New Construction 1 1.1 Cost of Land and Water Rights 1 1.1.1 Land ................................................................................................................1 1.1.2 Water...............................................................................................................1 1.2 Estimated Total Cost of Major Project Works .............................................................2 1.3 Estimated Indirect Construction Costs........................................................................2 1.4 Interest During Construction .......................................................................................2 1.5 Overhead, Construction, Legal Expenses, and Contingencies...................................3 1.6 Investment Tax Credit.................................................................................................3 2.0 Cost of Existing Structures and Facilities.............................................................................3 3.0 Federal Takeover 3 4.0 Estimated Annual Costs 4 4.1 Costs of Environmental Measures 4 5.0 Estimated Annual Value of Project Power 6 5.1 Adjusting BESS Costs for Comparison 7 5.1.1 Baseline BESS Cost Projections.....................................................................7 5.1.2 Adjustment for Duration Comparison ..............................................................7 5.1.3 Adjustment for Lifespan Comparison ..............................................................8 5.2 DOE 2020 Comparison...............................................................................................8 5.3 Investment Tax Credit: Benefits to BESS vs. Pumped Storage..................................9 5.4 Energy Value...............................................................................................................9 5.5 Ancillary Services Value............................................................................................10 5.6 Costs of Conventional Alternatives...........................................................................10 5.7 Summary: Estimated Annual Value of Project Power...............................................11 6.0 Cost of Energy Alternatives................................................................................................12 6.1 Fossil-Based Generation...........................................................................................12 6.2 Nuclear Power...........................................................................................................12 6.3 Renewable Resources..............................................................................................13 6.4 Other Pumped Storage.............................................................................................14 6.5 Other Energy Storage Technologies.........................................................................14 6.6 Conclusion ................................................................................................................15
7.0 Consequences of Denial of License Application 15
8.0 Financing 16
9.0 Cost to Develop the License Application 16
10.0 On-Peak and Off-Peak Value of Project Power 16
11.0 Literature Cited 19
Tables
Table 1.0-1. Estimated Total Cost of New Construction...............................................................1
Table 1.2-1. Major Project Works Estimated Cost 2
Table 1.5-1. Estimated Overhead, Construction, Legal Expenses, and Contingencies 3
Table 4.0-1. Average Annual Cost from Completion of Project Construction to Expiration of Original License...................................................................................................4
Table 4.1-1. Proposed Environmental Measures and Estimated Costs. ......................................5
Figures
Figure 5.0-1. PacifiCorp’s 2021 IRP Preferred Portfolio New Storage Capacity BESS Cost Projections 7
Figure 5.2-1. Annualized Cost and Levelized Cost Comparisons of Energy Storage Technologies ...........................................................................................................9
Figure 10.0-1. Hourly Load-Weighted Average Energy Prices (2022 January – March)............17
Figure 10.0-2. Hourly Load-Weighted Average Energy Prices (2022 April – June) 18
Figure 10.0-3. Hourly Load-Weighted Average Energy Prices (2022 July – September) 18
Application – Exhibit D
January 2023 | ii
Final License
Seminoe Pumped Storage Project
List of Acronyms
Applicant Black Canyon Hydro, LLC
BESS Battery Energy Storage Systems
Black Canyon Black Canyon Hydro, LLC
CAES compressed air energy storage
CAISO California Independent System Operator
CCCT combined-cycle combustion turbines DOE U.S. Department of Energy
EPC Engineering, procurement, and construction
FERC Federal Energy Regulatory Commission
FLA Final License Application
FY Fiscal Year
IRP Integrated Resource Plan
ITC investment tax credit
LCOE Levelized Cost of Energy
NREL National Renewable Energy Laboratory
O&M operation and maintenance Project Seminoe Pumped Storage Project
PV solar photovoltaic solar Reclamation U.S. Bureau of Reclamation
SCCT simple-cycle combustion turbine SWPPP Stormwater Pollution Prevention Plan
Units of Measure
kW kilowatt kWh kilowatt hour
kW-yr kilowatt per year
MW megawatt MWh megawatt hours
–
D
January 2023 | iii
Final License Application
Exhibit
Seminoe Pumped Storage Project
1.0 Estimated Cost of New Construction
The following Exhibit discusses the cost and financing of the proposed Seminoe Pumped Storage Project (Project; FERC No. 14787). Black Canyon Hydro, LLC (Black Canyon or Applicant) is proposing the licensing, construction, and operation of the Project which will be located in Carbon County, Wyoming, approximately 35 miles northeast of the City of Rawlins.
Table 1.0-1 provides a summary of total Project construction costs. The table includes the total cost for each major item, interest during construction, and other general expenses. The current estimated cost for construction of the proposed Project is approximately $3.1 billion (Table 1.0-1). These costs are preliminary and subject to change due to market conditions, final Project design, inflation, and other relevant factors.
Table 1.0-1. Estimated Total Cost of New Construction
1.1
Cost of Land and Water Rights
1.1.1 Land
Based on the Fiscal Year (FY) 2022 Annual Update to Fee Schedule for the U.S. of Government Lands, the land cost for Carbon County, Wyoming, is estimated at $8.08 per acre per year (Federal Energy Regulatory Commission [FERC] 2022).
The Project is located largely on Federal lands managed by the U.S. Bureau of Land Management and the U.S. Bureau of Reclamation (Reclamation). Land rental agreements have not yet been finalized for these lands and are subject to those negotiations and final agreement.
1.1.2 Water
The cost associated with securing the water rights for construction, potable purposes, initial fill, and make-up water is variable as there is no standard market rate for the purchase or lease of water. However, the estimated cost to secure water rights for construction and initial fill, based on a previous example of temporary lease of water for industrial purposes, is $75/acre-foot x 14,000 acre-feet = $1,050,000. Potential costs for
Final License Application – Exhibit D
January 2023 | 1
Seminoe Pumped Storage Project
Total Project Costs Cost Estimated Engineering, Procurement, and Construction (EPC) Costs $1,427,702,000 Estimated Indirect Costs $285,500,000 Interest During Construction $528,500,000 Overhead, Construction, Legal Expenses, and Contingencies $890,690,000 Total $3,132,392,000
1.2
initial fill could be higher. The cost to secure long-term, make-up water is still under consideration with estimates depending on if make-up water is annually leased or a permanent water right is purchased. Using the same lease rate for annual make-up water leads to an estimated annual expense of between $30,000 - $50,000 ($75/acre-foot x 400 to 650 acre-feet).
The Applicant is currently negotiating a water supply agreement for initial fill water to be sourced from Seminoe Reservoir. Black Canyon is also negotiating a water supply agreement for the option to annually purchase make-up water, and is still considering the option of purchasing and permitting its own water right for long-term use and make-up water.
Estimated Total Cost of Major Project Works
1.3
Estimated Indirect Construction Costs
The
1.4
Interest During Construction
Interest during construction is estimated at approximately $528,500,000 in 2022 dollars.
Final License Application – Exhibit D
January 2023 | 2
Seminoe Pumped Storage Project
Major Project Works Estimated Cost Project EPC Costs Cost 330 General
331 Powerhouse
332 Reservoirs, Dams, & Waterways
333 Waterwheels, Turbines, Generator
334 Accessory Electrical Equipment
335 Miscellaneous Power Plant Equipment
336 Roads
354 Transmission Towers
356 Conductors
399 General Plant
Total
The current estimated cost of major Project works is approximately $1.43 billion, as presented in Table 1.2-1 Table 1.2-1
$30,500,000
$264,882,000
$664,852,000
$253,848,000
$76,145,000
$44,607,000
$4,759,000
$51,480,000
$26,074,000
$10,555,000
$1,427,702,000
current estimated cost of indirect Project construction is approximately $285,500,000 in 2022 dollars.
1.5 Overhead, Construction, Legal Expenses, and Contingencies
The current estimated overhead, construction, legal expenses, and contingencies are approximately $890,690,000 as presented in Table 1.51.5-1 below.
Table
1.6 Investment Tax Credit
The Inflation Reduction Act of 2022, which went into effect on August 16, 2022, establishes an Investment Tax Credit (ITC) for stand-alone energy storage, including pumped storage. The base credit is 6 percent, to which a 5x multiplier is applied for meeting prevailing wage and apprenticeship requirements, which brings the ITC to 30 percent. There are also 10 percent bonus adders for location in what the Act defines as an Energy Community and for meeting a certain threshold for the value of domestic content used in construction of the facility. The Project is expected to qualify for the 6 percent base, the 5x multiplier (bringing the base to 30 percent), the 10 percent bonus for Energy Community, and the 10 percent bonus for domestic content, bringing the total ITC to 50 percent
2.0
Cost of Existing Structures and Facilities
The Project will use the existing Seminoe Reservoir as the Project’s lower reservoir. The lower reservoir is not located within the Project Boundary. Seminoe Reservoir is managed by Reclamation as part of the Kendrick Project on the North Platte River. The Kendrick Project was authorized by Congress in 1933 and $12 million was appropriated for its construction (Klajic 2000). Reclamation operates Seminoe Dam and Reservoir for irrigation and electric power generation. Current Reclamation operations will not be affected by the Project’s pumped storage operations.
3.0 Federal Takeover
The Applicant is filing for an original license; therefore, the information required in this section is not applicable.
Final License Application – Exhibit D
Pumped Storage Project January 2023 | 3
Seminoe
Cost Allowances $513,000,000 Markups $377,690,000 Total $890,690,000
1.51.5-1. Estimated Overhead, Construction, Legal Expenses, and Contingencies Project EPC Costs
Note: Estimated allowances include unlisted items (10%), civil contingency (20%), and electrical & mechanical contingency (10%). Estimated markups include Contractor home office and profit (12.5%), contractor insurance (3%), and sales tax (6%).
4.0 Estimated Annual Costs
Table 4.0-1 contains the average annual costs of the Project. The operation and maintenance expenses for environmental measures are specified in Table 4.1-1 and included in total costs in Table 4.0-1. All costs shown are a 45-year average annual cost proxy, including cost escalation.
Environmental measures not included in the operation and maintenance costs listed in Table 4.0-1 are measures that will be enacted during construction (and, therefore, are a one-time cost) and for a specified short period after construction, not for the life of the Project. For example, revegetation of areas disturbed during construction is not included below. The operation and maintenance costs shown in Table 4.0-1 are for the first year of operation; after the first year, an escalation rate of 2.0 percent was assumed for all annual costs.
The Project is assumed to be completely balance sheet financed by the Applicant and will not rely on long-term debt financing. Therefore, there is no annual financing cost. The equity return assumed at this time is 10 percent but is subject to market forces between now and completion of Project construction that may raise or lower this value.
Table 4.0-1. Average Annual Cost from Completion of Project Construction to Expiration of Original License
4.1 Costs of Environmental Measures
Table 4.1-1 is a summary of the Black Canyon’s estimated costs for the Project’s proposed environmental measures. The capital costs of environmental measures listed in Table 4.1-1 are the costs expected at the time the measures will be implemented, with sufficient contingency added for the measures to be completed. Capital costs for environmental measures are subject to change based on additional comments and consultation during the FERC licensing process.
Final License Application – Exhibit D Seminoe Pumped Storage Project January 2023 | 4
Cost of Capital $320,000,000 Local, state, and Federal taxes $8,000,000 Depreciation or amortization $84,700,000 Operation and maintenance expenses $38,200,000 Proposed environmental measures $278,000 Total average cost
Annual Cost Items 50 Year Average Annual Cost
$451,148,000
Final License Application – Exhibit D Seminoe Pumped Storage Project January 2023 | 5
3.
4.
5. Transmission
6.
7.
8.
9.
11.
12.
13.
17.
18.
19. Traffic
22.
23.
25.
26.
27.
28.
Table 4.1-1. Proposed Environmental Measures and Estimated Costs. Number Enhancement/Mitigation Measures Capital (2022$) Annual Cost (2022$) 1. Erosion and Sediment Control Plan $200,000 $20,000 2. Stormwater Pollution Prevention Plan (SWPPP) $50,000 $5,000
Hazardous Substances Spill Prevention and Cleanup Plan $45,000 $20,000
Pre- and Post-Construction Stream Flow Monitoring $20,000 $0
Line Design $01 $01
Fish Exclusion Measures $400,000 $10,000
Aquatic Invasive Species Plan $50,000 $10,000
Habitat Restoration, Reclamation, and Enhancement Plan $100,000 $20,000
Biological Resources Protection Training Program $50,000 $0 10. Pre-Construction Surveys $500,000 $0
Noxious Weed Management Plan $100,000 $20,000
RTE Plant Management Plan $40,000 $5,000
Fire Prevention and Protection Plan $20,000 $8,000 14. Upper Reservoir Wildlife Exclusion $150,000 $5,000 15. Raptor-Safe Transmission Line Structures $1,720,000 $0 16. Sage Grouse Management $3,000,000 $10,000
Post-Construction Surveys $40,000 $0
Wildlife Seasonal Restrictions $01 $01
Management Plan $150,000 $20,000 20. Biological Construction Monitors $3,100,000 $0 21. Raptor Protection Plan $40,000 $5,000
Outdoor Lighting Plan $01 $01
Public Access $250,000 $1,000 24. Historic Properties Management Plan (HPMP) $3,850,000 $5,000
Paleontological Monitoring $2,000,000 $0
Visual Resources $1,100,000 $0
Air Pollution Control Plan $200,000 $0
Noise $01 $01 Total: $17,175,000 $164,000 1 Cost of this measure is included in the Project’s capital cost.
5.0 Estimated Annual Value of Project Power
The future energy supply in Wyoming and the greater regional market will be increasingly supplied by wind and solar resources, which are non-dispatchable, intermittent, and variable in nature but have become the lowest cost sources of energy.1 Large-scale energy storage must be developed to provide resiliency and reliability to an electric grid increasingly powered by intermittent renewable energies. Wyoming currently does not have a requirement or goal to generate a certain amount of the State’s electricity from renewable energy (U.S. Energy Information Administration 2021). However, PacifiCorp the utility with which the Project will interconnect and the dominant utility serving Wyoming and the major load centers in Utah has chosen a path to decarbonization that entails closing coal-fired generating plants and adding significant amounts of renewable energy, as detailed in their 2021 Integrated Resource Plan (IRP) (PacifiCorp 2021).
Beginning in 2017, PacifiCorp more than doubled wind energy production and constructed a key segment of the Energy Gateway transmission projects, including four new wind projects in Wyoming: Cedar Springs 1, Cedar Springs 2, Ekola Flats, and TB Flats; totaling 1,150 megawatts (MW) of new generating capacity
This level of renewable energy development in Wyoming is indicative of the regional and national, policy- and economics-driven decarbonization of energy generation. This change in energy supply is driving the need for new energy storage capacity to help integrate intermittent generation and maintain a stable, reliable electric grid. Since the utilization of conventional fossil fuel-based options for firm, dispatchable capacity (i.e., combustion turbines) is expected to decline significantly, the benchmark for dispatchable capacity will be energy storage resources utilizing low-cost, renewable energy as their charging source. The market value of Project power will thus be benchmarked on the cost of equivalent energy storage serving as future firm, dispatchable capacity.
The Project is sited within PacifiCorp’s service territory, interconnecting to the Aeolus Substation. The Gateway South line that will originate at the Aeolus Substation will be the primary means of delivering this new source of renewable energy to Northern Utah. As a result, the focus of this analysis relies heavily on PacifiCorp’s current IRP PacifiCorp’s resource planning documents, including their 2021 IRP, indicate significant planned reliance on new energy storage capacity over the next two decades (Figure 5.0-1) Also, significant amounts of lithium-ion Battery Energy Storage Systems (BESS) are expected to be added to other regional utility portfolios. When evaluating the annual value of Project power, the most appropriate comparative benchmark is an energy storage project that utilizes BESS technology This cost comparison is based on the capital cost for an equivalent storage duration over a time span equivalent to the useful life of the Project, along with fixed operation and maintenance (O&M) costs
1 New solar development in PacifiCorp’s preferred portfolio is paired with new storage resources (i.e., batteries) (PacifiCorp 2021). Therefore, projected portfolio plans for wind generation, rather than solar, are discussed in this section.
Final License Application – Exhibit D Seminoe Pumped Storage Project January 2023 | 6
Source: PacifiCorp 2021
Figure 5.0-1. PacifiCorp’s 2021 IRP Preferred Portfolio New Storage Capacity BESS Cost Projections

5.1 Adjusting BESS Costs for Comparison
5.1.1 Baseline BESS Cost Projections
PacifiCorp’s 2021 IRP uses a figure of $1,820 per kilowatt (kW) for a 50 MW x 4-hour lithium-ion BESS, or $455/per kilowatt hour (kWh), with a design life of 20 years. Energycomponent costs for BESS are forecasted to continue to decline through the early 2030s before leveling out. National Renewable Energy Laboratory (NREL) (2021) projects a 2030 capital cost of ~$1,200/kW (in 2020 dollars) for a 6-hour, lithium-ion BESS.
5.1.2
Adjustment for Duration Comparison
Duration is the amount of time an energy storage device or facility can generate and transmit electricity to the grid at full output. The Project will have a full-capacity storage duration of 10 hours. Most BESS being installed today have storage durations of 2 to 4 hours. As electricity is increasingly generated from variable and non-dispatchable generation sources, grid requirements to balance supply and demand, while maintaining a reliable and stable system, will increasingly require longer than 2 to 4 hours of energy storage duration.
To compare the cost of the Project with a BESS alternative, a BESS storage duration of 10 hours should be assumed, with adequate augmentation required to maintain a full 10 hours over the operating life of the BESS. The NREL projections for 6 hours cited above can be extrapolated to ~$2,000/kW for a 10-hour duration system. This is equivalent to $200/kWh of storage capacity in 2030. The estimated cost for the Project, entering operation in 2030, is approximately $311/kWh of storage capacity. These figures, however, do not provide a sufficient basis for comparison because they do not include the significant lifespan difference between the technologies, which is addressed below.
Final License Application – Exhibit D
Storage Project January 2023 | 7
Seminoe Pumped
5.1.3 Adjustment for Lifespan Comparison
BESS systems are known to have a substantially shorter lifespan than pumped storage plants. Figures vary, but NREL’s 2021 Update of Cost Projections for Utility-Scale Battery Storage selects a figure of 15 years from among a range of estimates in other studies. PacifiCorp’s 2021 IRP assumes a design life of 20 years, while Idaho Power’s 2021 IRP uses 15 years (Idaho Power 2021) These compare with a lifespan of over 100 years for pumped storage. To conservatively compare the costs, a 50-year period and two BESS system replacements (i.e., three installations) should be used. Fixed O&M can be estimated at $20/kW-yr for the pumped storage and $30/kW-yr for the BESS. Applying a 5 percent discount rate, the pumped storage has a lower Project cost over the 50-year period, which is only half of its true expected life
The ITC for stand-alone storage will provide greater advantage to pumped storage than to BESS systems, for two reasons. The first is that pumped storage cost is more front-loaded than that of batteries, while lifespan is significantly longer. The ITC will thus have a greater cost-reduction effect for pumped storage. The second reason is that pumped storage is very likely to qualify for the 10 percent bonus adder for domestic content, while battery supply chains are not close to reaching the threshold needed to qualify for that bonus.
5.2
DOE 2020 Comparison
For another basis of comparison, the Department of Energy’s (DOE) 2020 Grid Energy Storage Technology Cost and Performance Assessment (Dec 2020) (DOE 2020) includes projected costs for an 8-hour, lithium-ion BESS, using the Lithium iron phosphate chemistry that is expected to become dominant. The total installed cost for the BESS is $2,131/kW, or $266/kWh. However, the calendar life estimated for the BESS is 10 years (2,100 cycles). In its storage technology assessment, DOE assumes the calendar life for pumped storage is 40 years and 13,870 cycles (DOE 2020). Thus, when the figures are annualized, the cost for pumped storage using figures similar to those for the Project is shown to be much lower (Figure 5.2-1)
Final License Application – Exhibit D
Storage Project January 2023 | 8
Seminoe Pumped
Source: DOE 2020. LCOE – Levelized Cost of Energy Figure 5.2-1. Annualized Cost and Levelized Cost Comparisons of Energy Storage Technologies

5.3
Investment Tax Credit: Benefits to BESS vs. Pumped Storage
The Inflation Reduction Act of 2022, which went into effect on August 16, 2022, establishes an ITC for stand-alone energy storage, including pumped storage. The Project is expected to qualify for the 6 percent base, the 5x multiplier (bringing the base to 30 percent), the 10 percent bonus for Energy Community, and the 10 percent bonus for domestic content, bringing the total ITC to 50 percent Since pumped storage costs are more front-loaded versus that of batteries, pumped storage would likely obtain greater benefit from an ITC due to the ITC being applied to more of the Project net present value.
5.4 Energy Value
The cost of charging energy can be assumed to be the same for pumped storage and for BESS. Furthermore, since the differential between peak and off-peak energy value is expected to be relatively low and similar for each technology, the value of Project energy will not be separated from the value of Project capacity. Differences in efficiency will be nominal. While BESS has slightly higher round-trip efficiency than pumped storage, BESS will incur some efficiency degradation through cycling, while pumped storage will not.
Final License Application – Exhibit D
Storage Project January 2023 | 9
Seminoe Pumped
5.5 Ancillary Services Value
The Project will be able to provide a wide range of ancillary services, from frequency regulation and voltage support to spinning reserve. Unlike in organized markets such as the California Independent System Operator (CAISO), the value of these services is not quantified in most of the rest of the western region, including Wyoming. Furthermore, the total market for ancillary services is relatively small, particularly for frequency regulation, which has historically been the most lucrative of services in other regions. Therefore, the value of ancillary services provided by the Project while important is not a decisive factor in the value of the Project to the region, and Black Canyon does not attempt to quantify it here.
5.6 Costs of Conventional Alternatives
Comparison to conventional peaking resources such as combustion turbines or reciprocating engines would indicate a higher capital cost for the Project than these types of resources on a $/kW basis. For example, PacifiCorp’s 2021 IRP estimates the annual fixed cost for an “F” frame simple-cycle combustion turbine (SCCT) at $73.70/kW-yr in 2025. This, of course, does not include fuel cost and variable O&M. For a reciprocating engine, which is more flexible and efficient than a gas turbine, and thus may represent a better proxy for renewable-paired dispatchable capacity, PacifiCorp IRP’s estimated cost is $1,938/kW, with total annual fixed cost at $152.62/kW-yr.
For a more accurate comparison with these types of resources, the cost of energy (or a per-megawatt hour [MWh]-generated) should be determined along with cost of capacity. The energy used for pumping (the “fuel”) is most likely to be wind over-generation or excess solar energy that is already resulting in “negative pricing” (i.e., cost of energy below zero) in many markets, and which unused, may be subject to curtailment. In fact, there will usually be some net gain in value due to the shift in time of delivery and avoidance of curtailment of renewable resources through utilization for charging. Therefore, the cost of charging/pumping energy that can be assigned to the Project can be assumed to be very low for purposes of estimating total product cost and value
PacifiCorp’s 2021 IRP calculates the first-year total resource cost of the SCCT at $73.95/ MWh, assuming a 33 percent capacity factor. The estimate for a reciprocating engine, assuming the same capacity factor, is $90.69/MWh. If the Project were operated at its full capacity 365 days a year, it would also have a capacity factor of 33 percent. At a fixed cost of $230/kW-yr and energy value set at zero, the resource cost in $/MWh would be $79.50 higher than that of an SCCT, but considerably lower than that of a reciprocating engine set.
Operating costs for gas-fired generation resources are subject to fuel price variability. They also have shorter useful lives than pumped storage, at 35 and 40 years, respectively, for SCCT and reciprocating engines. More important to the analysis, however, is that their operation emits significant amounts of carbon dioxide. Concern about anthropogenic climate change has made greenhouse gas emissions a major liability and has driven sweeping energy policy changes across the U.S. Accounting for the gas-fired generation resources cost of carbon, let alone the lifespan difference and reduced ability to manage
Final License Application – Exhibit D Seminoe Pumped Storage Project January 2023 | 10
and make more effective use of renewable sources, effectively renders a lower value option (and potentially a liability or stranded assets at best) compared to the Project.
For the foregoing reasons, gas-fired generation resources no longer represent the benchmark for new utility supply-side options. The transition to low-carbon and no-carbon futures, either though state mandate or as policy chosen by individual utilities, means that utilities are reducing or eliminating the use of fossil-fueled resource additions to meet capacity needs. This shift is being reflected in most utility resource plans.
Instead, energy storage is regarded as essential to utilizing the massive amount of variable and intermittent renewable energy primarily solar and wind that is being added to the grid. Conventional peaking resources can be dispatched when those resources are unavailable, but cannot provide the zero-emission, time-shifting capability or flexibility of energy storage.
5.7 Summary: Estimated Annual Value of Project Power
• The estimated annual value of Project power is based on the value of capacity in the expected high-renewable environment, with minimal reliance in valuation on energy costs and ancillary services value that may have traditionally been used to estimate pumped storage annual value.
• Given regional decarbonization plans and the transition to renewable resources as the dominant energy supply, dispatchable energy storage options become the benchmark for capacity. Other pumped storage projects have been proposed in the region, but they are in an early stage of planning and Black Canyon cannot speculate on their cost or likelihood of development. Therefore, to establish a benchmark for comparison, Black Canyon uses BESS specifically lithium-ion systems as a benchmark for comparison of the value of Project power.
• Based on an equivalent energy storage duration, lithium-ion in 2030 may have a lower cost for an equivalent amount of capacity. However, lithium-ion systems have a lifespan of 10 to 20 years, while pumped storage has a useful life of 100 years.
• Based on the storage duration and difference in useful life, the proposed Project would have a total lower cost of power than BESS, and would, in effect, establish the benchmark for capacity value for long-duration (10 hour), long-life storage (and generation) assets in a high-renewables regime.
• Assuming an 8 percent carrying charge rate to the estimated total Project capital cost of $3,110/kW, this results in an annual cost of $249/kW-yr, to which fixed O&M of $20/kW-yr is added for a total of $269/kW-yr
Final License Application – Exhibit D
January 2023 | 11
Seminoe Pumped Storage Project
6.0 Cost of Energy Alternatives
Other electric energy alternatives are discussed below.
6.1 Fossil-Based Generation
Coal-fired steam generation provides large-scale baseload energy, serving a different function in an energy supply portfolio than pumped storage. As a major source of greenhouse gas emissions, coal-fired generation in the market region for the Project is being phased out and there are no new plans for new coal-fired capacity additions. Coal is, therefore, not a viable alternative to the Project.
Gas-fired power plants include SCCT, combined-cycle combustion turbines (CCCT), and internal combustion reciprocating engines. Gas-fired generation has provided most of the peaking and intermediate capacity in the western market since the 1990s. CCCT plants are used for intermediate-to-baseload service. SCCTs, including frame turbines and aeroderivatives, are used for peaking power and are lower in initial capital cost than pumped storage. However, similarly to CCCT plants, they are significant sources of greenhouse gas emissions and their inclusion in regional resource plans is being scaled back dramatically. Furthermore, while they can be used to follow variations in solar and wind output, they do not provide the energy storage function that will be critical for integrating large amounts of renewable resources. Gas-fired generation is, therefore, not a viable alternative to the Project.
6.2 Nuclear Power
Nuclear fission power plants have provided baseload energy in many regions of the U.S. since the 1970s and several plants operate in California, Arizona, and Washington. Due to policy changes, safety concerns, or economic factors, the two nuclear plants in California are being or have been retired.
While being carbon-free sources of generation, nuclear power plants using existing technology are large, have a long development timeline, and require significant capital investments. Disposal of nuclear waste is also a significant concern. Wyoming is the largest domestic producer of uranium used for conventional nuclear fission power plants; however, the state does not have any existing fission plants. One small, modular nuclear reactor is currently proposed in Wyoming. The 345 MW Natrium power plant is based on new technology using molten salts as a heat source. Cost estimates for pilot plants such as the Natrium power plant are high and they will need to be operated at a close to baseload capacity factor to keep the cost of energy at a competitive level.
Nuclear generation is a baseload resource and does not provide the flexible energy storage services that will be required to integrate large amounts of renewable energy. This fact, combined with cost, ongoing concerns about waste disposal, and the experimental nature of new nuclear technology options, indicates that nuclear power is not a viable alternative to the Project.
Final License Application – Exhibit D Seminoe Pumped Storage Project January 2023 | 12
6.3 Renewable Resources
Solar energy, particularly photovoltaic solar (PV solar), is emerging as a dominant new form of electric energy supply across the U.S., particularly in the western U.S. It is one of the lowest cost energy sources available today and entails no greenhouse gas emissions. Solar output is also somewhat predictable, with only cloud cover interrupting normal patterns of generation. However, those normal patterns involve a mid-day output peak, which does not coincide with peak demand, and no generation at all during the night. The result is the well-established “duck curve,” with a steep ramp up needed for generating capacity that aligns with increasing load in the early evening. Since PV solar is not a firm or dispatchable generation alternative, it is not a viable alternative to the Project. In fact, for the reasons given, PV solar is a major driver of the need for energy storage resources like the proposed Project.
Wind energy is the other leading source of carbon-free energy seeing widespread deployment today. Where the wind resource is of high quality, the cost of wind energy is very low. Wind energy viability is particularly high in Wyoming, possessing high average annual wind speeds of 6.5 meters per second or higher at 80 meters above ground surface in over half of the State by area (Tetra Tech 2021). Therefore, Wyoming is likely to export wind energy production to other states. Furthermore, like PV solar, wind energy is not dispatchable, and it has a much lower ability than solar to predictably match demand. Like solar, therefore, the use of wind energy, particularly in Wyoming, is a major driver of the need for energy storage resources like the proposed Project.
Wyoming’s geothermal resources are used for direct heating applications, mainly in Yellowstone National Park and Hot Springs State Park, and do not have adequate resources for commercial electricity generation (State of Wyoming Geological Survey 2015). However, the economics of geothermal power require that it operates as a baseload facility. Geothermal resources are site specific and require significant lead times and development risk. More generally, the cost of geothermal generation is depressing its inclusion in most resource plans. For these reasons, and since geothermal generation is generally baseload in nature and not able to provide the energy storage services needed for integrating other renewable resources, geothermal is not a viable generation alternative to the Project.
Conventional hydroelectric power has provided relatively firm, carbon-free energy in parts of the western U.S., specifically the Pacific Northwest, California, and Colorado, for many decades. Wyoming currently has 21 dams that generate power, most of which are owned and operated by the Federal government. Across a wider region, there is some potential for new, small hydropower additions to non-powered dams, but there are no plans for major hydropower projects akin to those developed in other parts of the west in earlier generations. Due to the limited potential of future large hydropower developments, openloop pumped storage developments serve as opportunities to better utilize existing hydropower developments in Wyoming.
The lack of viable development opportunities for new major hydroelectric power sources in the western region, along with the other reasons given here, mean that conventional hydroelectric power is not a viable generation alternative to the Project.
Final License Application – Exhibit D Seminoe Pumped Storage Project January 2023 | 13
6.4 Other Pumped Storage
The viability of pumped storage projects requires a relatively rare combination of factors to be present, including suitable topography and geology, land availability, a source of fill water, an acceptable level of environmental impact, correct sizing for the market, and interconnection options. No major pumped storage projects have been constructed in the U.S. since 1995, and relatively few proposed pumped storage projects advance to development and receiving a FERC license. There are only three pumped storage projects in the Western Electricity Coordinating Council region that recently have received a FERC license: Eagle Mountain in California, Swan Lake North in Oregon, and Gordon Butte in Montana. Construction has not commenced at any of these projects.
Within the State of Wyoming, there are currently three preliminary permits pending or recently granted for other proposed pumped storage projects: P-15244, P-15247, and P-15253. Two involve closed-loop concepts and one is an off-stream (open loop) concept similar in concept to the Project. Each of these projects has a proposed generation capacity of 500 MW. Recently, a Notice of Decision Not to Proceed was filed for a 400 MW, closed-loop concept in Wyoming under P-14853 due to landownership and access issues. Pumped storage projects at the preliminary permit stage are considered speculative and, as of the time of this writing, none of these concepts have advanced beyond this phase.
Based on both their early stage of development and smaller project sizes, it is Black Canyon’s estimation that no pumped storage projects are currently proposed in Wyoming with an equivalent or superior level of viability as that represented by the Project.
6.5 Other Energy Storage Technologies
BESS are seeing increasing deployment, primarily in the form of lithium-ion batteries paired with PV solar. The cost of batteries has fallen significantly over the past several years and costs are forecasted to continue to decline. Standalone battery projects are being constructed at the scale of hundreds of MW, and projects of 1 gigawatt have been proposed. These systems generally have storage durations of 2 to 4 hours.
Like pumped storage projects, BESS represent dispatchable capacity that helps to integrate carbon-free renewable resources and will thus see significant deployment across the market. Compared with pumped storage, BESS have the advantage of shorter development times, modularity, and flexibility of location. However, BESS have substantial disadvantages compared to the Project:
• Higher cost at longer durations of storage (duration will be increasingly important as renewable energy penetration increases);
• Significantly shorter useful life (10 to 20 years, depending on cycling);
• Degradation of storage capacity and efficiency through use (resulting in a higher fixed O&M cost for augmentation);
• Environmental impacts from mining of battery materials and the lack of methods for recycling spent battery cells;
Final License Application – Exhibit D
Storage
January 2023 | 14
Seminoe Pumped
Project
• Future supply risks associated with competition for materials (lithium and other materials) and policy considerations (e.g., reliance on raw materials and manufacturing in China). Evidence of this risk is seen in recent industry studies showing a slowdown in battery price decline due to rising commodity prices and reduced production; and
• An inability to supply inertia to the grid.
Using lithium-ion as a benchmark for comparison (see Section 5.0 of this Exhibit), the Project represents a lower long-term, long-duration cost of storage than utility-scale batteries when viewed through the energy or MWh lens
Other energy storage technologies, such as new battery technologies, hydrogen-based systems, and mechanical systems like rail energy storage and systems that lift and lower concrete blocks, are generally only at the demonstration or research and development stage and do not represent commercially available alternatives to the Project.
Compressed air energy storage (CAES) is the only other long-duration energy storage technology with an established track record, but this technology requires very specific and rare geology. The CAES technology available today also requires some combustion of natural gas, a source of greenhouse gases. A CAES project in Utah is being developed for the only known “Gulf Coast” style domal-quality salt formation in the western U S There are no known active proposals for CAES projects in Wyoming.
6.6 Conclusion
While BESS are the most likely alternative to the Project in terms of addressing utility and market needs for a distributed storage solution in the emerging low-carbon market, the advantages afforded by pumped storage where it can be built make the Project an exceptional opportunity for meeting the needs of Wyoming and the greater regional energy market.
There are currently no proposed projects that could provide the same benefit to optimizing regional diversity of renewable energy siting and existing and new transmission in the region. Therefore, no other pumped storage project in Wyoming is a viable generation alternative to the Project.
7.0 Consequences of Denial of License Application
If the license application is denied and the Project is not constructed, consequences would include the following:
• The region would be more restricted in its choice of tools for integrating and firming renewable resources, placing more reliance on a technology (batteries) that is more expensive over the long-term than the proposed Project and which entails risks for ratepayers and the environment.
Final License Application – Exhibit D
January 2023 | 15
Seminoe Pumped Storage Project
8.0
• Transmission build-out planned for the area could see less effective utilization from technical and economic standpoints. The proposed Project and its point of interconnection are located at an emerging strategic crossroads of transmission development that is intended to facilitate the movement and delivery of low-carbon energy resources throughout the region. License denial and consequent nonconstruction of the Project would eliminate the potential for a major management tool for numerous regional entities responsible for the procurement and delivery of power.
• Carbon County would lose property tax revenues in the amount of hundreds of millions of dollars over the life of the Project, along with thousands of employment job-years in construction and operation and associated indirect income and spending.
• If the proposed Project were not constructed, the Project site would likely remain undeveloped, with the upper reservoir area continuing to be used for hunting and grazing activity.
Financing
Project construction will be financed through a combination of debt and equity. As described in Section 5.0 of this Exhibit, value streams projected based primarily on new capacity costs and secondarily on ancillary services value and time of day energy value differentials are expected to justify Project initial investment and long-term operating costs. A power sale structure with a utility off-taker would most likely take the form of a long-term tolling agreement that covers fixed costs and O&M. Under a utility ownership structure, the utility off-taker will most likely rate-base the asset based on a justified ratio of cost and benefit compared with alternatives in the future market environment.
9.0 Cost to Develop the License Application
The estimated cost to develop the license application is $3 million.
10.0 On-Peak and Off-Peak Value of Project Power
As described in Section 5.0 of this Exhibit, the primary value stream for a new pumped storage project in a high-renewable/low-carbon system is expected to be the ability to dispatch firm generation on demand (i.e., capacity) rather than the direct capture of the difference in value between peak and off-peak energy (arbitrage). Part of the reason for this has been a declining spread between peak and off-peak over the past two decades. Another factor driving the emphasis on capacity value rather than arbitrage is that the cost of wind and solar energy today is below $30/MWh, and this low cost of energy is expected to be consistent throughout the future market environment of the Project.
Final License Application – Exhibit D
Storage
January 2023 | 16
Seminoe Pumped
Project
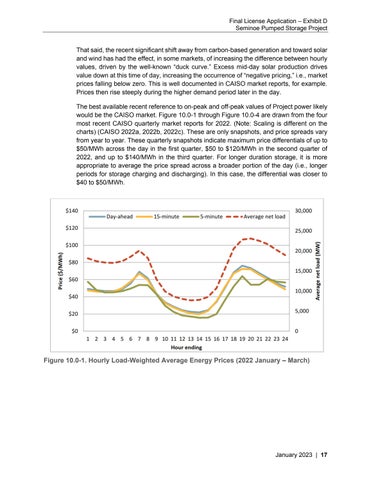
That said, the recent significant shift away from carbon-based generation and toward solar and wind has had the effect, in some markets, of increasing the difference between hourly values, driven by the well-known “duck curve.” Excess mid-day solar production drives value down at this time of day, increasing the occurrence of “negative pricing,” i.e., market prices falling below zero. This is well documented in CAISO market reports, for example. Prices then rise steeply during the higher demand period later in the day

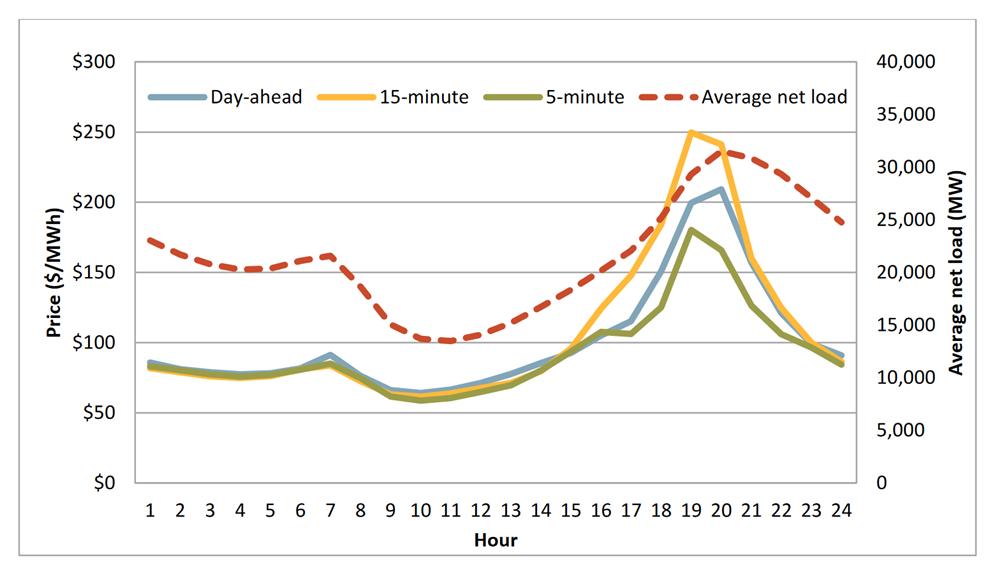
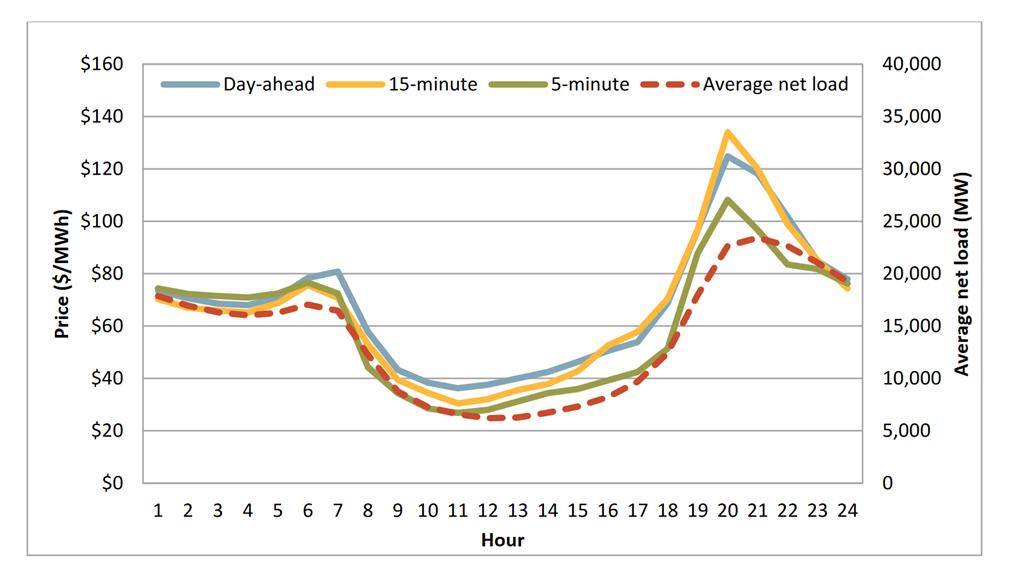
The best available recent reference to on-peak and off-peak values of Project power likely would be the CAISO market. Figure 10.0-1 through Figure 10.0-4 are drawn from the four most recent CAISO quarterly market reports for 2022. (Note: Scaling is different on the charts) (CAISO 2022a, 2022b, 2022c). These are only snapshots, and price spreads vary from year to year. These quarterly snapshots indicate maximum price differentials of up to $50/MWh across the day in the first quarter, $50 to $120/MWh in the second quarter of 2022, and up to $140/MWh in the third quarter. For longer duration storage, it is more appropriate to average the price spread across a broader portion of the day (i.e., longer periods for storage charging and discharging). In this case, the differential was closer to $40 to $50/MWh.
Figure 10.0-1. Hourly Load-Weighted Average Energy Prices (2022 January – March)
Final License Application – Exhibit D
January 2023 | 17
Seminoe Pumped Storage Project
Figure 10.0-2. Hourly Load-Weighted Average Energy Prices (2022 April – June)
Figure 10.0-3. Hourly Load-Weighted Average Energy Prices (2022 July – September)
License Application – Exhibit D
Project January 2023 | 18
Final
Seminoe Pumped Storage
To reiterate, while the “duck curve” may increase these price spreads in the future, Black Canyon estimates that the primary market value of the Project will derive from capacity value rather than from arbitrage.
11.0 Literature Cited
California Independent System Operator (CAISO). 2022a. ISO Q1 2021 Report on Market Issues and Performance. September 6, 2022.
California Independent System Operator (CAISO). 2022b. ISO Q2 2021 Report on Market Issues and Performance. October 14, 2022.
California Independent System Operator (CAISO). 2022c. ISO Q3 2021 Report on Market Issues and Performance. December 14, 2022
Federal Energy Regulatory Commission (FERC). 2022. FY 2022 Annual Update to Fee Schedule for the US of Government Lands. 18CFR Part 11 [Docket No. RM11-6000].
Idaho Power 2021. 2021 Integrated Resource Plan. December 2021. Klajic, Leisl A. 2000. The Kendrick Project (Casper – Alcova). Bureau of Reclamation History Program, Denver. https://www.usbr.gov/projects/pdf.php?id=128. Accessed April 13, 2022.
National Renewable Energy Laboratory (NREL). 2021. Cost Projections for Utility-Scale Battery Storage. Update, June 2021
PacifiCorp 2021. 2021 Integrated Resource Plan. September 1, 2021. https://www.pacificorp.com/content/dam/pcorp/documents/en/pacificorp/energy/in tegrated-resource-plan/2021-irp/Volume%20I%20-%209.15.2021%20Final.pdf Accessed May 2, 2022.
State of Wyoming Geological Survey. 2015. Potential for Geothermal Energy in Wyoming. April 20, 2015. https:\\www.wsgs.wyo.gov/docs/wsgs-web-geothermal.pdf
Tetra Tech. 2021. Guide to Permitting Solar Energy Projects in Wyoming. Wyoming Renewable Energy Coordination Committee. February 22, 2021. http://www.wyoenergy.org/wp-content/uploads/2021/03/WEA-Solar-PermittingGuide-Final-1.pdf. Assessed January 2022.
U.S. Department of Energy (DOE). 2020. Grid Energy Storage Technology Cost and Performance Assessment. December 2020.
U.S. Energy Information Administration. 2021. Wyoming State Profile and Energy Estimates. March 28, 2021. https://www.eia.gov/state/analysis.php?sid=WY. Accessed January 2022.
Final License Application – Exhibit D Seminoe
Storage Project January 2023 | 19
Pumped