1 minute read
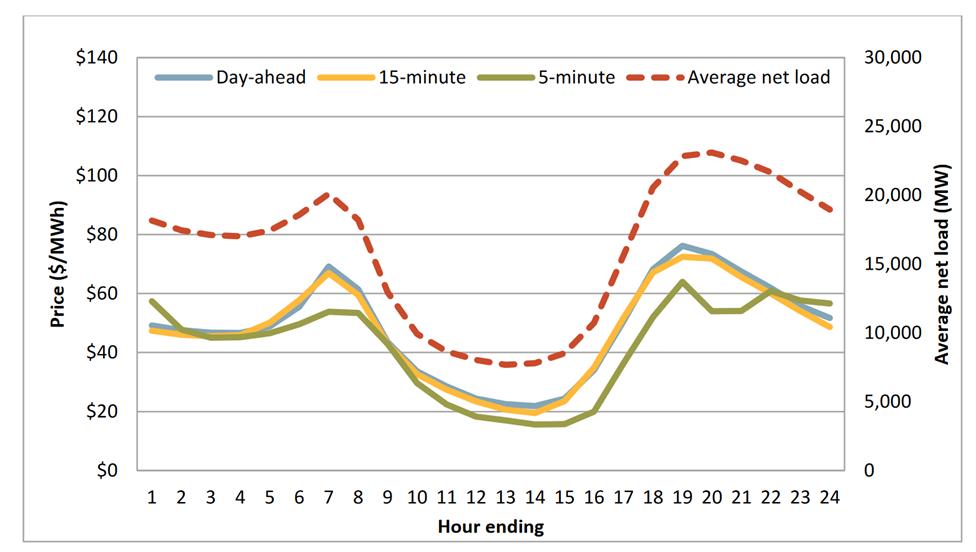
Figure 10.0-1. Hourly Load-Weighted Average Energy Prices (2022 January – March


That said, the recent significant shift away from carbon-based generation and toward solar and wind has had the effect, in some markets, of increasing the difference between hourly values, driven by the well-known “duck curve.” Excess mid-day solar production drives value down at this time of day, increasing the occurrence of “negative pricing,” i.e., market prices falling below zero. This is well documented in CAISO market reports, for example. Prices then rise steeply during the higher demand period later in the day.
The best available recent reference to on-peak and off-peak values of Project power likely would be the CAISO market. Figure 10.0-1 through Figure 10.0-4 are drawn from the four most recent CAISO quarterly market reports for 2022. (Note: Scaling is different on the charts) (CAISO 2022a, 2022b, 2022c). These are only snapshots, and price spreads vary from year to year. These quarterly snapshots indicate maximum price differentials of up to $50/MWh across the day in the first quarter, $50 to $120/MWh in the second quarter of 2022, and up to $140/MWh in the third quarter. For longer duration storage, it is more appropriate to average the price spread across a broader portion of the day (i.e., longer periods for storage charging and discharging). In this case, the differential was closer to $40 to $50/MWh.