
DEEP DIVE CHARTER HALL ON

ACKNOWLEDGEMENTS
EDITOR IN CHIEF: Samuel Yu
AUTHORS: Landrie Zuo, Will Tsui, David Wang, Rose Sabu, Vincent Bui, Tom Xie, Stephanie La, Kobe Choy, Feifei Gao
DESIGNERS: Anneka Cai, Tom Xie, Zachary Ni, Jonathan Chen
DISCLAIMER
1 The information in this free guide is provided for the purpose of education and intended to be of a factual and objective nature only. REISA makes no recommendations or opinions about any particular financial product or class thereof.
2. REISA has monitored the quality of the information provided in this guide. However, REISA does not make any representations or warranty about their accuracy, reliability, currency of completeness of any material in this guide.
3 Whilst REISA has made the effort to ensure the information in this guide was accurate and up to date at the time of the publication of this guide, you should exercise your own independent skill, judgement and research before relying on it This guide is not a substitute for independent professional advice and you should obtain any appropriate professional advice relevant to your particular circumstances.
4. References to other organisations are provided for your convenience. REISA makes no endorsements of these organisations or any other associated organisation, product or service
5. In some cases, the information in this guide may incorporate or summarise views, standards or recommendations of third parties or comprise material contributed by third parties (“third party material”). Such third party material is assembled in good faith, but does not necessarily reflect the views of REISA REISA makes no representations or warranties about the accuracy, reliability, currency or completeness of any third party material.
6 REISA takes no responsibility for any loss resulting from any action taken or reliance made by you on any information in this guide (including without limitation, third party material).


01 COMPANYOVERVIEW
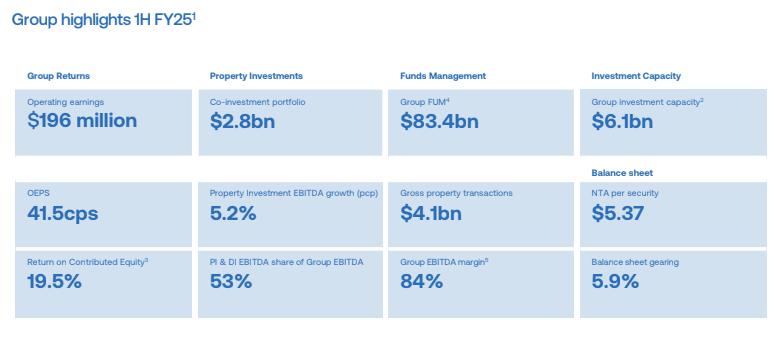
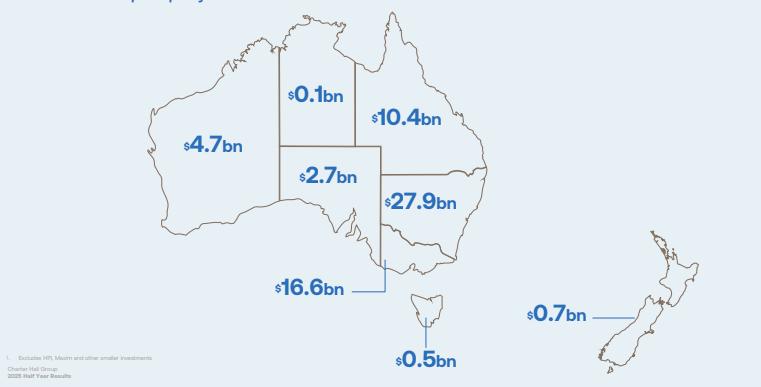
Charter Hall Group (ASX: CHC) is an ASX listed ~$7.6bn market cap Australian diversified real estate manager, investor and developer, consisting of three main operating segments: (1) Investment (2) Funds and (3) Development Operating in Australia & New Zealand, CHC has exposure to industrial, office, retail & social infrastructure subsectors. With the largest national diversified property portfolio, CHC’s presence is heavily concentrated along Australia’s east coast. (1)
Source: 1H25 Presentation

Notes: (1) Capital IQ as at 24 April 2025.
INVESTMENTARM
CHC’s investment arm involves investing off their balance sheet in properties alongside its fund investors and partners. Often taking a minority stake in each vehicle, CHC’s investment earnings involve rental income and share of profits from co-investments. Key drivers for CHC’s investment arm performance include driving stronger occupancy rates and rental yields, maintaining / increasing WALE and managing operation efficiencies / refinancing costs.
As of 1H25, CHC manages a ~$2.7 billion investment portfolio boasting high occupancy rates and weighted average lease expiry (WALE) The portfolio is well-diversified as no single asset accounts for more than 6% of total investments, reducing concentration risk. Importantly, ~25% of portfolio income is derived from government tenants, providing stable, low-risk cash flows that minimise leasing volatility.

Source: Company Filings
Source: Company Filings (2)
FUNDSARM
CHC’s funds arm manages capital on behalf of wholesale, direct and listed funds investors where earnings are primarily generated from management and performance fees. Their listed funds comprise of the three REITs they manage: Charter Hall Retail REIT (ASX: CQR), Charter Hall Long WALE REIT (ASX: CLW) and Charter Hall Social Infrastructure REIT (ASX: CQE) Thus, CHC aims to maximise investor returns through strong asset management capability, which involves leasing, tenant engagement and capital recycling.
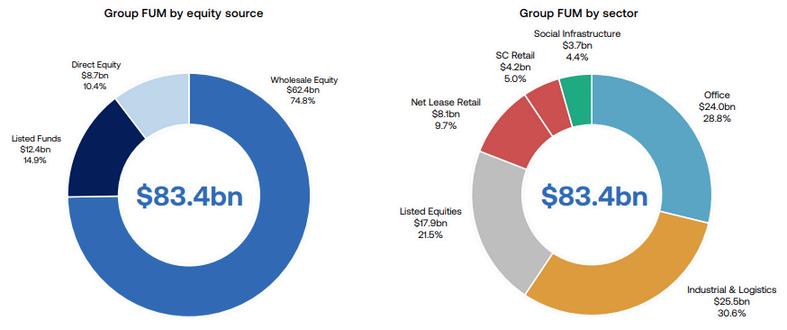
As of 1H25, CHC’s funds management arm manages ~$83.4 billion in third-party capital of which property FUM totals ~$66.4 billion. CHC’s strategy has evidently been successful given their property FUM has a 5-year CAGR of 11 3% This is owed to above-average occupancy rates across all allocations and significant uplift in their industrial portfolio which has experienced 35% like-for-like valuation growth since FY20. This is reinforced by customer diversification where top 20 tenants (55% of property platform income) are represented by Government, multinationals and listed companies. As such, this increases CHC’s investor confidence, reflected in their funds arm receiving $10 7 billion of gross inflows over the past 3.5 years.

Filings
DEVELOPMENTARM
CHC’s development arm is dedicated to site acquisition, planning and construction. Their development earnings predominantly involve development management fees, performance-related revenues from joint ventures and rarely, gains or losses from project sales. Key drivers behind CHC’s development earnings are level of development projects, land and construction costs, property valuations and sustained availability of third party capital to fund development activity.
As of 1H25, CHC has a $13 3 billion development pipeline mainly concentrated in industrial and office developments Notable projects include its flagship Chifley North building expected to have ~$4.0 billion value on completion with an incremental ~$2.0 billion value-add to Chifley South. Within their $6.8 billion Industrial pipeline, CHC continues to increase exposure to alternative real assets, as seen in their current development of 8 core Data Centres.

Source: Company Filings
Company Filings
02 INVESTMENT HIGHLIGHTS
Continued margin expansion across the Group
CHC has successfully achieved margin expansion over the last 5 years. This is evident in their annuity EBITDA margin (excludes transaction and performance fees) expanding by 15 5%
$13bn development pipeline with strong pre-leasing commitments
CHC has experienced strong demand, evident in having already preleased 91% of Industrial committed projects and 73% of Office committed projects. With significant concentration in these sub-sectors, this enables accelerated earnings realisation upon project completion.
Valuation resilience offsetting cap rate movements
Despite market-wide cap rate expansion, CHC has achieved 8.9% likefor-like valuation growth since June 2020 by virtue of higher rental uplifts. The largest movers include Industrial (35.4%), net lease retail (28.4%) and social infrastructure (27.1%). Hence, this underscores CHC’s ability to protect investor capital through market cycles
$11bn in sale & leaseback transactions with blue chip tenants
CHC consistently engages in sale and leaseback transactions with trusted counterparties such as the Australian government. Typically structured as triple net (NNN) leases, this reinforces CHC’s high-margin, low-risk income
03 REALESTATE PORTFOLIOOVERVIEW
Source: 1H25 Presentation

NOTABLEOFFICEASSETS
$24.0 billion portfolio; 95% occupancy; 6.00% cap rate
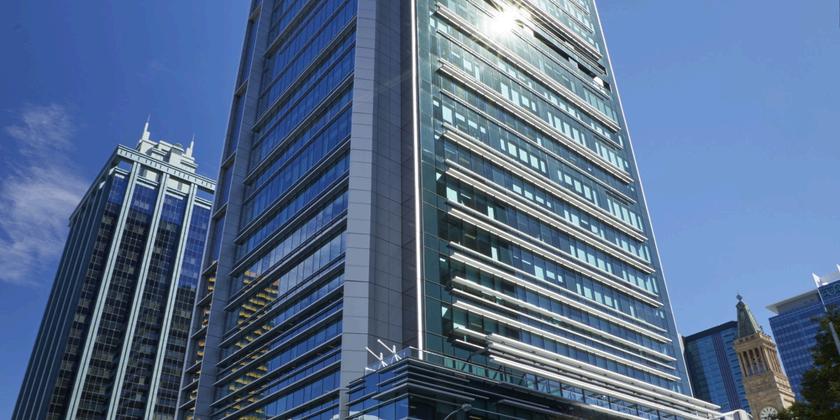
Address: 275 George St Brisbane QLD
NLA: 41,680 sqm
WALE: 5 5 years
Occupancy: 99%
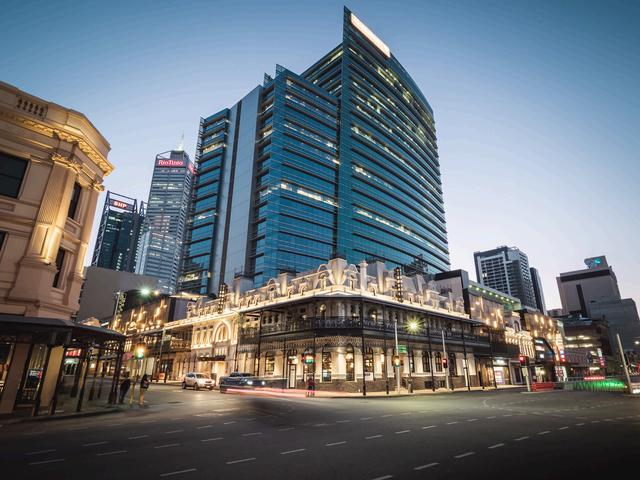
Address: Bankwest Place 300 Murray St, Perth WA
NLA: 44,191 sqm WALE: 6.0 years
Occupancy: 100%
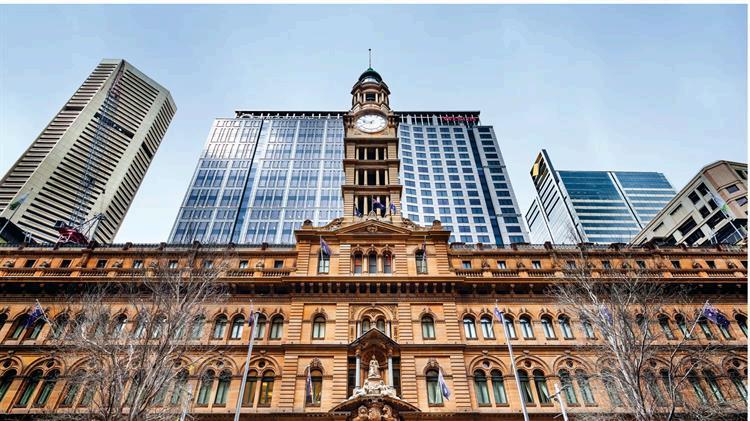
Address: No. 1 Martin Place, Sydney NSW
NLA: 40,171 sqm
WALE: 2 4 years
Occupancy: 100%
$25.5 billion portfolio; 99% occupancy; 5.30% cap rate
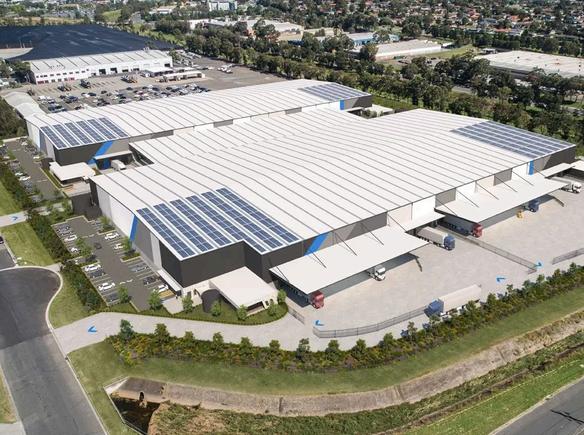
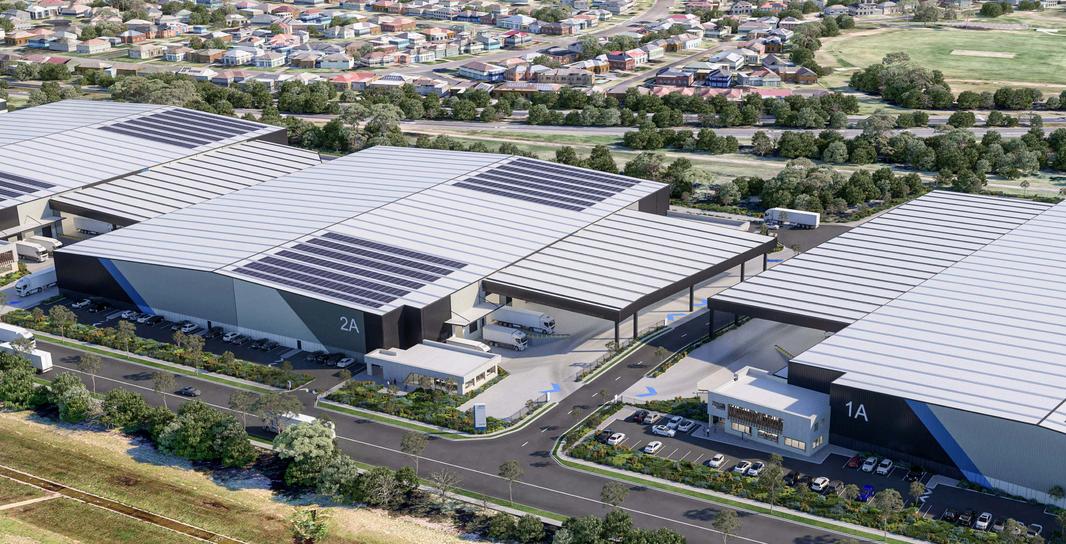
Address: Minto Logistics Hub
NLA: 92,838 sqm
WALE: N/A
Occupancy: N/A
Address: Coles Distribution Centre, Edinburgh SA
Address: Airds Road Logistics Hub, Minto NSW
NLA: 42,658 sqm
WALE: N/A
Occupancy: N/A
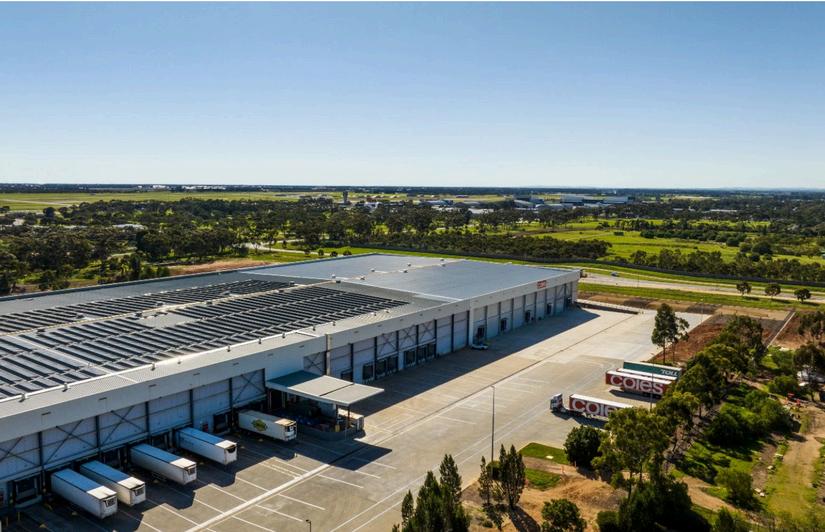
NLA: 77,567 sqm
WALE: N/A
Occupancy: 100%
Notes:
NOTABLERETAILASSETS
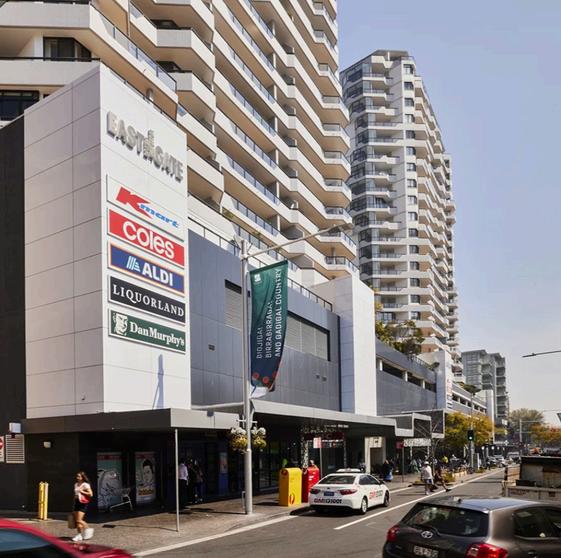
Address: Eastgate Bondi Junction, Sydney, NSW
NLA: 15,046 sqm
WALE: 3 9 years
Occupancy: N/A
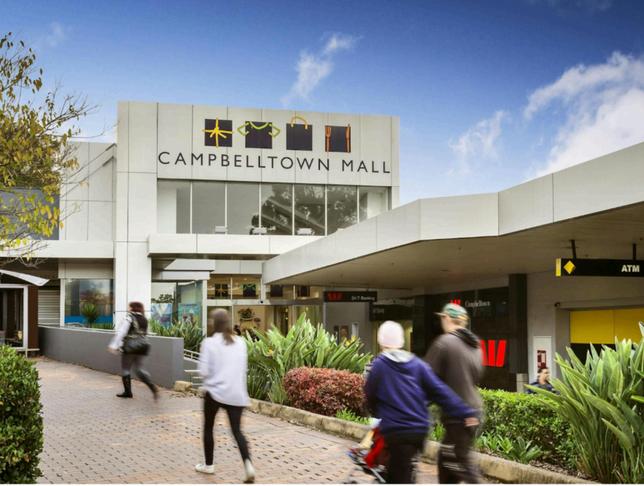
Address: Campbelltown Mall, Sydney, NSW
NLA: 43,168 sqm
WALE: 3 4 years
Occupancy: N/A
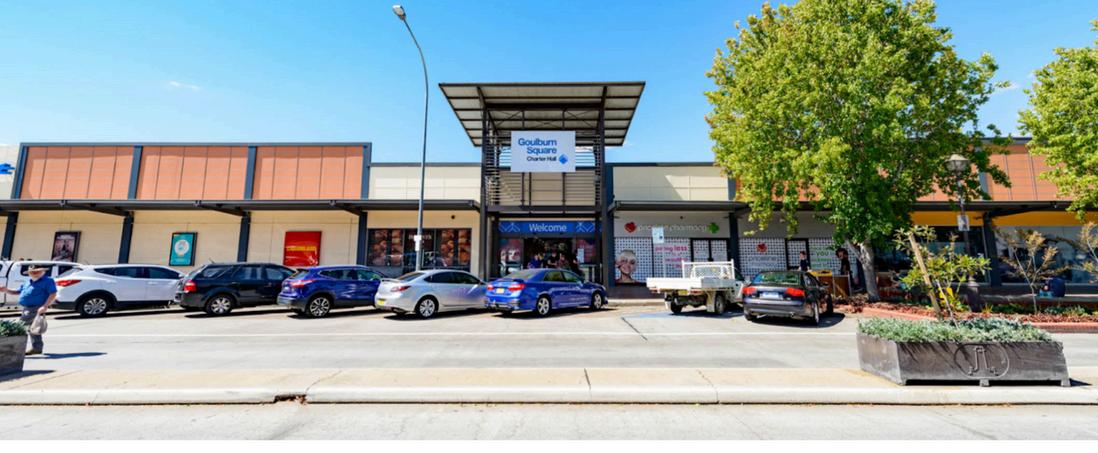
WALE: 4 3 years
Occupancy: N/A
Notes: (1) N/A indicates metric is not disclosed
NOTABLESOCIAL INFRASTRUCTUREASSETS
$3.7 billion portfolio; 9 properties; 100% occupancy; 5.20% cap rate
Brisbane City Council Bus Network Terminal

GLA: 6,543 sqm
WALE: 13 years
Occupancy: 100%
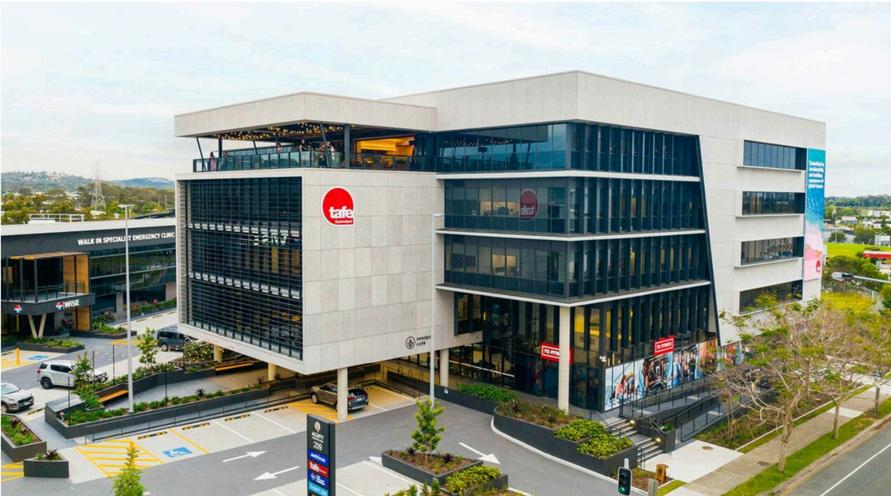
TAFE Robina, 94 Laver Drive QLD
NLA: 6,724 sqm
WALE: N/A
Occupancy: 100%
Notes:
Company Filings

05 TRADING PERFORMANCE
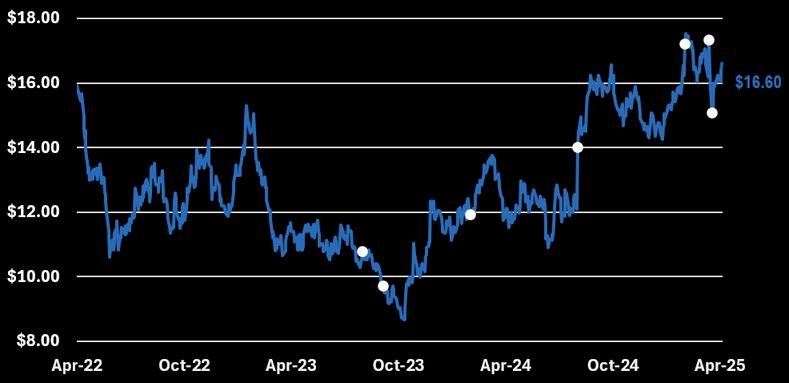
21 Aug 23: CHC reports FY23 results, with an OEPS of 93.3cps reflecting a strong fiscal year and a 9 4% growth in FUM +3.6% change
25 Sep 23: CHC CFO Russel Proutt resigns pursuing the role of CEO at GPT Group. Anastasia Clarke is appointed as CFO 4 days later +0.3% change
21 Feb 24: CHC reports 1H24 results, showing a decrease of 5.5% decrease in FUM and a $200m decrease in property investment portfolio value (1.2%) change
21 Aug 24: CHC reports FY24 results delivering significant returns despite REITs experiencing significant downturn due to interest rate hikes +15.8% change
20 Feb 25: CHC reports 1H25 results, with OEPS guidance of 81.0cps reflecting consistently solid earnings (CAGR: 11.4%). +6.0% change
SHAREPRICEVSASX200
3
YEAR TRADING PERFORMANCE


06 TRADINGCOMPS
Trading comparables, or “trading comps”, are a valuation method used to compare the value of a company or part of a company by comparing it to similarly publicly trading companies The idea is similar to how real estate agents determine house prices by looking at recent listings of similar quality homes in the same area. In financial markets, analysts look at key financial ratios or metrics to gauge how a particular company is valued compared to its peers.
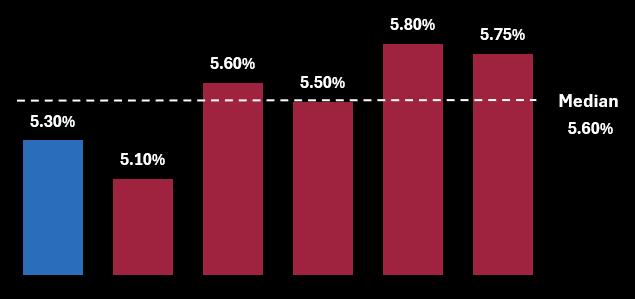
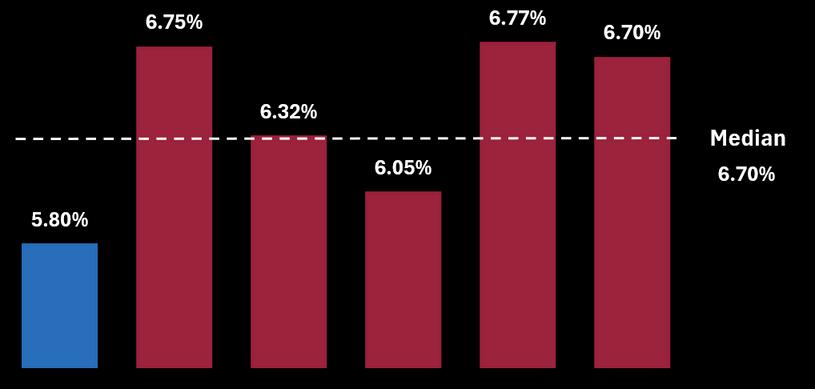
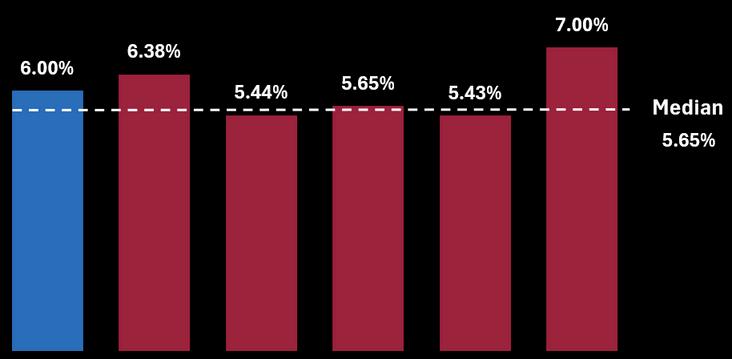
FUNDSMANAGEMENTCOMPS
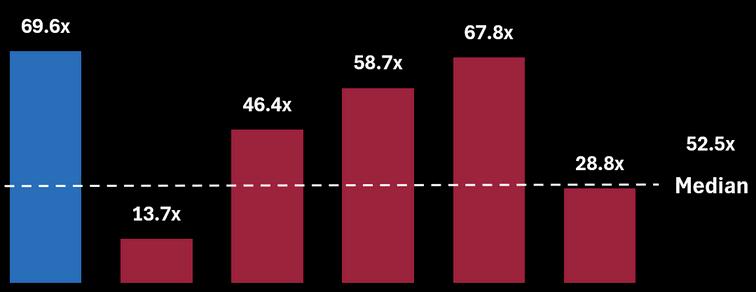


INDUSTRIALCOMPS


07 INVESTMENT RISKS
Exposure to Office Sector
Structural headwinds from flexible working have caused rising vacancy rates from 12.6% to 13.7% over the last two years. Nonetheless, return-towork trends are expected to support sector performance.
Development Execution Risk
Over half of the development pipeline remains uncommitted, presenting leasing risk and cost overrun concerns Hence, within the current high construction cost and inflationary environment, this may compress development margins.
Key Person Risk
With decades of experience, a sudden departure of senior personnel such as Avi Anger (CEO of Diversified Funds) may disrupt fund performance and investor confidence in CHC’s ~$83.4 billion portfolio.
Valuation Compression Risk
Although medium-term valuation growth has remained robust, cap rates across all sectors have continued to increase by 39 basis points to 5.6% over CY24. This has contributed to a 4.5% devaluation of CHC’s property portfolio value Although disproportionately attributed to office (9.6% decrease), CHC’s valuation resilience could erode further should cap rates continue to rise