

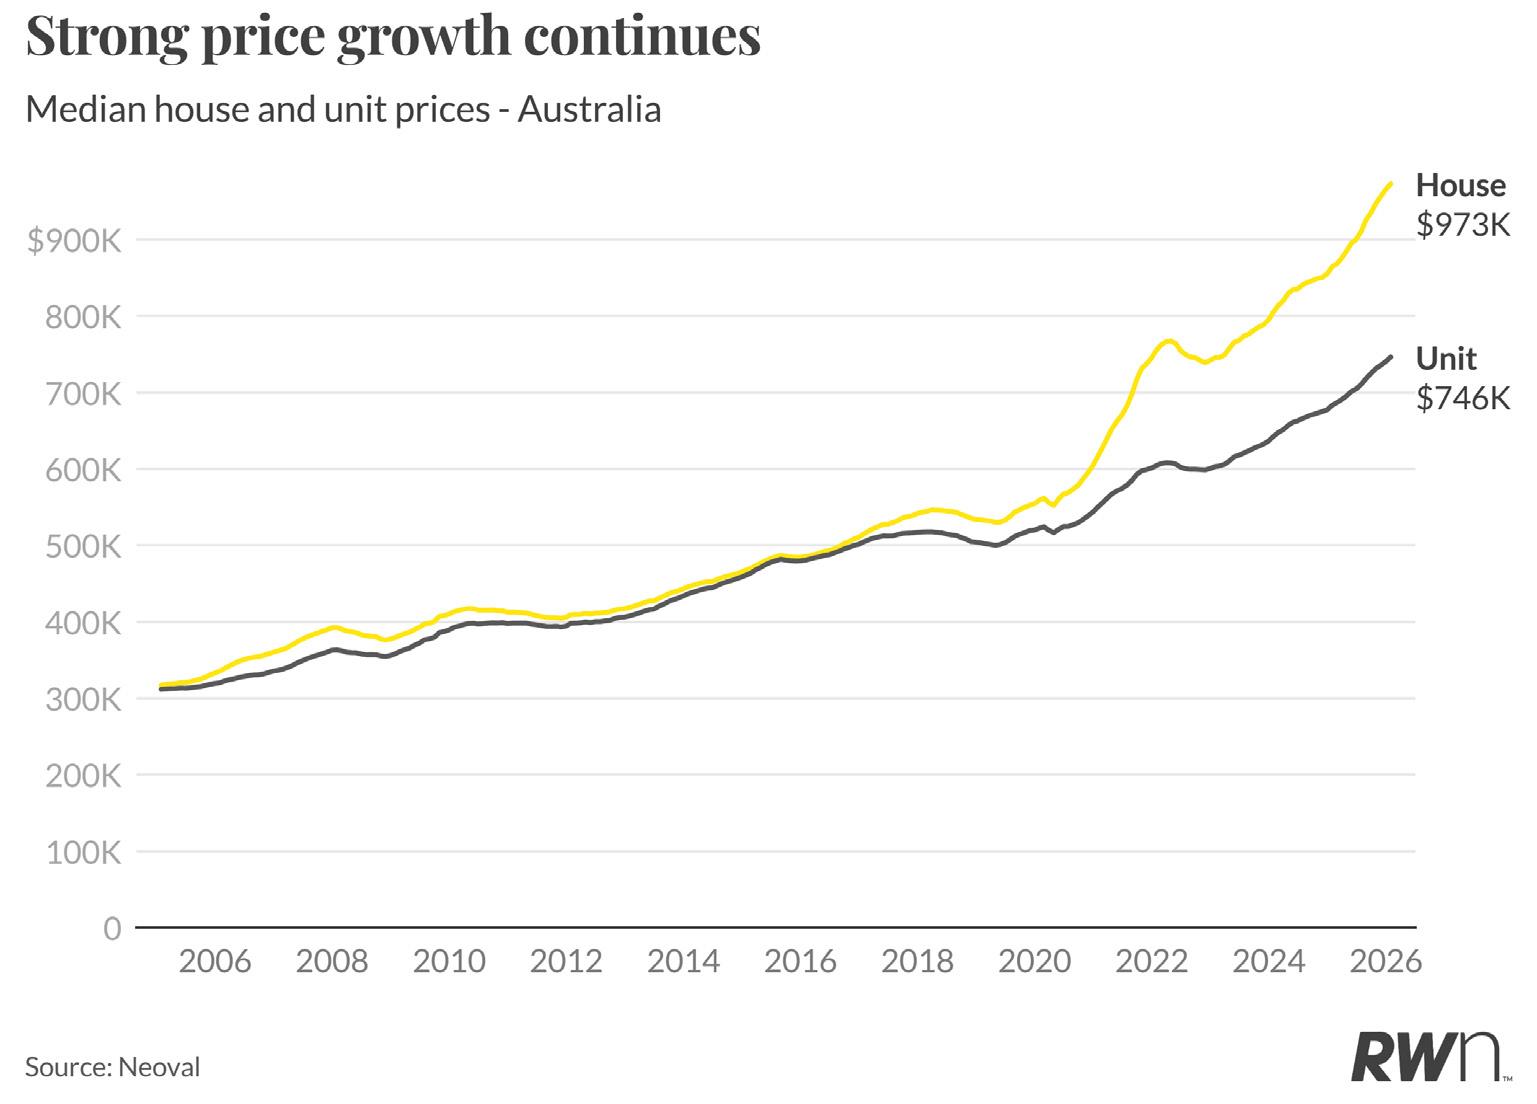
Australia’s median house price reached $973,000 in January 2026, maintaining strong momentum with a 0.8 per cent monthly increase and 12.5 per cent annual growth. The unit market demonstrated similar resilience, with the national median climbing to $746,000 after recording 0.8 per cent monthly growth and 9.2 per cent yearon-year gains. This sustained price growth across both property types underscores the persistent strength of housing demand heading into the new year, even as the national house median approaches the psychologically significant $1 million threshold. The Reserve Bank’s decision to raise the cash rate by 0.25 percentage points in February, responding to re-accelerated inflation and continued economic strength, is expected to moderate price growth momentum in coming months as borrowing capacity becomes more constrained. However, with underlying housing supply shortages unresolved, any cooling in price growth is likely to be gradual rather than abrupt.
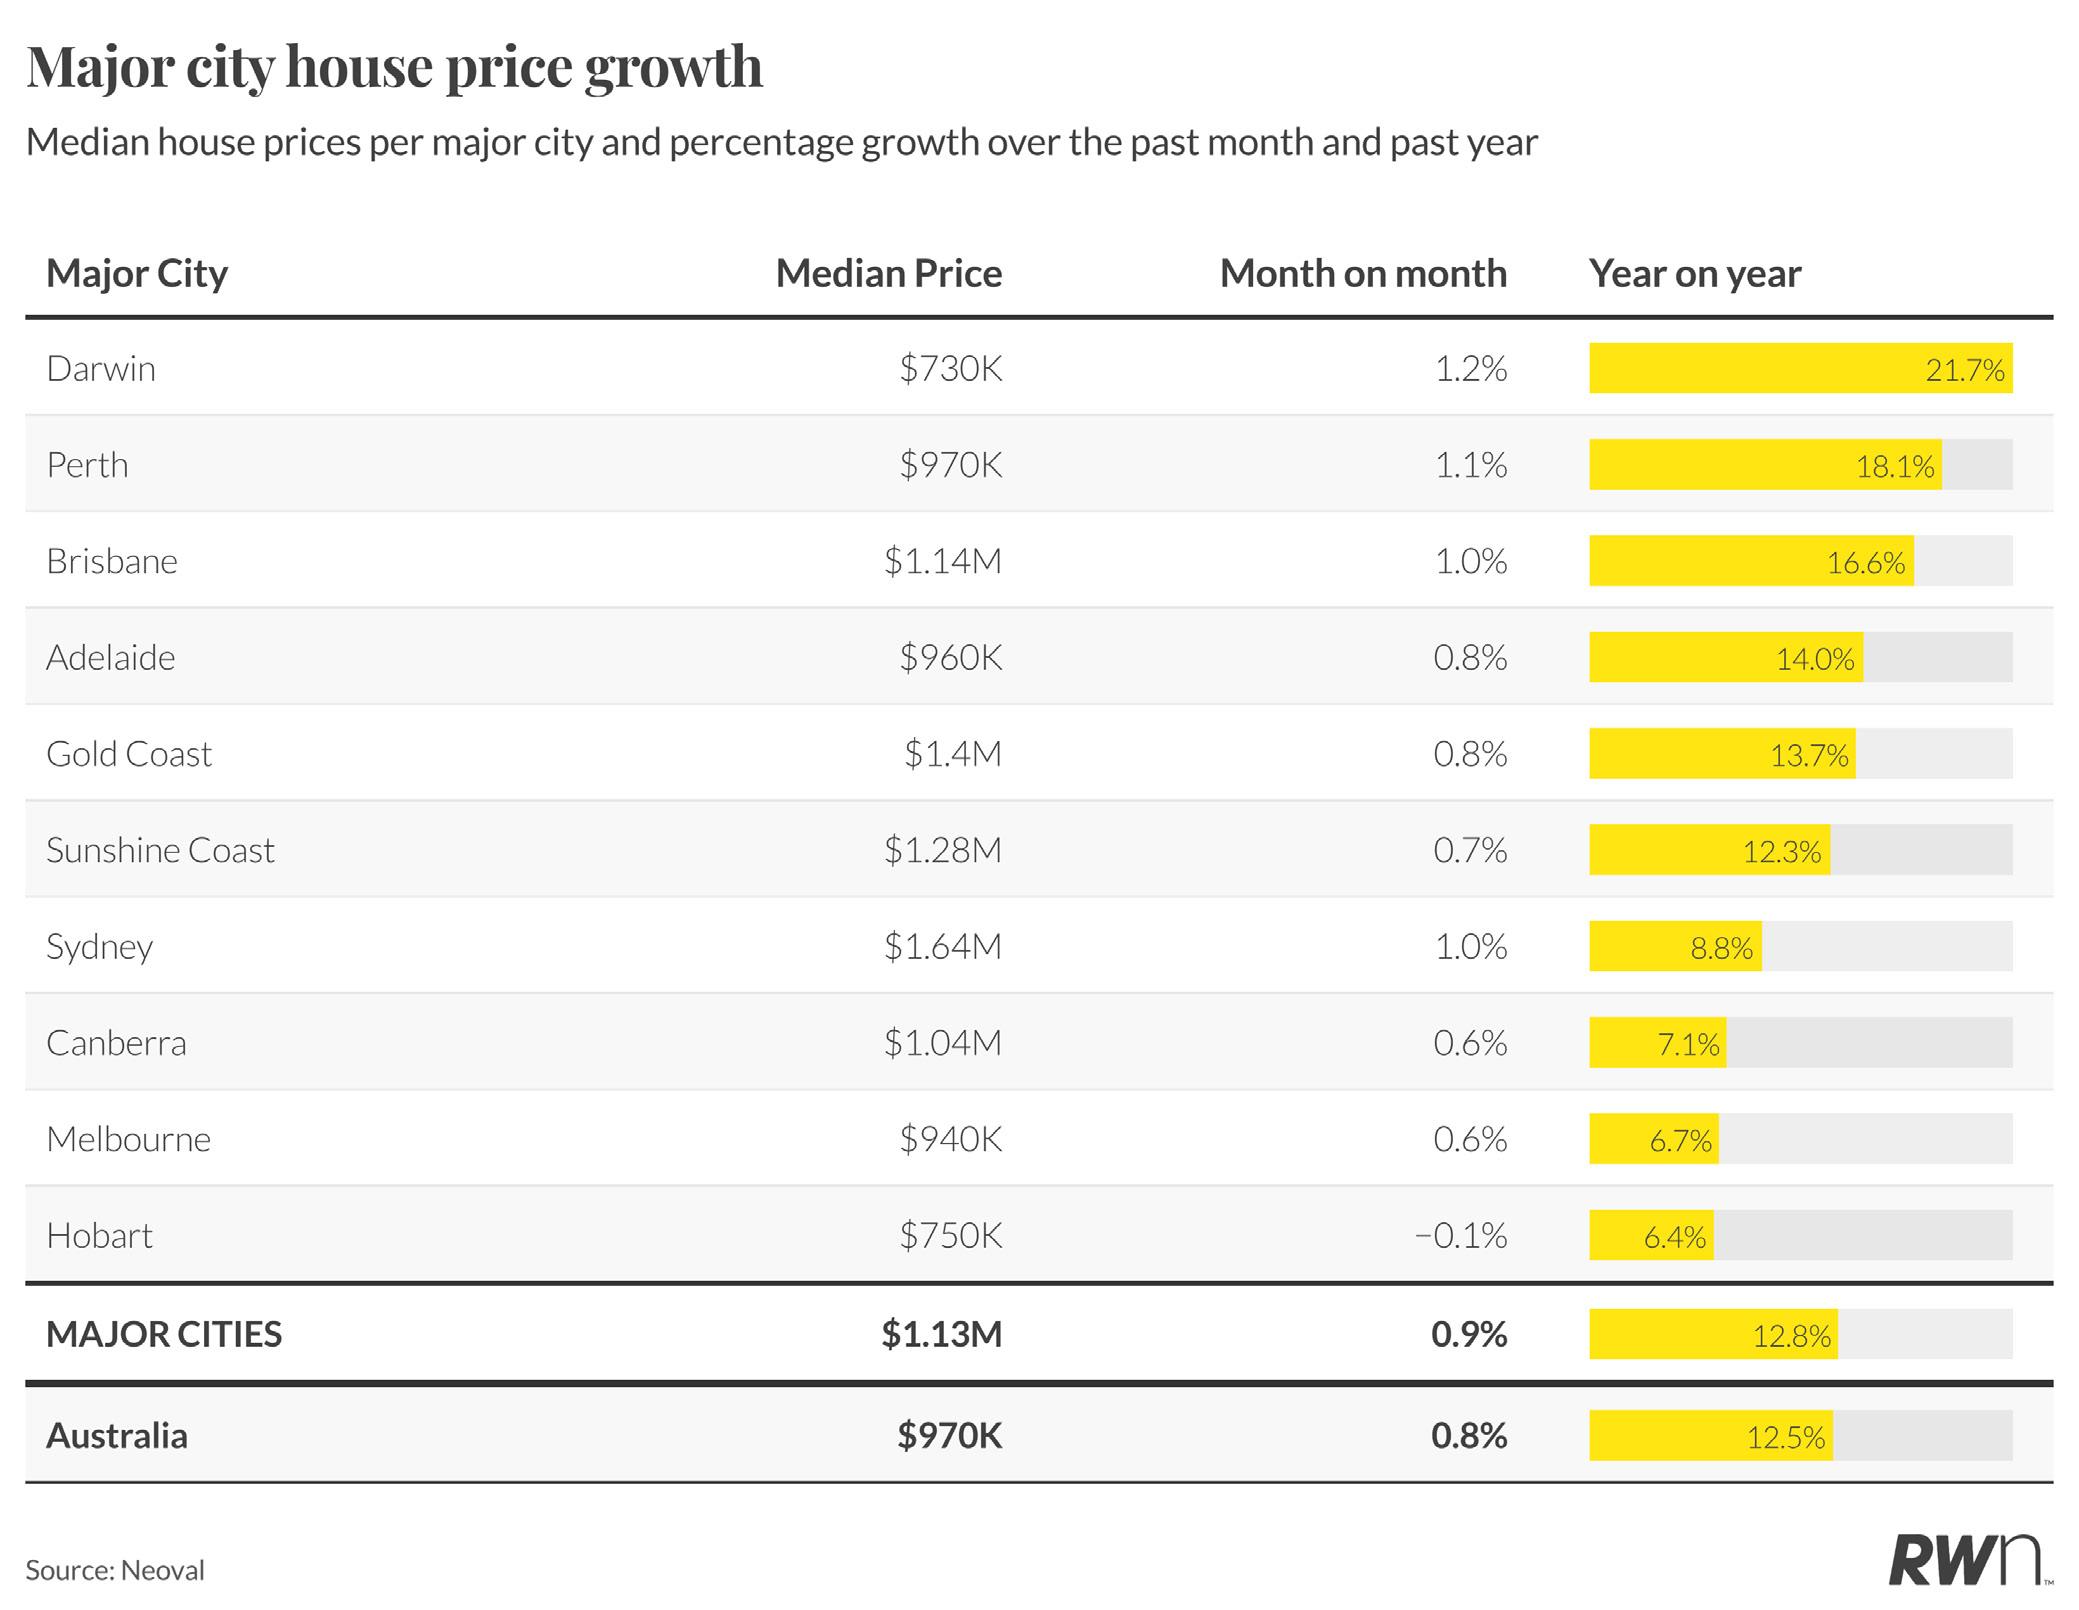
Major city house prices recorded solid gains in January, with the combined metropolitan median reaching $1.13 million following a 0.9 per cent monthly increase. Darwin led metropolitan performance with a 1.2 per cent monthly rise to $730,000, delivering exceptional 21.7 per cent annual growth driven by limited supply and ongoing resource sector demand. Perth maintained strong momentum with 1.1 per cent monthly appreciation to $970,000 and 18.1 per cent year-onyear growth, while Brisbane’s 1.0 per cent monthly increase pushed the median to $1.14 million with robust 16.6 per cent annual gains. Sydney also posted 1.0 per cent monthly growth, reaching $1.64 million with 8.8 per cent annual appreciation. Adelaide, Gold Coast, and Sunshine Coast recorded monthly increases between 0.7 and 0.8 per cent, delivering annual growth of 14.0 per cent, 13.7 per cent, and 12.3 per cent respectively. Melbourne and Canberra saw more modest monthly gains of 0.6 per cent, with annual growth of 6.7 per cent and 7.1 per cent. Hobart was the only capital to record a monthly decline of 0.1 per cent, though it still achieved 6.4 per cent annual appreciation to $750,000.

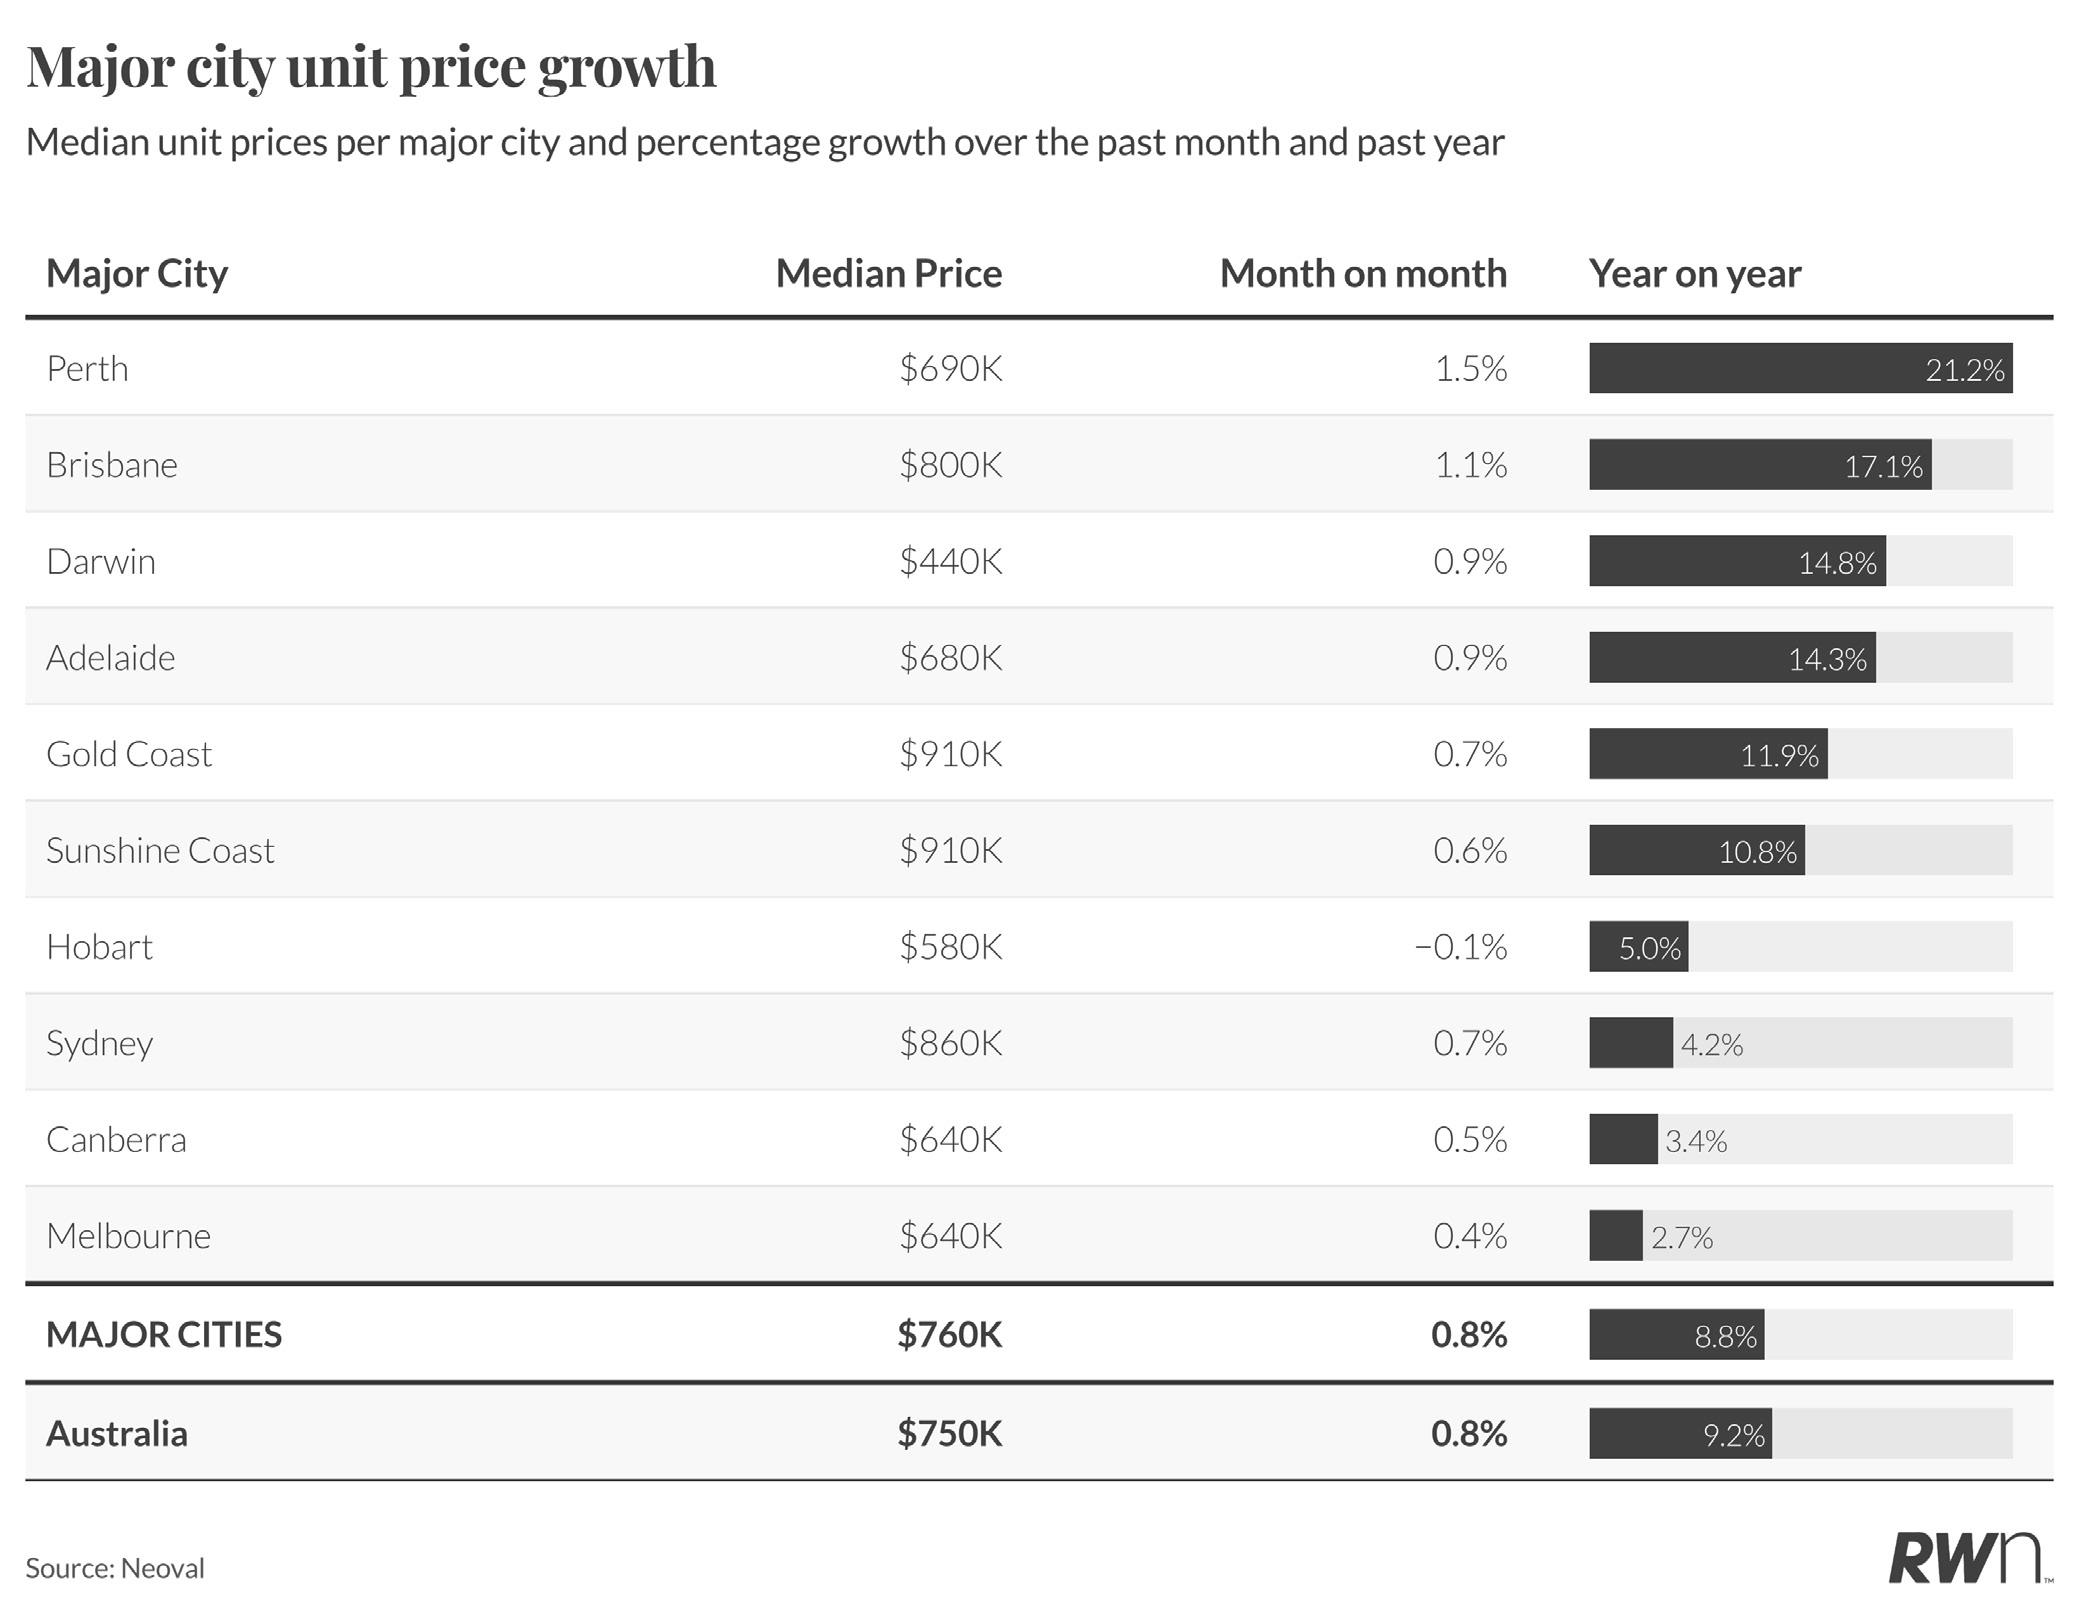
Unit prices in major cities demonstrated widespread strength, with the combined metropolitan median reaching $760,000 following a 0.8 per cent monthly increase and 8.8 per cent annual growth. Perth led unit price performance with a substantial 1.5 per cent monthly rise to $690,000, delivering exceptional 21.2 per cent annual appreciation that continues to reflect the state’s tight rental market and limited new supply. Brisbane followed with 1.1 per cent monthly growth to $800,000 and strong 17.1 per cent year-on-year gains. Darwin and Adelaide both posted 0.9 per cent monthly increases, recording annual growth of 14.8 per cent and 14.3 per cent respectively. Sydney units increased 0.7 per cent monthly to $860,000 with 4.2 per cent
annual growth, while Melbourne recorded 0.4 per cent monthly appreciation to $640,000 and modest 2.7 per cent annual gains. Gold Coast and Sunshine Coast units both demonstrated resilience with medians of $910,000, recording 0.7 per cent monthly growth and 11.9 per cent and 10.8 per cent annual appreciation respectively. Hobart units experienced a slight monthly decline of 0.1 per cent to $580,000, though maintained 5.0 per cent annual growth. While higher interest rates will constrain borrowing capacity, the unit market continues to face a structural supply shortage, with new construction falling well short of demand, suggesting rental pressures will persist despite tighter monetary policy.
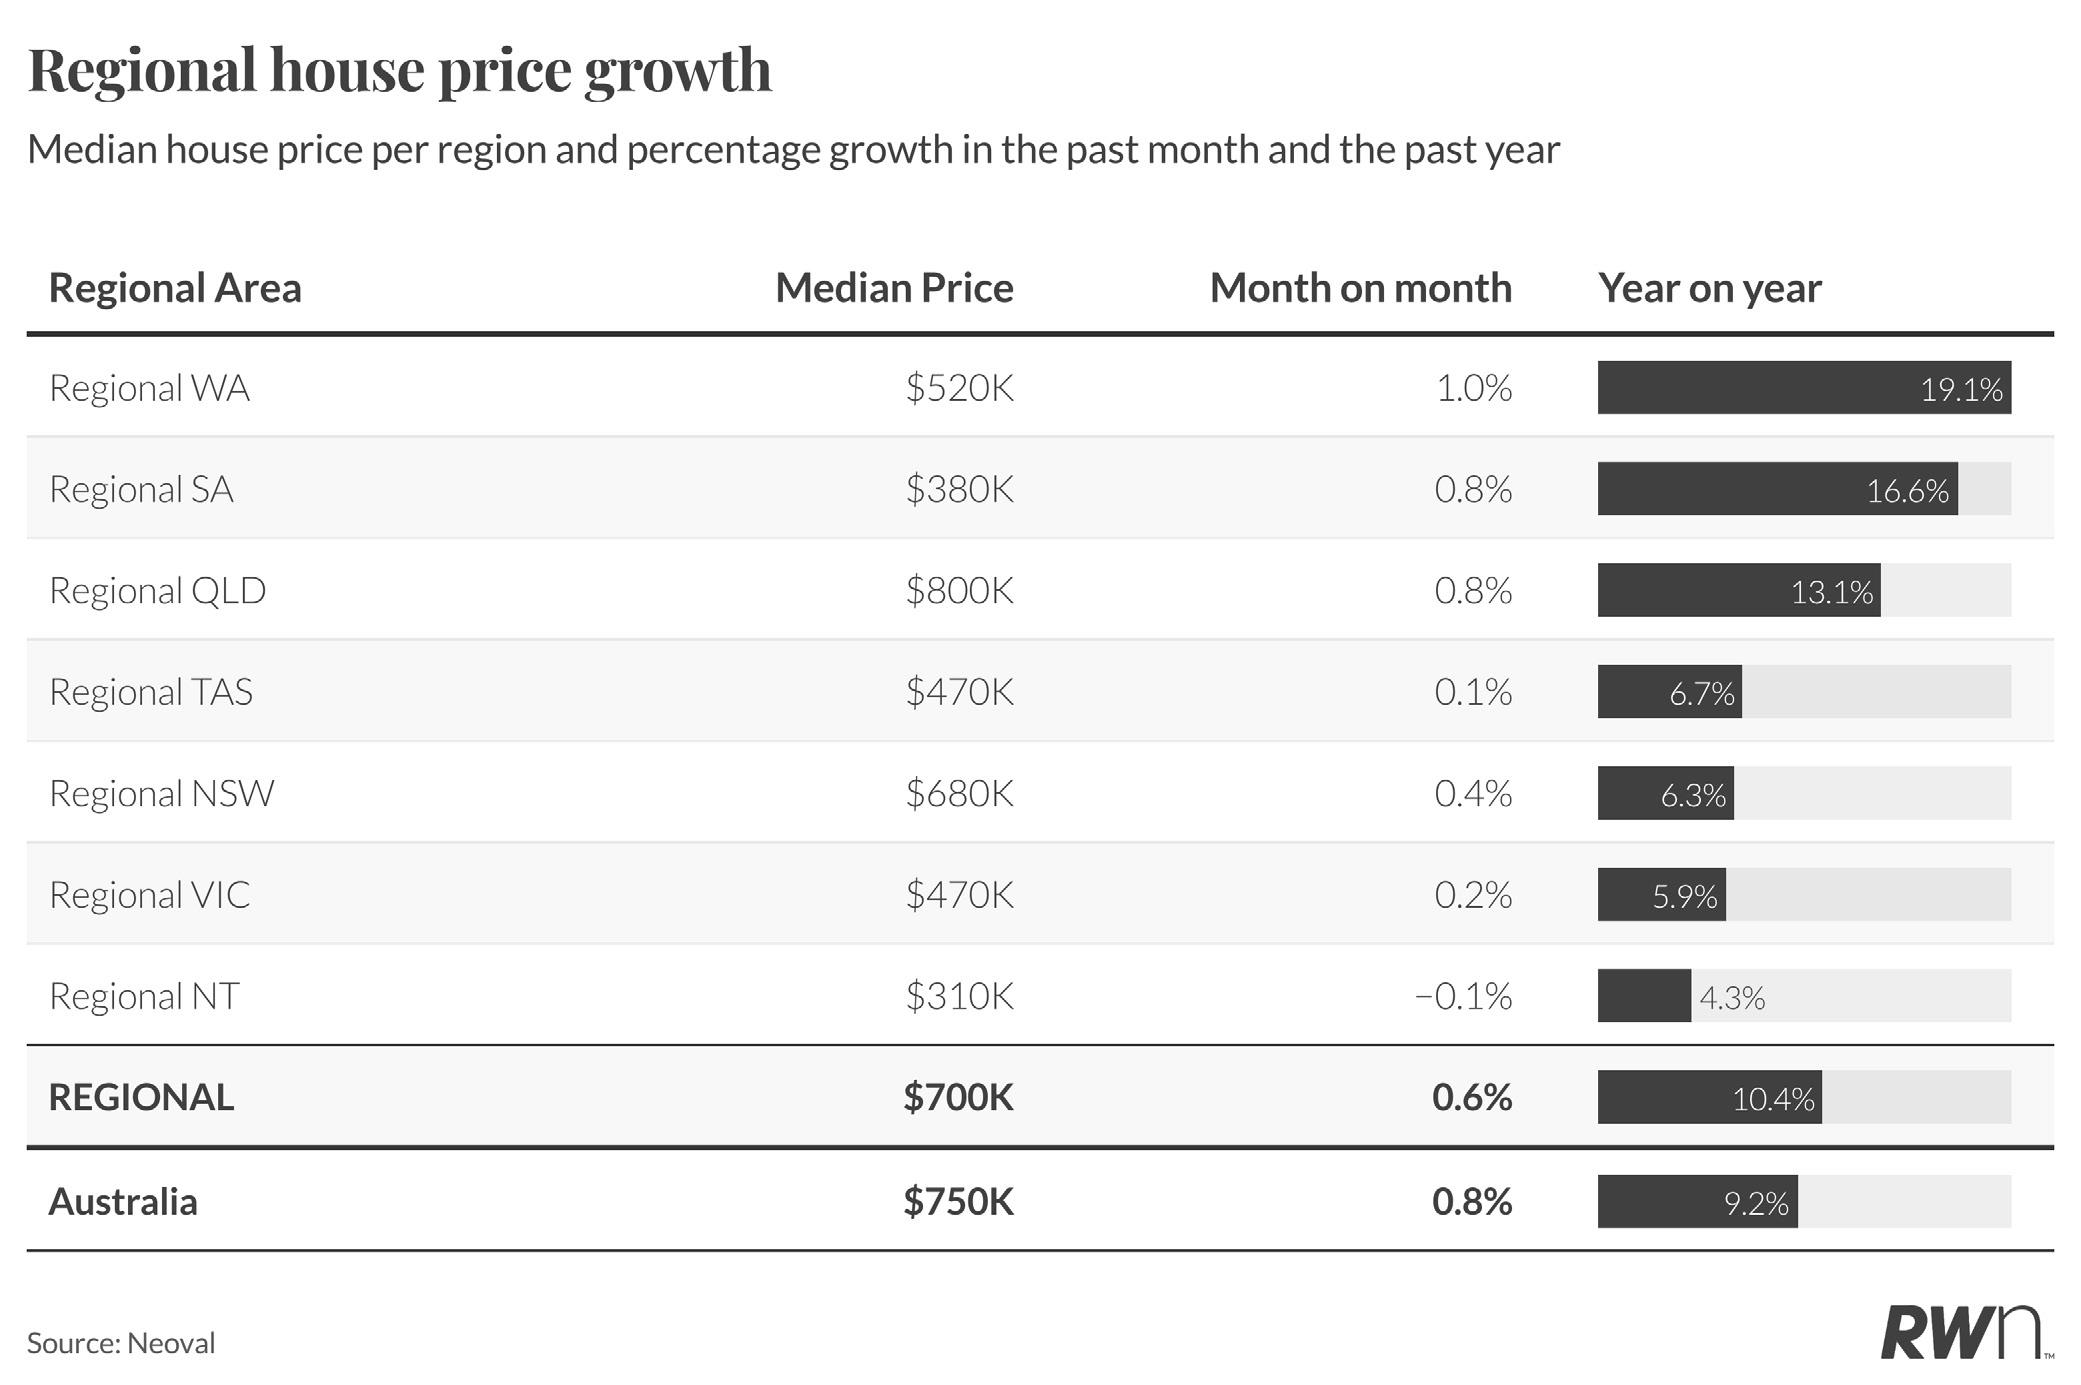
Regional housing markets continued to outperform metropolitan areas on an annual basis, with the combined regional median reaching $700,000 after a 0.6 per cent monthly increase and 10.4 per cent year-on-year growth. Regional Western Australia led all areas with 1.0 per cent monthly appreciation to $520,000 and exceptional 19.1 per cent annual growth, reflecting ongoing strength in mining regions and coastal lifestyle destinations. Regional South Australia posted 0.8 per cent monthly growth to $380,000 with robust 16.6 per cent annual gains, while regional Queensland matched this monthly performance, reaching $800,000 with 13.1 per cent annual appreciation. Regional New South Wales recorded 0.4 per cent monthly growth to $680,000 and 6.3 per cent annual gains. Regional Tasmania and Victoria saw more modest monthly increases of 0.1 per cent and 0.2 per cent respectively, with annual growth of 6.7 per cent and 5.9 per cent. Regional Northern Territory experienced a slight monthly decline of 0.1 per cent to $310,000, though still achieved 4.3 per cent annual growth.


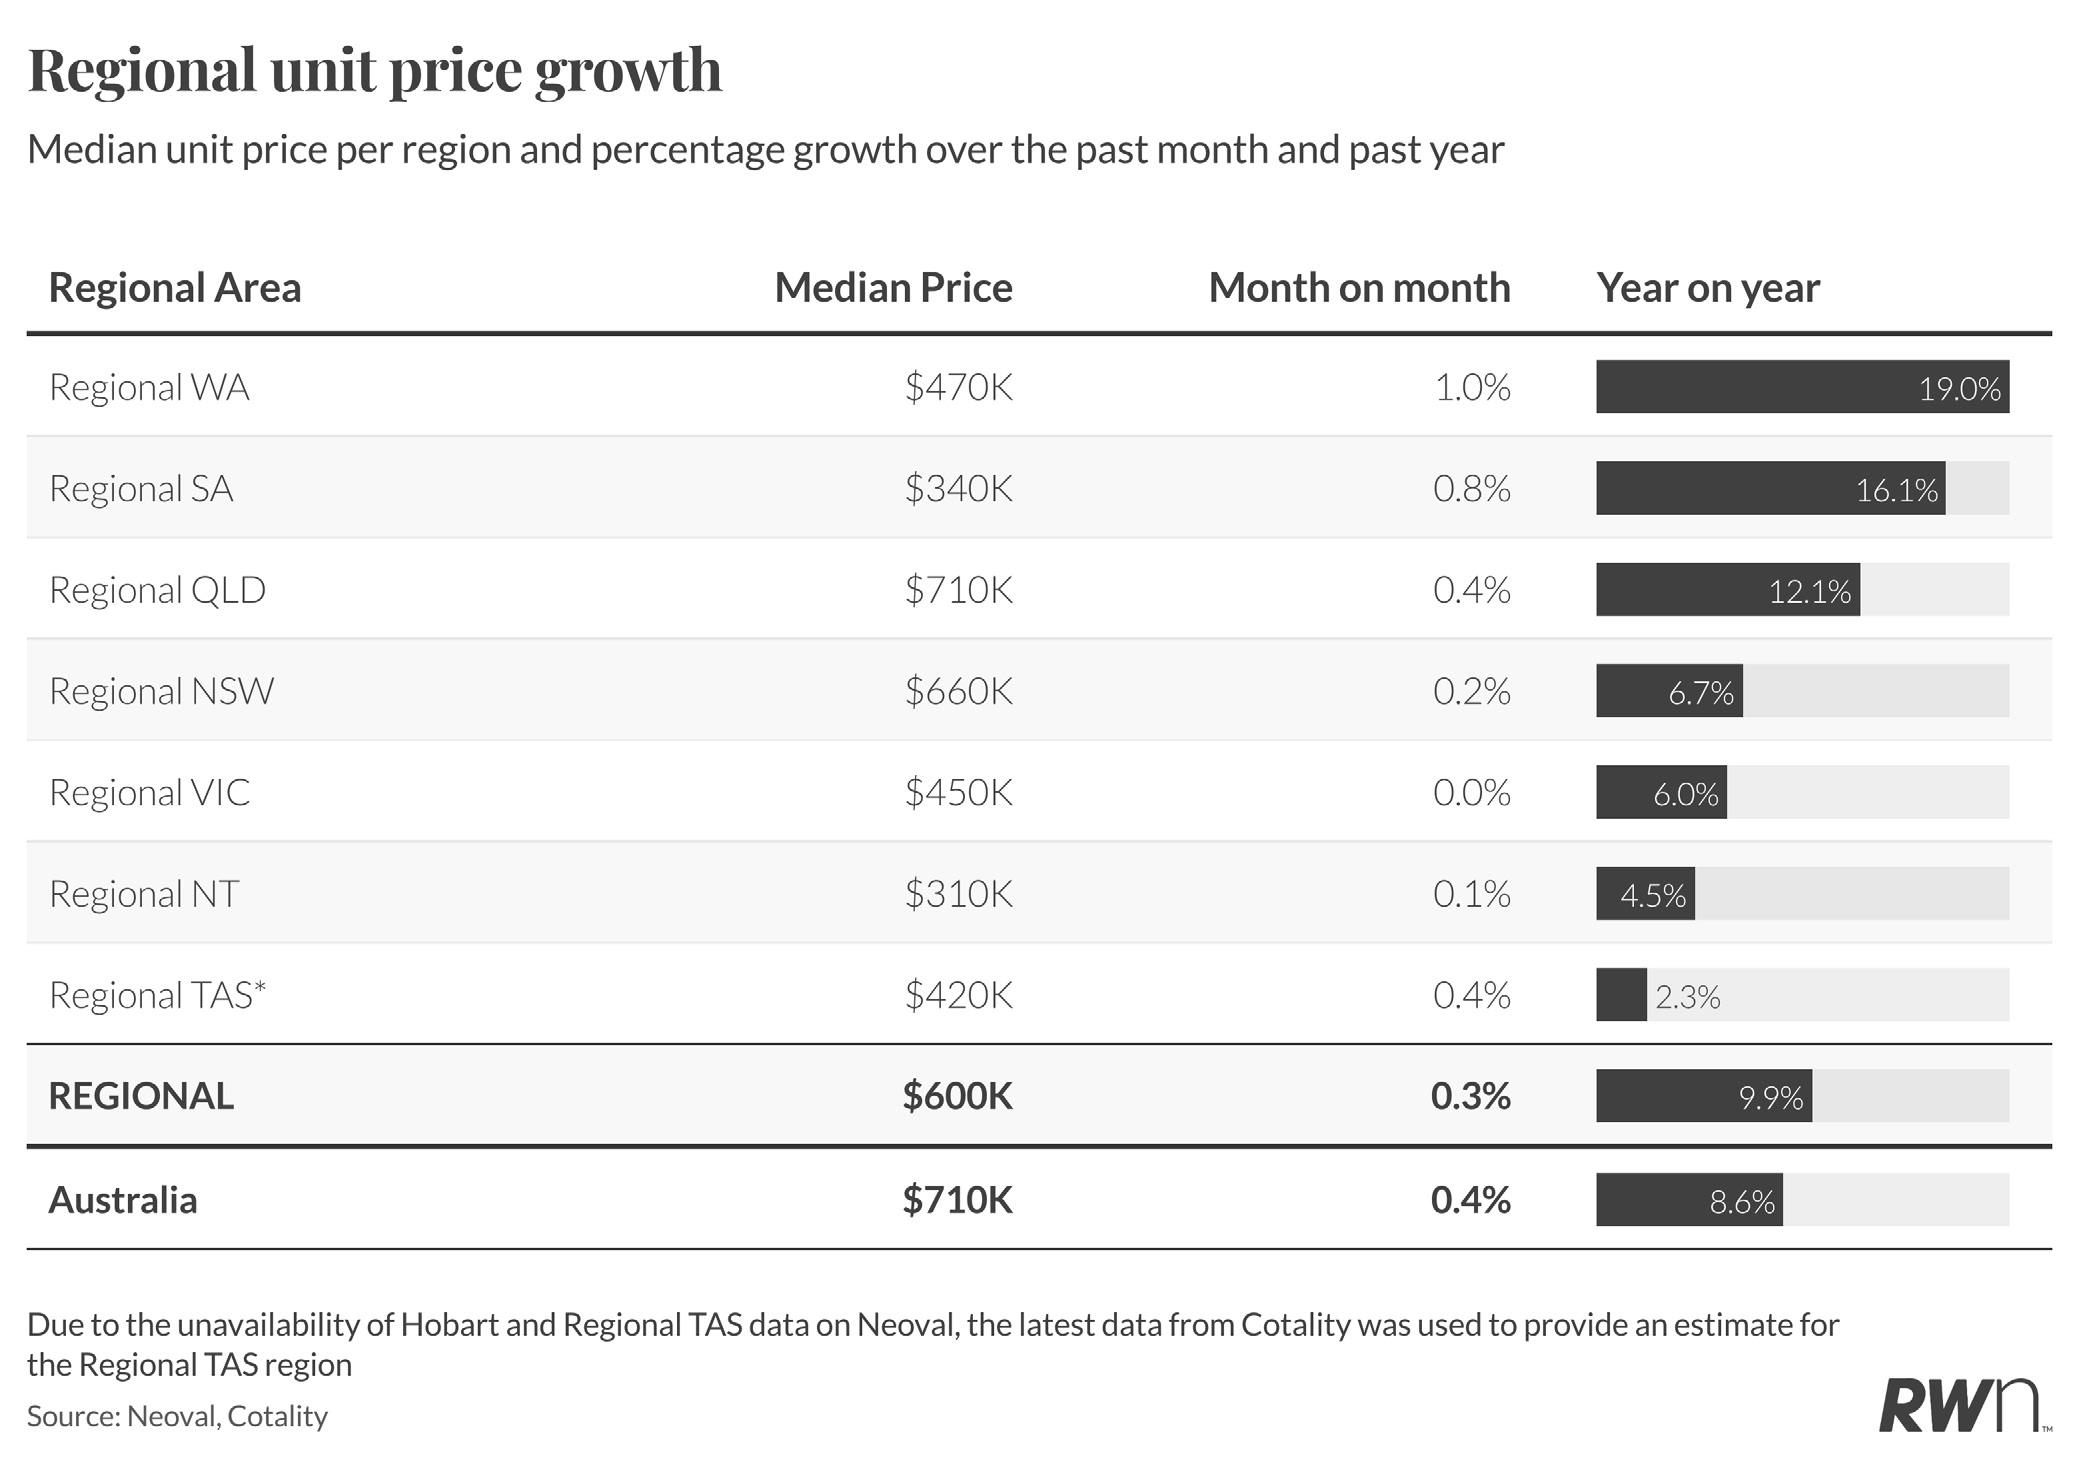
Regional unit markets demonstrated sustained growth momentum, with the combined regional median reaching $600,000 after a 0.3 per cent monthly increase and 9.9 per cent year-on-year appreciation. Regional Western Australia again led performance with 1.0 per cent monthly growth to $470,000 and strong 19.0 per cent annual gains, supported by limited apartment supply in key regional centres. Regional South Australia posted 0.8 per cent monthly appreciation to $340,000 with 16.1 per cent annual growth. Regional Queensland recorded 0.4 per cent monthly growth to $710,000 and 12.1 per cent year-on-year gains, while regional Tasmania units showed 0.4 per cent monthly appreciation to $420,000, though with a more modest 2.3 per cent annual growth. Regional New South Wales and Northern Territory units posted 0.2 per cent and 0.1 per cent monthly increases respectively, with annual growth of 6.7 per cent and 4.5 per cent. Regional Victoria units remained flat month-on-month at $450,000, recording 6.0 per cent annual appreciation. The RBA’s decision to raise rates in response to persistent inflation pressures creates a more challenging environment for buyers, though the fundamental shortage of regional rental accommodation should continue to provide underlying price support, particularly in areas with strong employment growth.
Source: Neoval
Updated as of January 2026
MAJOR CITY HOUSE PRICES (%CHANGE) SINCE LAST MONTH
REGIONAL AUSTRALIA
$700,000 0.6%
Source: Neoval
REGIONAL HOUSE PRICES (%CHANGE) SINCE LAST MONTH

LISTINGS ACTIVITY
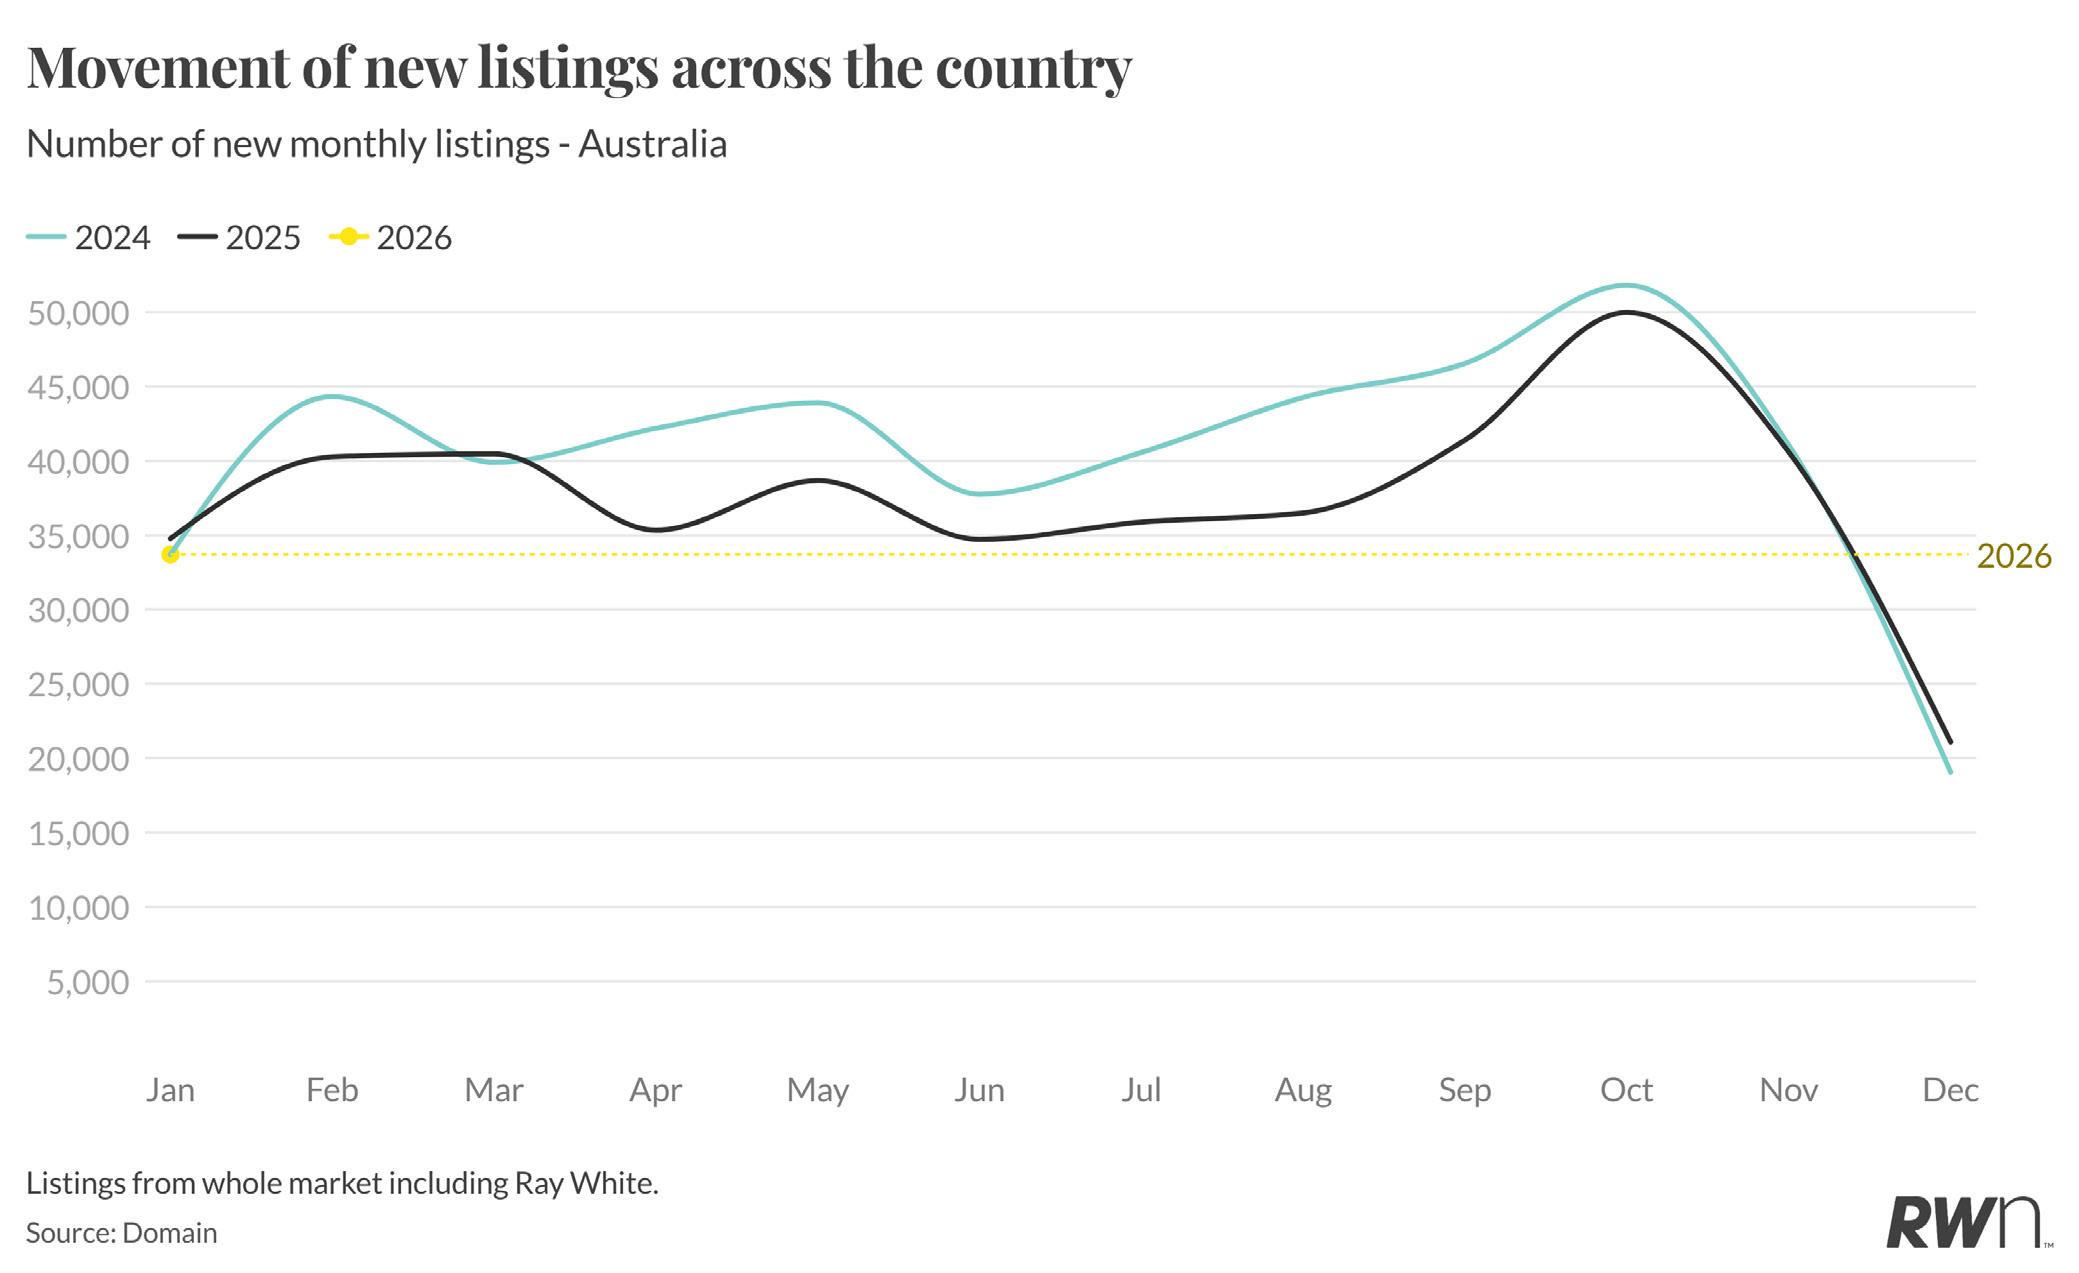
New listings nationally totalled 33,700 in January 2026, reflecting the typical quiet start to the year as vendors and buyers returned from the summer holiday period. This represents a sharp decline from December 2025’s 21,888 listings and sits notably below the elevated levels recorded through the final months of 2025, when listings peaked at 51,816 in October. The January figure tracks marginally below January 2025’s 34,769 listings and sits above January 2024’s 33,693, suggesting vendor sentiment remained relatively stable heading into the new year despite ongoing uncertainty around interest rate settings.
The seasonal pattern through 2025 showed listings building from the quieter start-of-year period, reaching peak levels through the spring selling season before the traditional year-end slowdown. The Reserve Bank’s decision to raise rates in early February is likely to influence vendor behaviour in coming months, with some potential sellers possibly delaying listing decisions while they assess how higher borrowing costs affect buyer demand and price expectations. The relatively subdued January listing volumes, combined with the more challenging interest rate environment, suggest supply constraints will persist through early 2026, maintaining support for price stability across most markets.
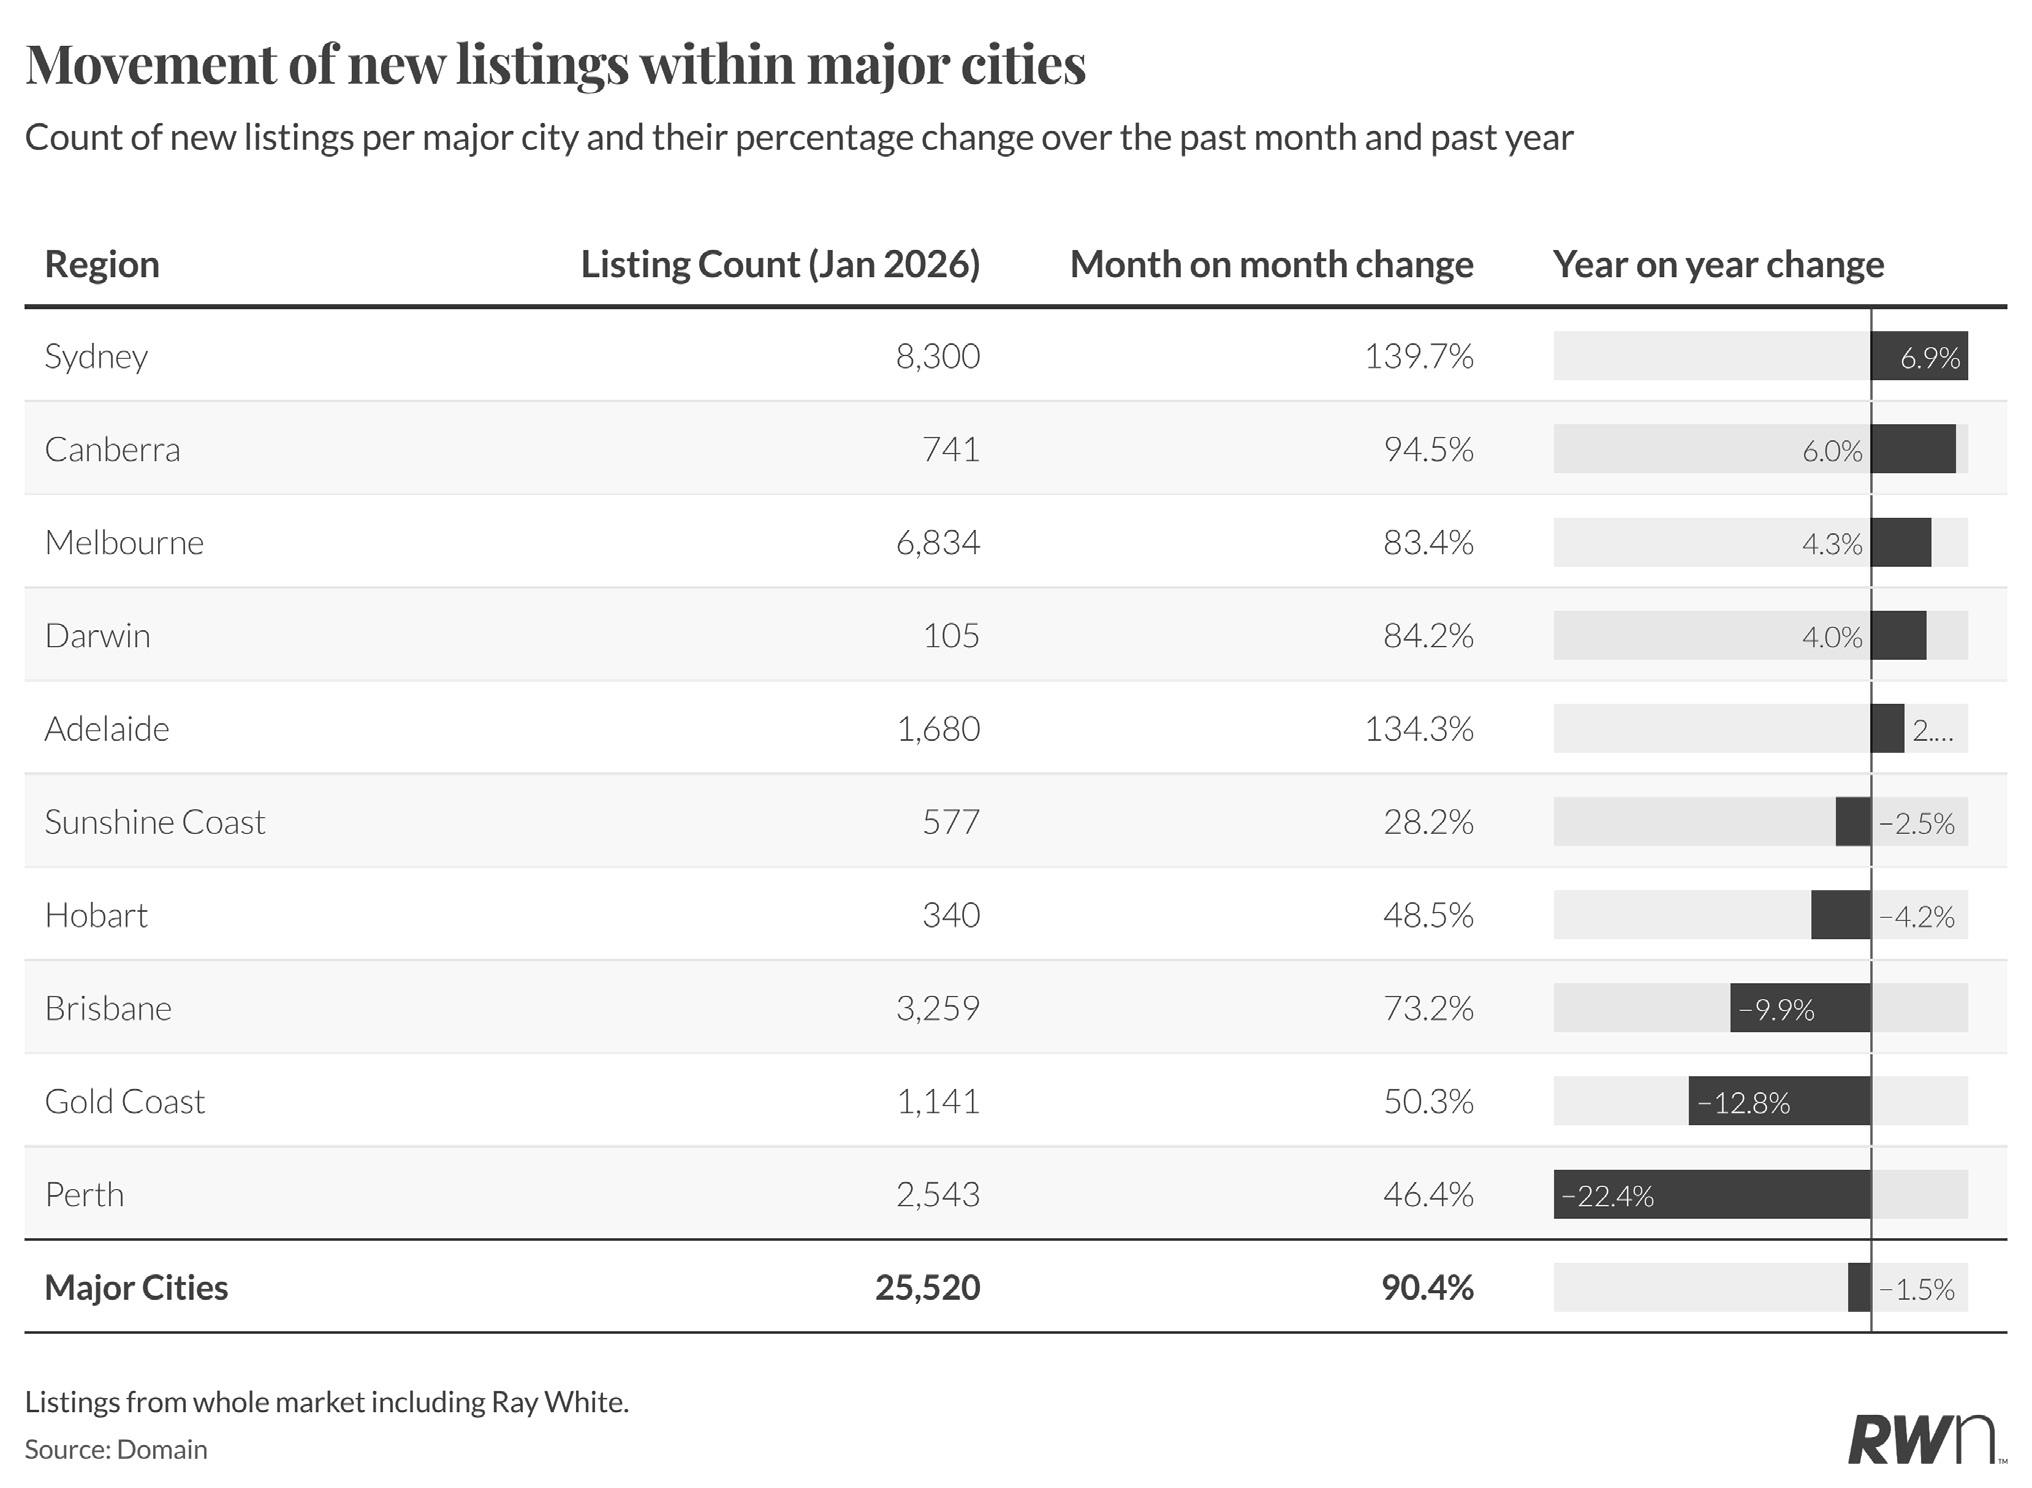
Major city listings surged 90.4 per cent month-onmonth in January to reach 25,520 properties, reflecting the typical post-holiday bounce as vendors return to market following December’s seasonal lull. However, year-on-year comparisons reveal a marginal 1.5 per cent decline compared to January 2025, indicating slightly more cautious vendor sentiment than twelve months ago. Sydney led the month-on-month recovery with a substantial 139.7 per cent increase to 8,300 listings, though year-on-year volumes remained 6.9 per cent higher than January 2025. Canberra and Melbourne posted strong monthly rebounds of 94.5 per cent and 83.4 per cent respectively, though Canberra recorded 6.0
per cent annual growth while Melbourne showed modest 4.3 per cent year-on-year gains. Darwin and Adelaide both recorded 84.2 per cent and 134.3 per cent monthly increases, with Adelaide showing 2.0 per cent annual growth while Darwin achieved 4.0 per cent. Brisbane, Gold Coast, and Perth all posted substantial monthly recoveries between 46.4 per cent and 73.2 per cent, though Brisbane and Gold Coast recorded year-on-year declines of 9.9 per cent and 12.8 per cent respectively, while Perth showed a significant 22.4 per cent annual contraction. Sunshine Coast and Hobart recorded more modest monthly increases of 28.2 per cent and 48.5 per cent, with both markets showing slight annual declines.
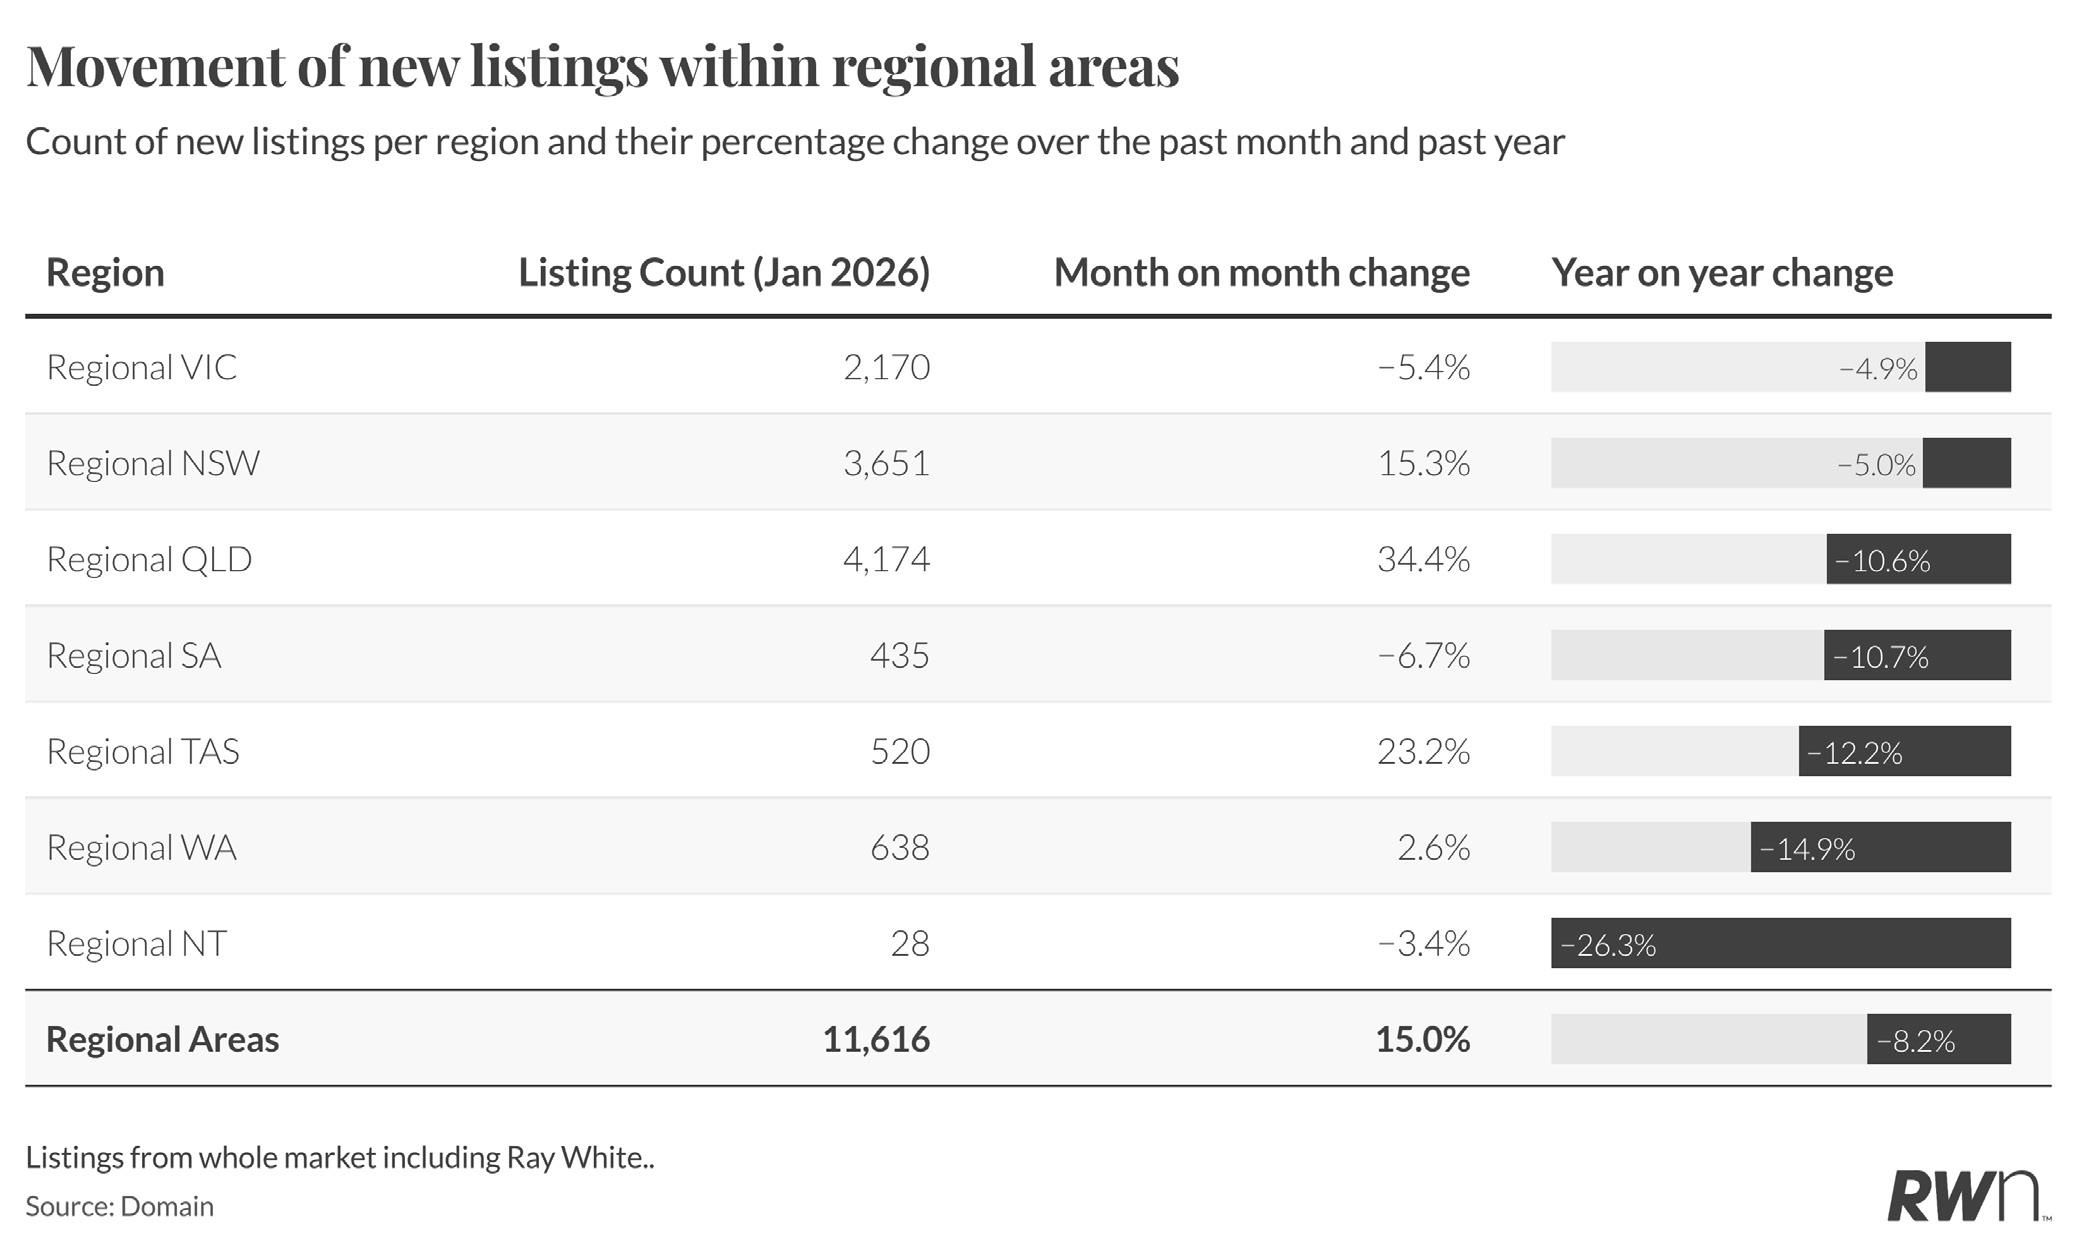
Regional listings increased 15.0 per cent month-onmonth in January to reach 11,616 properties, though this represented an 8.2 per cent decline compared to January 2025. Regional New South Wales led the monthly recovery with a 15.3 per cent increase to 3,651 listings, though year-on-year volumes remained 5.0 per cent below January 2025 levels. Regional Queensland posted a substantial 34.4 per cent monthly rise to 4,174 listings, though this still represented a 10.6 per cent annual decline. Regional Tasmania recorded a 23.2 per cent monthly increase to 520 listings but showed a 12.2 per cent year-on-year contraction. Regional Western Australia and South Australia both recorded modest monthly changes of 2.6 per cent and negative
6.7 per cent respectively, with both regions showing significant annual declines of 14.9 per cent and 10.7 per cent. Regional Victoria experienced a 5.4 per cent monthly decline to 2,170 listings and a 4.9 per cent annual contraction. Regional Northern Territory recorded minimal monthly movement with a 3.4 per cent decline to just 28 listings and a substantial 26.3 per cent annual fall. The persistently lower listing volumes across most regional markets compared to the previous year continue to support price growth, though the RBA’s tightening cycle may gradually ease supply constraints as some vendors reassess their ability to upgrade or invest in tighter credit conditions.

AUCTION INSIGHTS
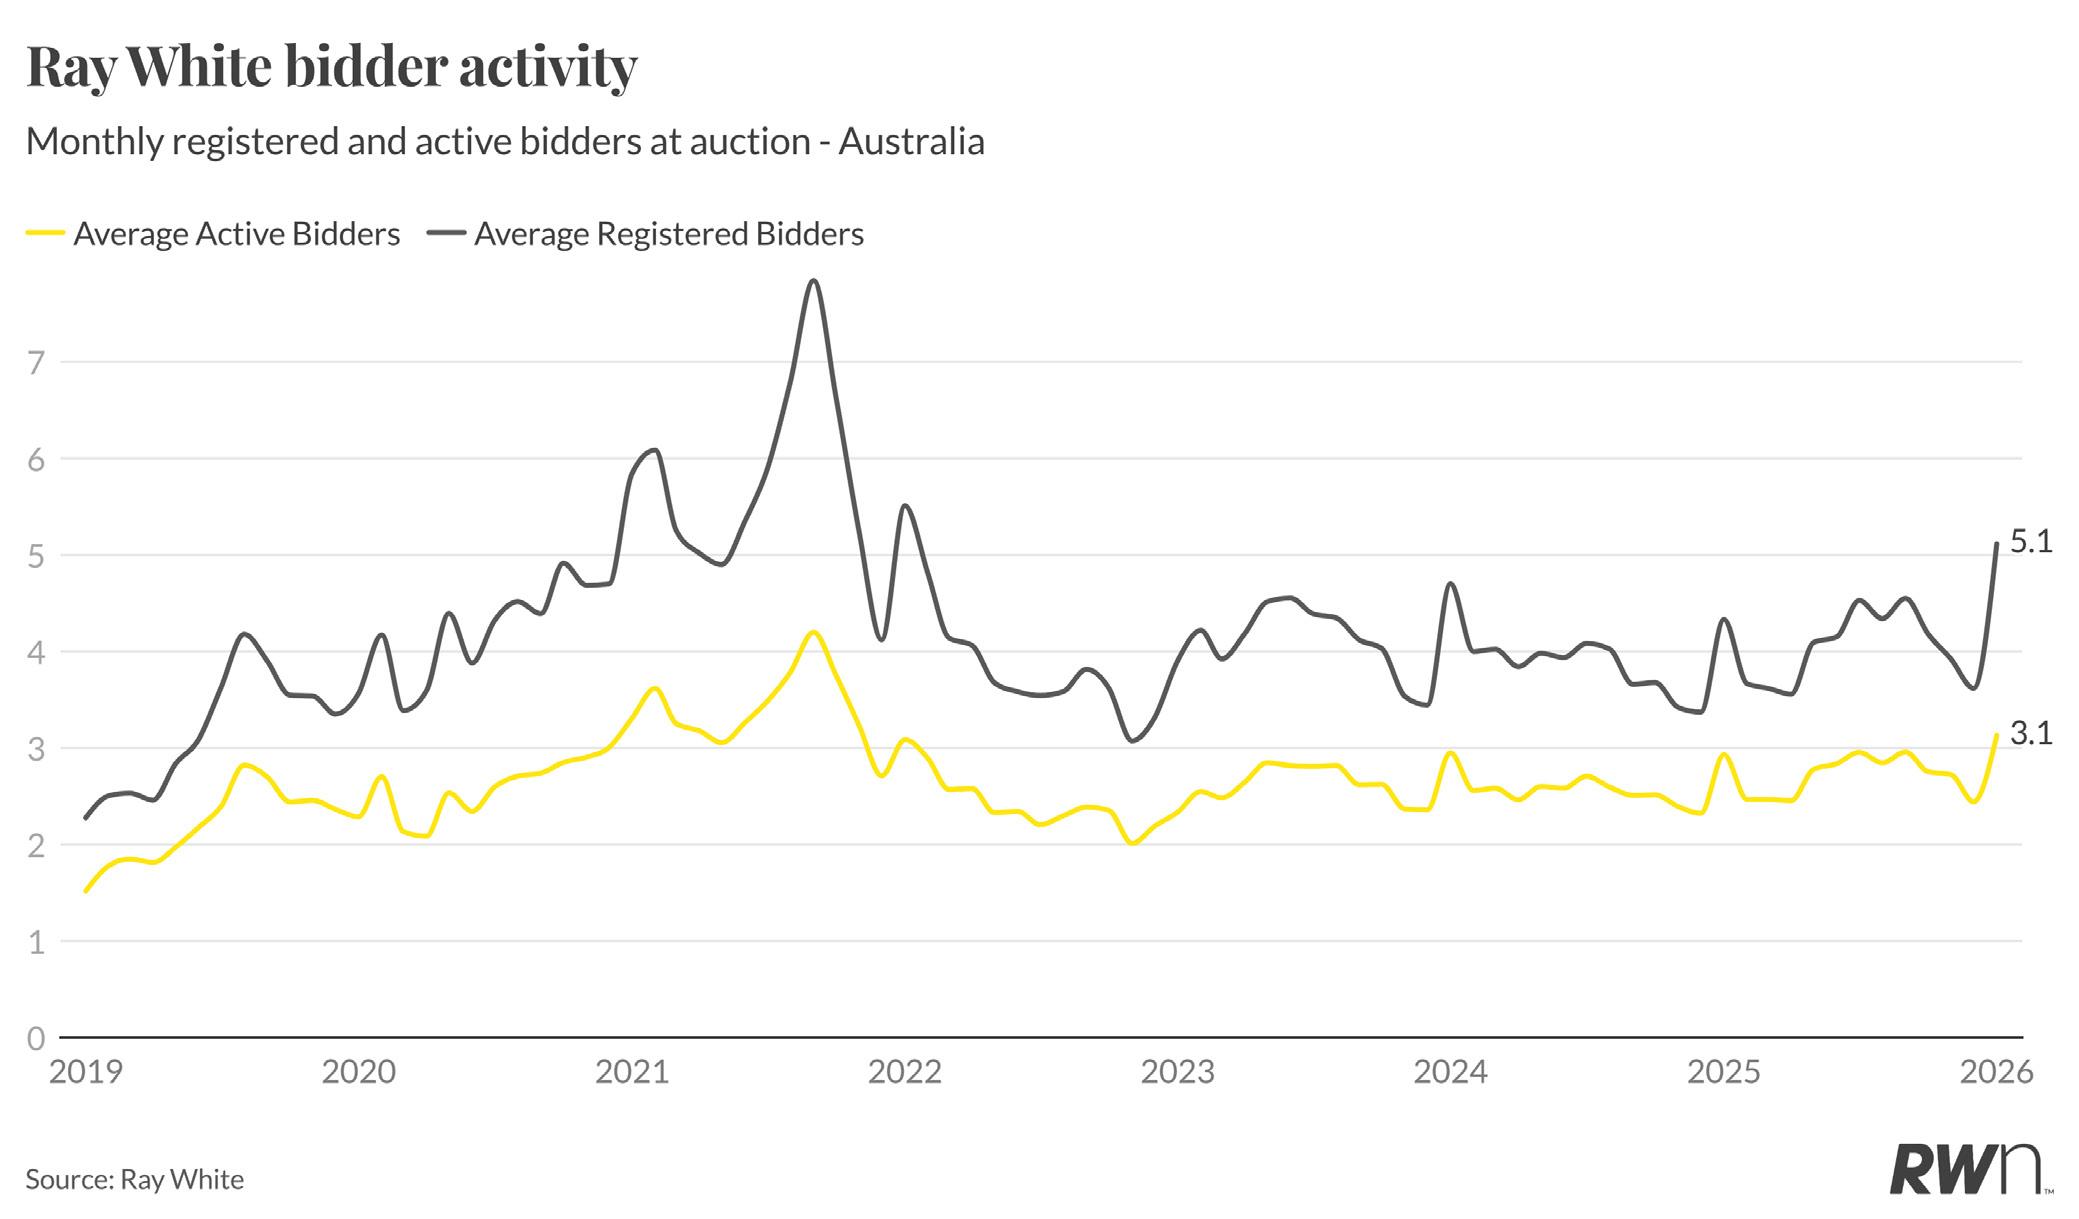
Ray White auction bidder activity strengthened in January 2026, with average registered bidders reaching 5.1 and average active bidders climbing to 3.1. This represents a notable improvement from December’s 3.6 registered and 2.4 active bidders, reflecting the typical seasonal bounce as buyers returned to market following the holiday period. The January registered bidder figure marks the highest level since May 2025, when 4.1 bidders were recorded, suggesting renewed buyer confidence heading into the new year.
The uplift in competition indicates that buyers remained willing to engage despite uncertainty around interest rate settings, with roughly 60 per cent of registered bidders actively participating in auctions. However, the Reserve Bank’s decision to raise rates in early February, may moderate this improving trend, as higher borrowing costs typically reduce buyer capacity and bidder numbers.
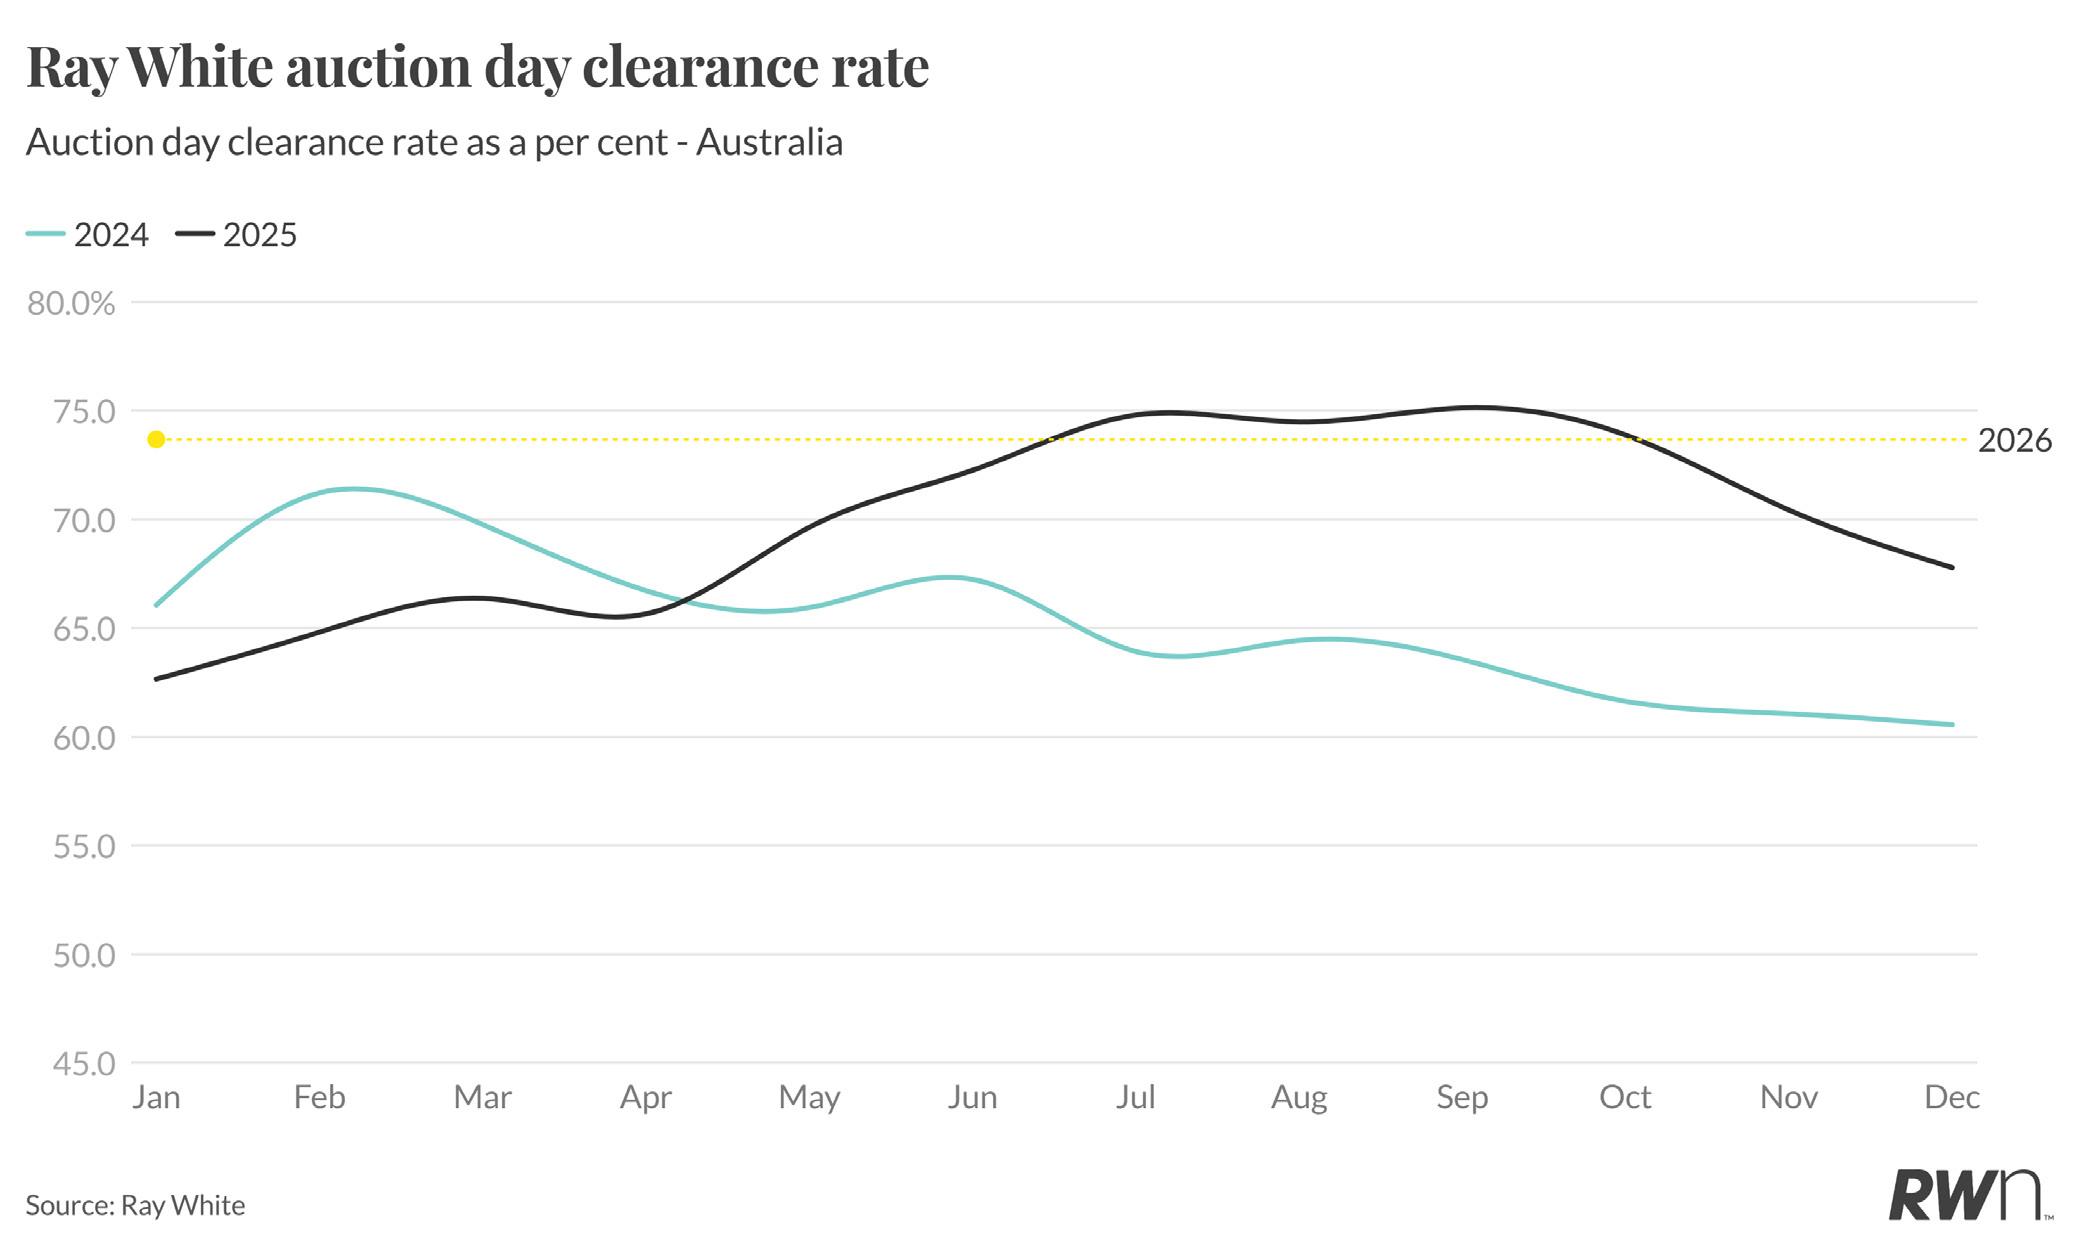
Ray White’s national auction clearance rate reached 73.7 per cent in January 2026, maintaining the elevated levels established through the second half of 2025. This result sits well above the typical clearance rate threshold of 70 per cent that generally indicates balanced market conditions, suggesting demand continued to outpace supply through the traditional summer slowdown. The January clearance rate represents a slight improvement from December 2025’s 67.8 per cent, reflecting the seasonal return of buyers to market following the holiday period.

Clearance rates have remained remarkably resilient throughout 2025, consistently holding above 70 per cent from July through to year-end, a pattern that contrasts sharply with the softer conditions seen in early 2024 when rates sat in the low-to-mid 60s. With listing volumes remaining constrained and vendor expectations adjusting to the new interest rate environment, clearance rates may prove more resilient than in previous tightening cycles, particularly in supply-constrained markets where competition for available stock remains robust.
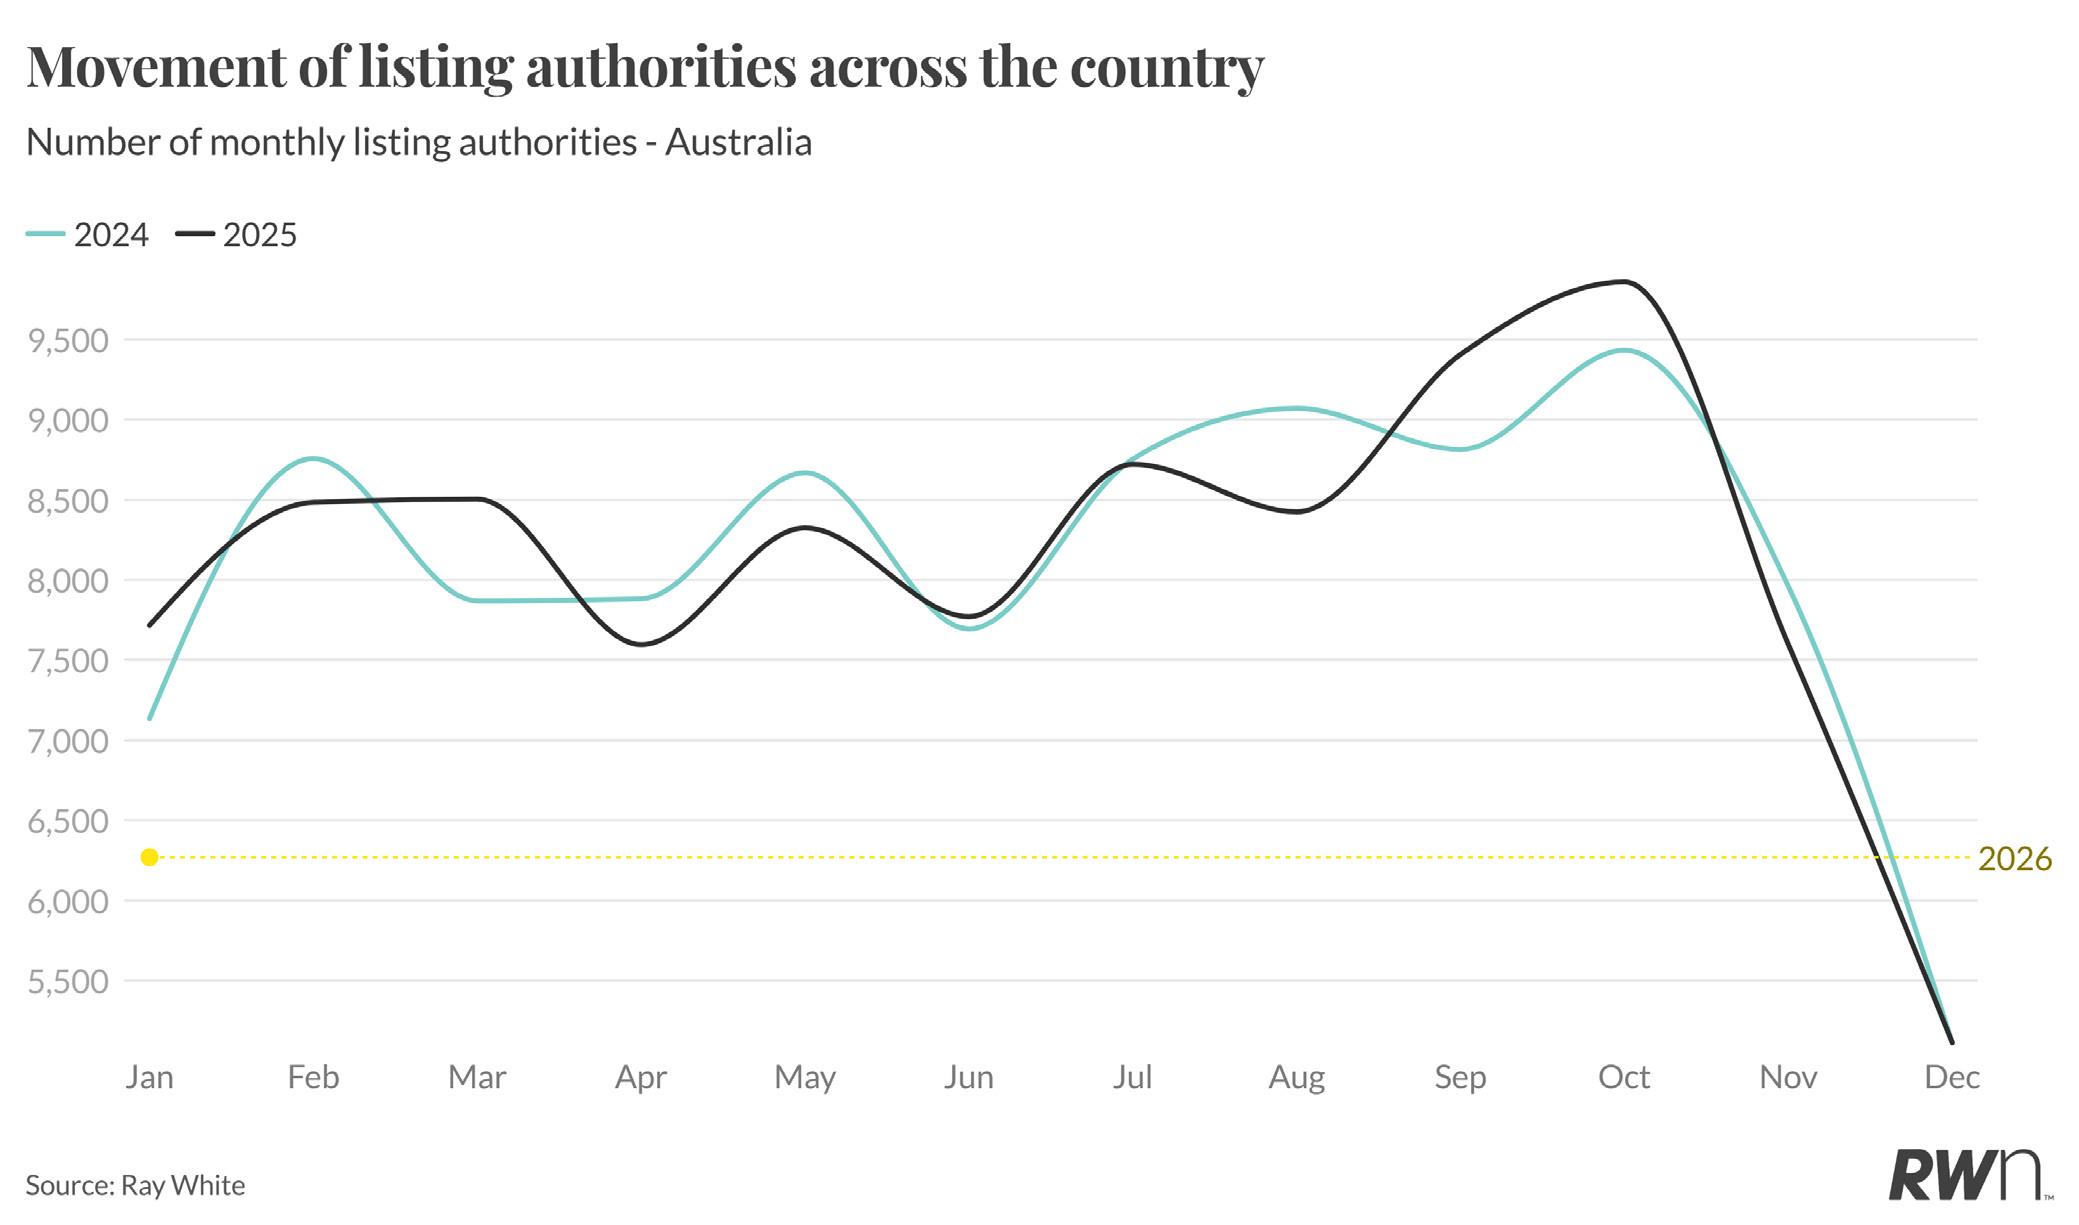

Ray White listing authorities reached 6,269 in January 2026, marking a sharp decline from the elevated levels recorded through the final months of 2025 and reflecting the typical quiet start to the year. This represents a substantial decrease from the peak of 9,859 authorities recorded in October 2025, as vendors scaled back listing commitments during the summer holiday period. The January 2026 figure tracks below both January 2025’s 7,716 authorities and January 2024’s 7,135, suggesting more cautious vendor sentiment heading into the new year compared to recent years.
The monthly trajectory through 2025 showed authorities building from 7,595 in April to the October peak, before declining through November (7,597) and December (5,113).
The Reserve Bank’s decision to raise rates in early February is likely to further influence vendor behaviour in coming months, with some potential sellers possibly delaying listing decisions while they assess how higher borrowing costs affect buyer demand and price expectations. Listing authorities provide a forward-looking indicator of supply coming to market, and the subdued January pipeline suggests listing volumes may remain relatively constrained through early 2026, maintaining support for price stability across most markets despite the more challenging interest rate environment.
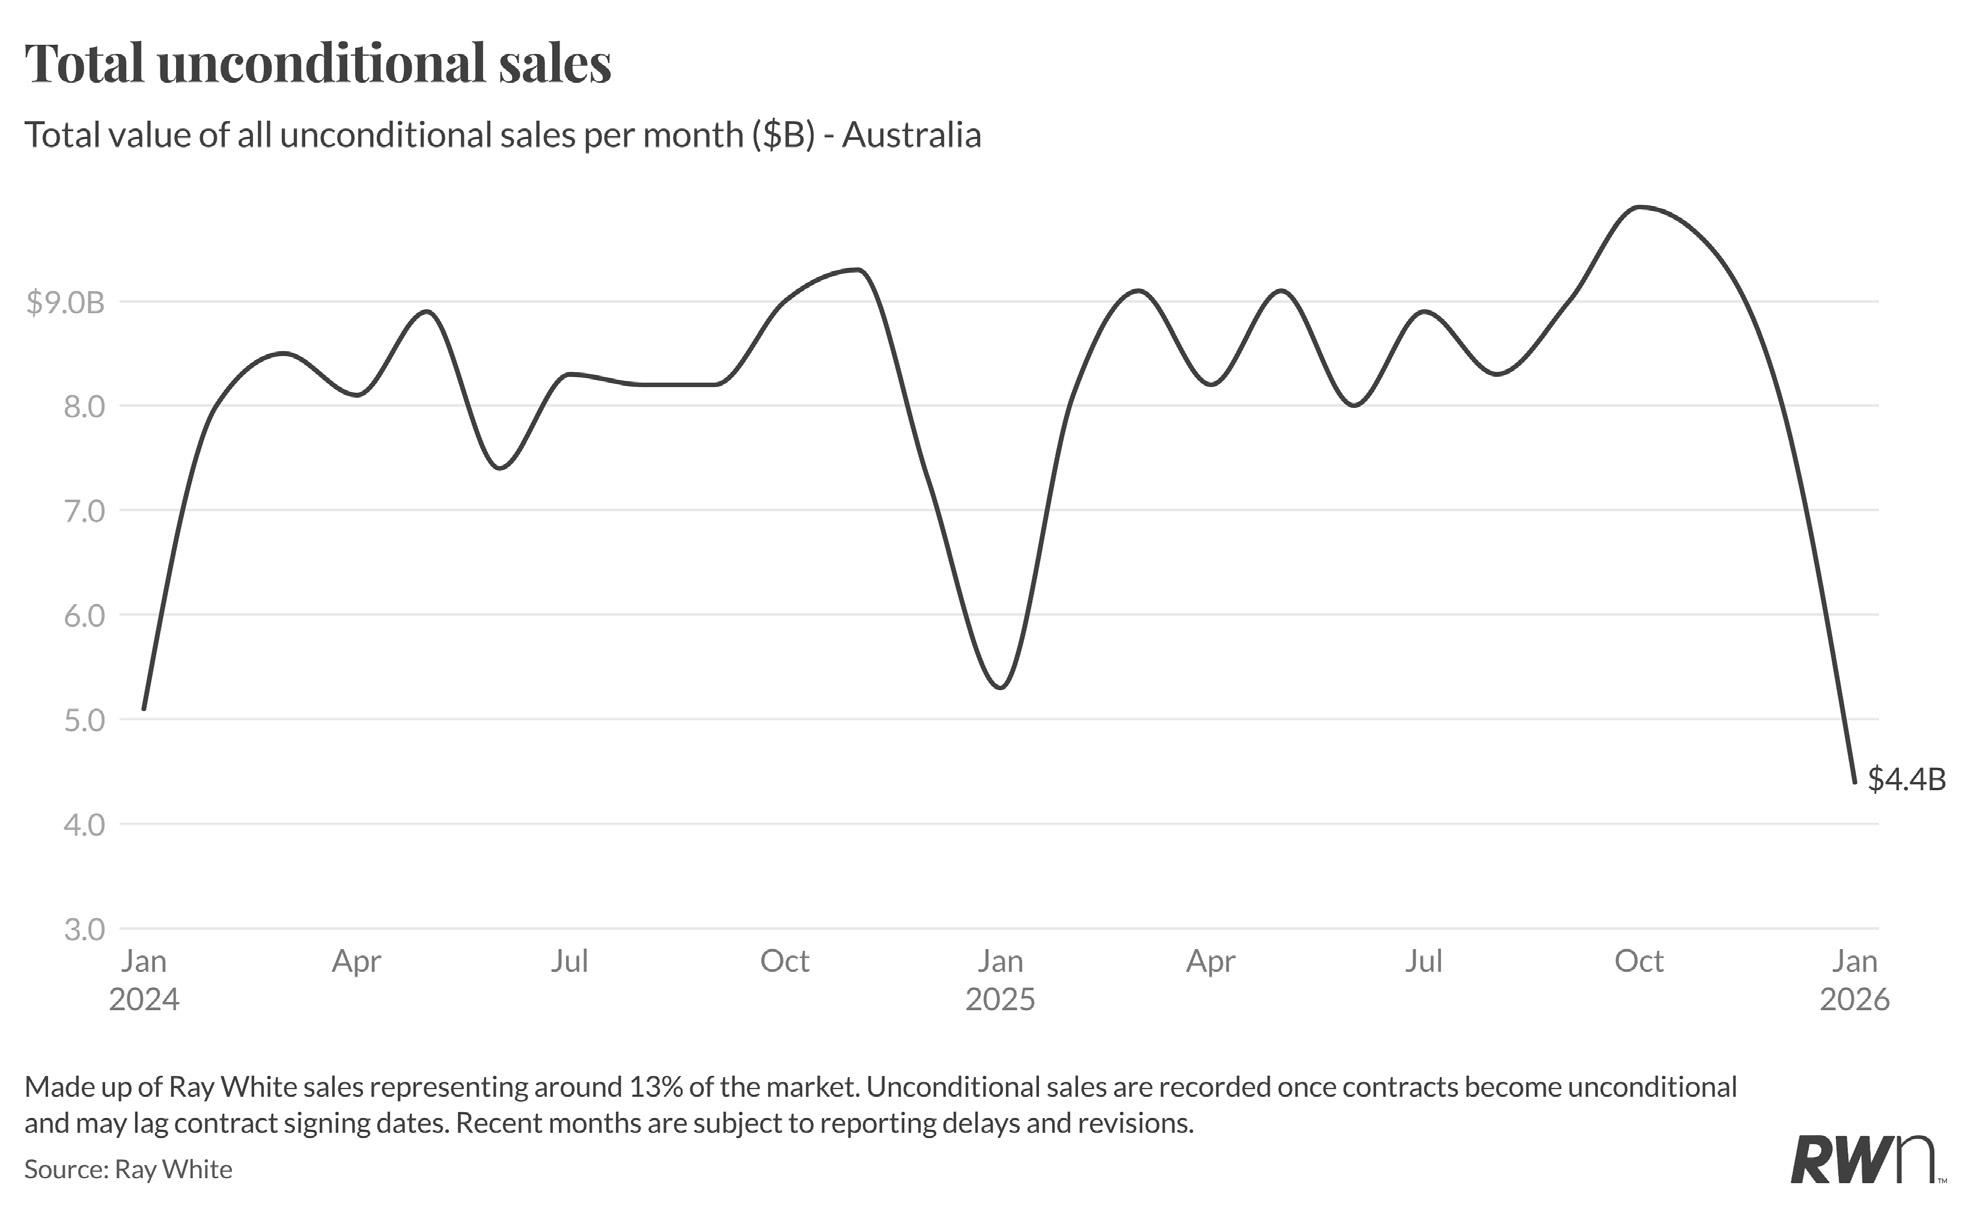
Ray White unconditional sales totalled approximately $4.4 billion in January 2026, representing a substantial decline from the prior month as expected during the traditional summer slowdown. This figure sits notably below the elevated levels recorded through much of 2025, when monthly unconditional sales typically ranged between $8 billion and $9.5 billion. The January contraction reflects both seasonal factors and the timing lag inherent in unconditional sales data, which captures transactions as contracts become unconditional rather than at the point of initial agreement.
Year-on-year comparisons show January 2026 tracking broadly in line with January 2025 patterns, suggesting transaction activity remained relatively stable despite ongoing uncertainty around interest rate settings. Ray White’s high market share means the data provides a robust indicator of broader market trends, with the structural housing shortage expected to maintain ongoing transaction activity even if volumes moderate from 2025’s elevated levels.