

TIFFANY PEREZ | 0418 634 085
MARY ORFANOS | 0422 889 000

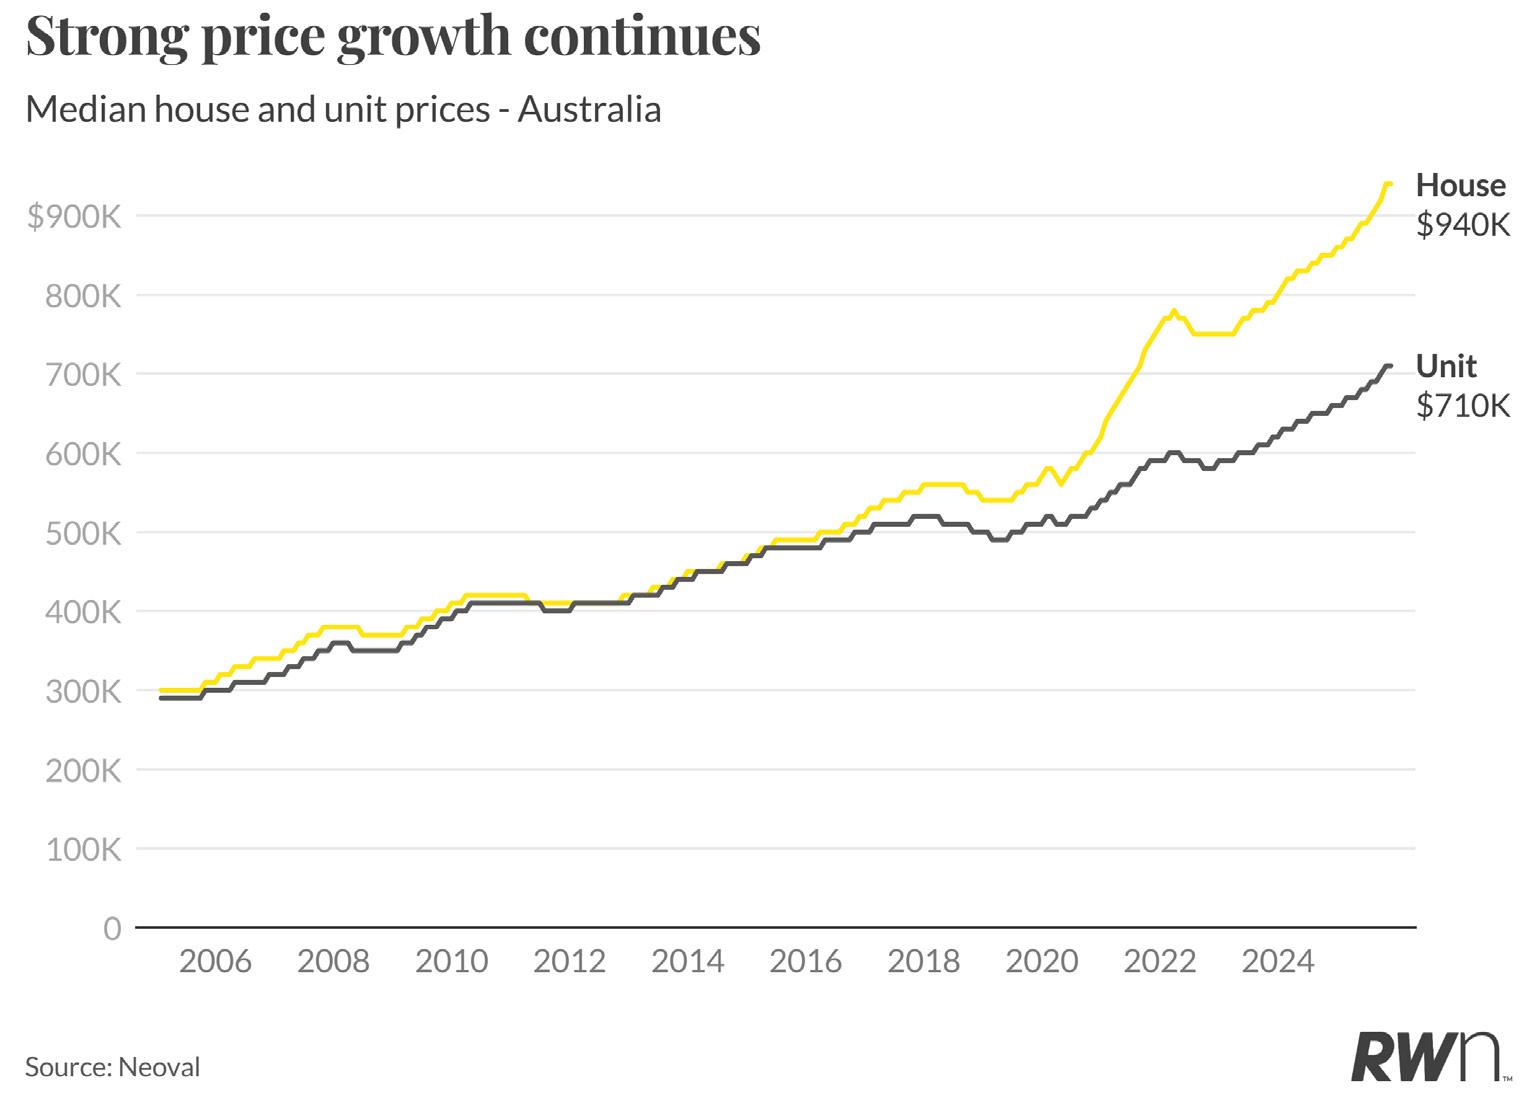
Australia’s national median house price held steady in November at $940,000, marking the first month without growth since January. Median unit price similarly remained unchanged at $710,000. This pause follows ten consecutive months of gains that delivered the first double-digit annual house price growth since the pandemic boom, with houses up 10.9 per cent and units up 8.6 per cent year-on-year.
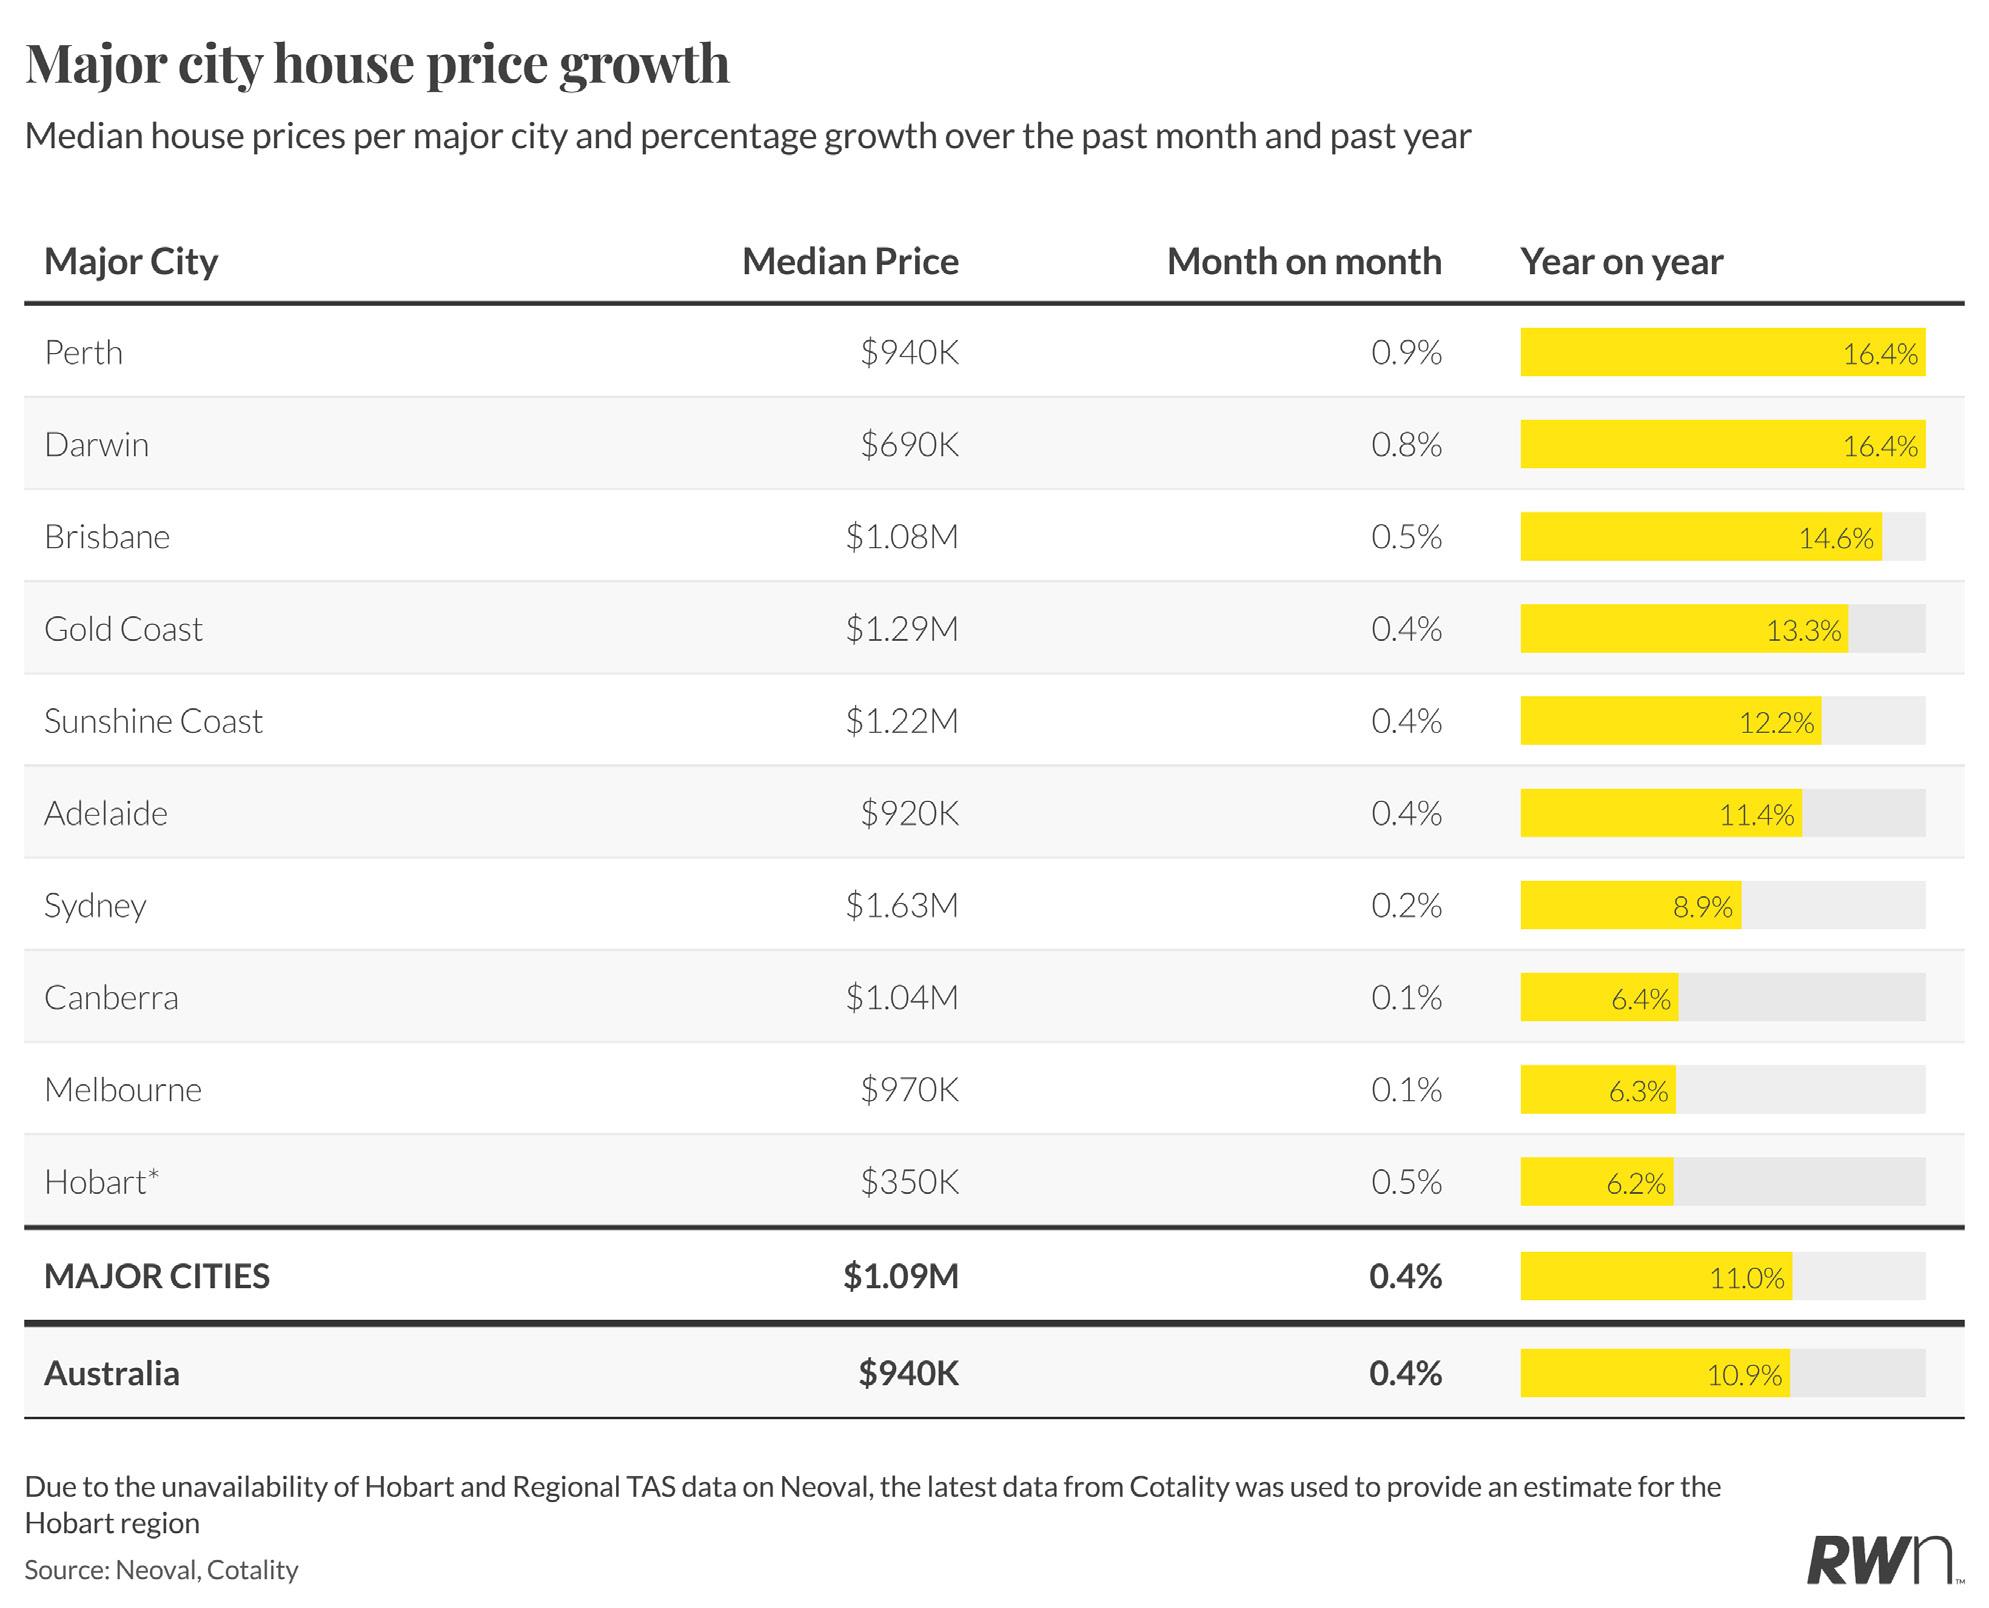
The flat national result masks continuing divergence across markets. Perth maintained its position as the nation’s strongest performer with 0.9 per cent monthly house price growth, whilst Darwin matched this momentum with 0.8 per cent gains. Brisbane and Adelaide also recorded solid monthly improvements of 0.5 per cent and 0.4 per cent respectively. In contrast, Sydney, Melbourne and Canberra all recorded minimal monthly movement, with each market rising just 0.1 to 0.2 per cent. This deceleration in the larger eastern capitals, which carry substantial weight in the national figures, accounts for the overall pause despite ongoing strength in Western Australia, Darwin and regional markets where supply constraints continue driving price appreciation.
Perth continues to dominate major city house price performance, recording 0.9 per cent monthly growth to reach a median of $940,000. The city’s annual growth of 16.4 per cent reflects sustained demand meeting severely constrained supply. Darwin matches Perth’s monthly momentum with 0.8 per cent growth, pushing its median to $690,000 and maintaining annual growth of 16.4 per cent. Brisbane posted 0.5 per cent monthly growth to $1.08 million, with annual gains of 14.6 per cent demonstrating the strength of Queensland’s capital market.
Adelaide recorded 0.4 per cent monthly growth to $920,000, whilst its annual growth of 11.4 per cent positions it as one of the nation’s more affordable capital cities experiencing solid appreciation. The Gold Coast and Sunshine Coast both recorded 0.4 per cent monthly increases, with annual growth of 13.3 per cent and 12.2 per cent respectively. Sydney managed just 0.2 per cent monthly growth to $1.63 million, with annual gains moderating to 8.9 per cent. Melbourne and Canberra both recorded minimal monthly movement of 0.1 per
cent, with their annual growth rates of 6.3 per cent and 6.4 per cent respectively representing the weakest performance among major capitals. Hobart posted 0.5 per cent monthly growth to $350,000, though its annual gain of 6.2 per cent reflects the more subdued conditions in the Tasmanian market.

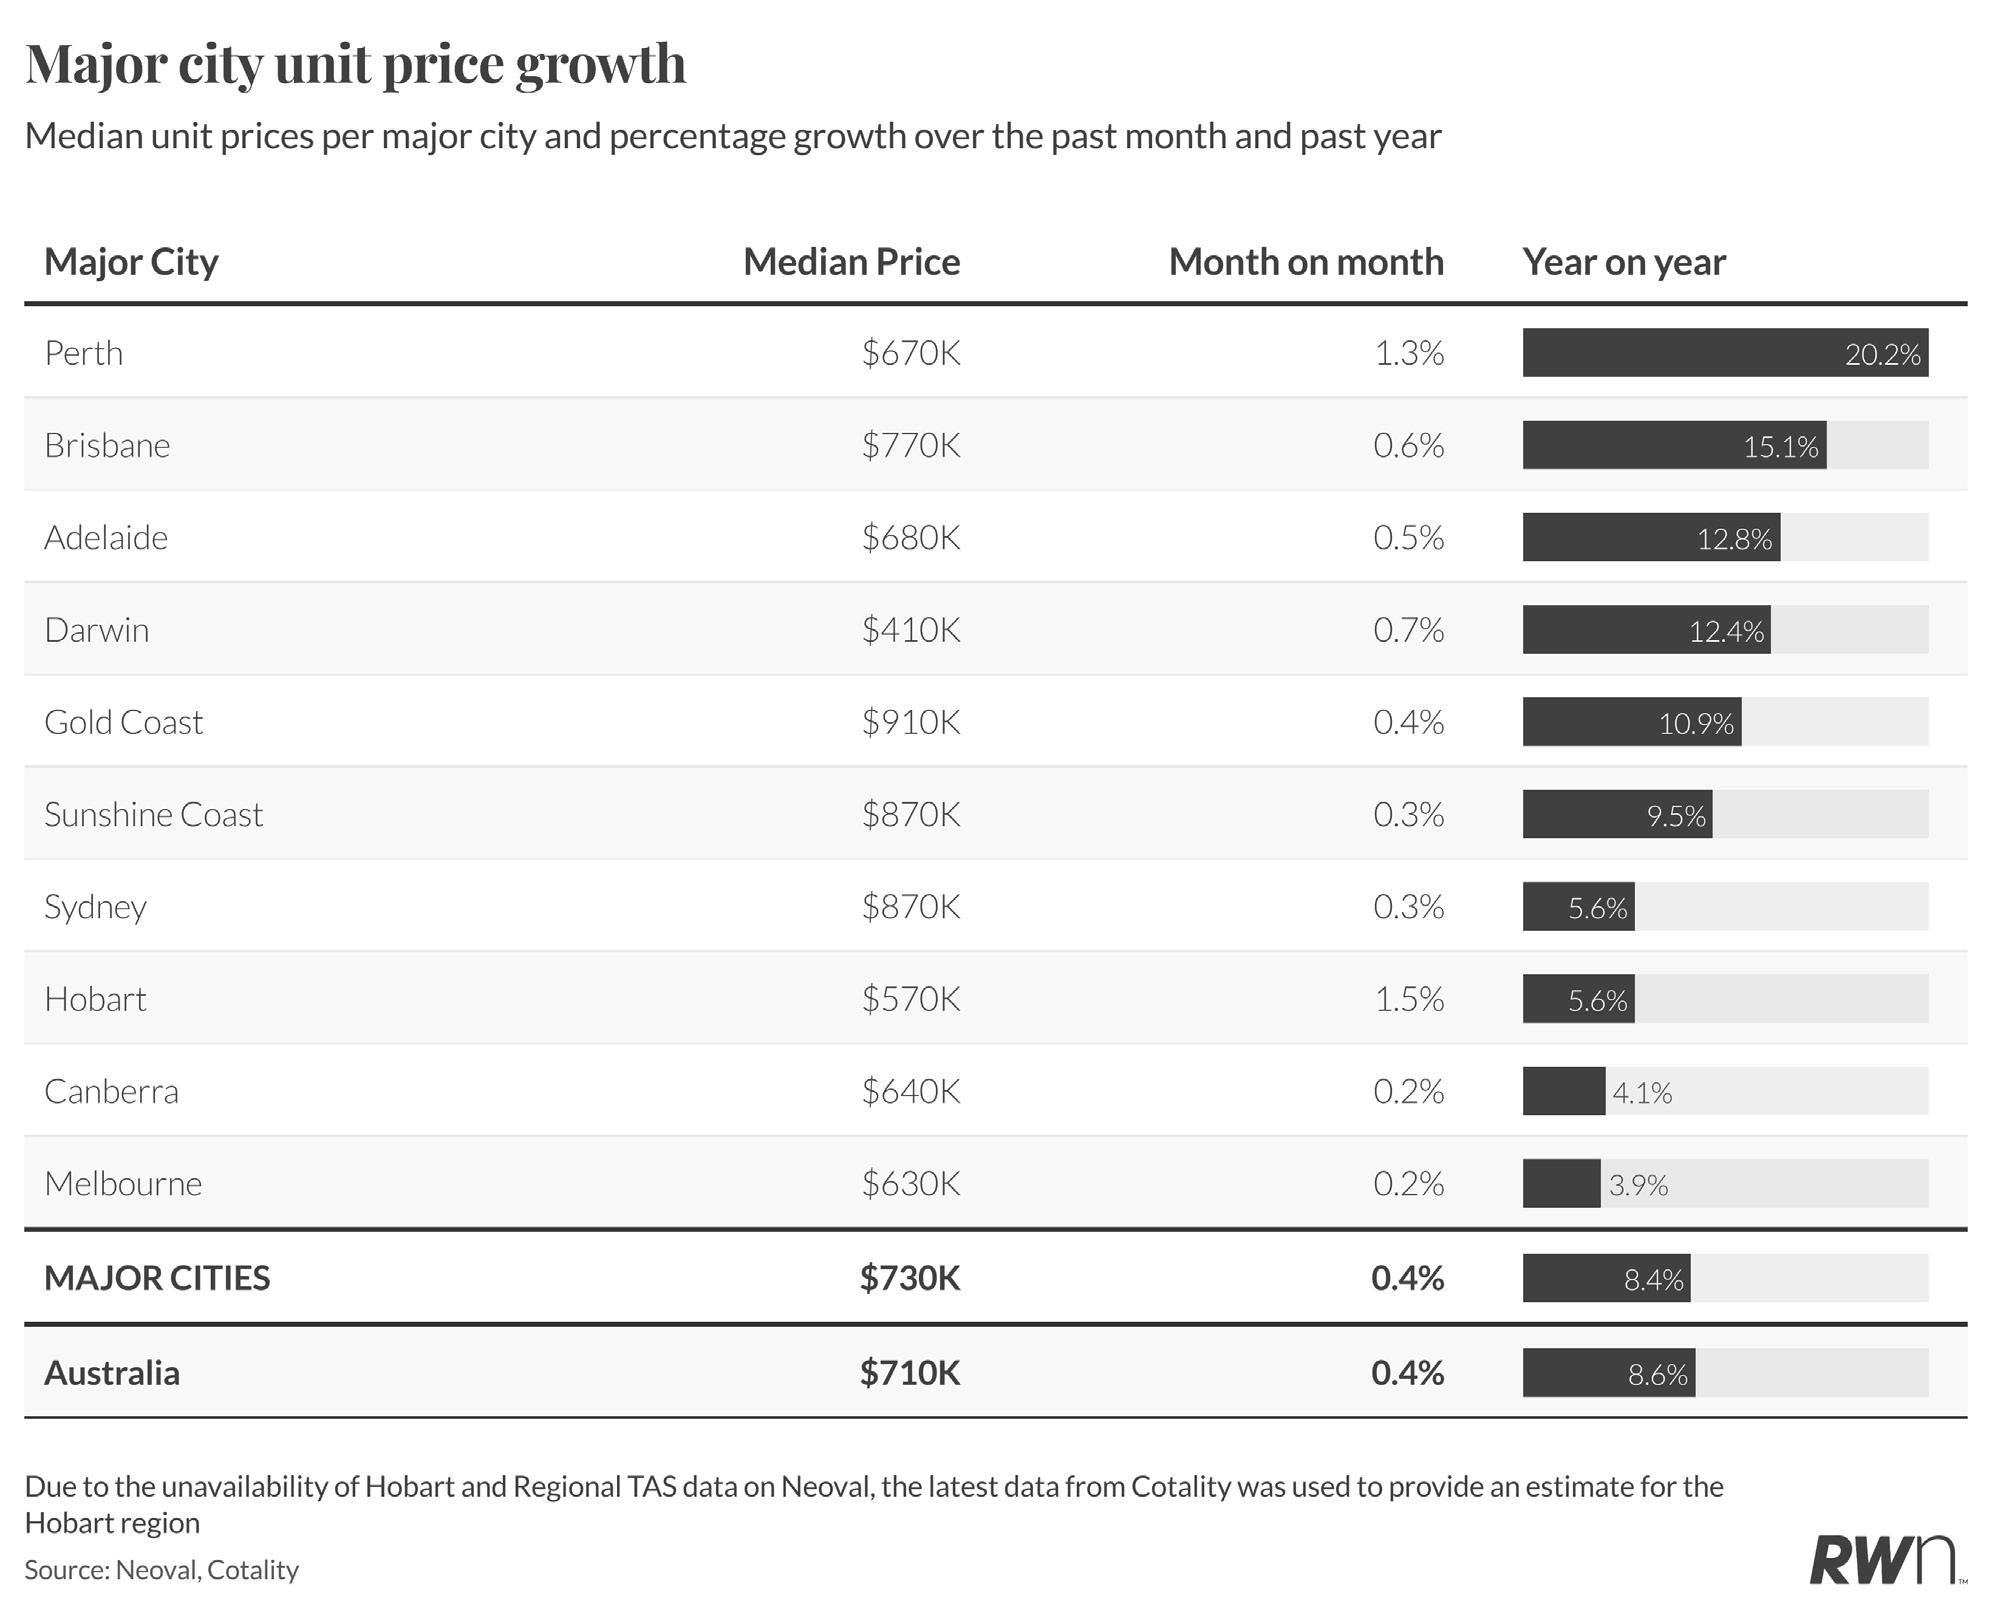
Perth leads the major city unit market with exceptional 1.3 per cent monthly growth, driving the median to $670,000 and delivering annual growth of 20.2 per cent. This represents the strongest performance across all capital city unit markets. Brisbane follows with 0.6 per cent monthly growth to $770,000 and annual appreciation of 15.1 per cent, whilst Adelaide posted 0.5 per cent monthly growth to $680,000 with annual gains of 12.8 per cent.
Darwin recorded 0.7 per cent monthly growth to $410,000, maintaining annual growth of 12.4 per cent despite its smaller market size. The Gold Coast and Sunshine Coast both recorded modest monthly increases of 0.4 per cent and 0.3 per cent respectively, with annual growth of 10.9 per cent and 9.5 per cent. Sydney’s unit market posted 0.3 per cent monthly growth to $870,000, though annual growth has moderated to 5.6 per cent. Hobart recorded the strongest monthly movement among the smaller capitals with 1.5 per cent growth to $570,000, though annual gains remain modest at 5.6 per cent. Canberra and Melbourne represent the weakest
major city unit markets, with monthly growth of just 0.2 per cent and annual appreciation of 4.1 per cent and 3.9 per cent respectively.

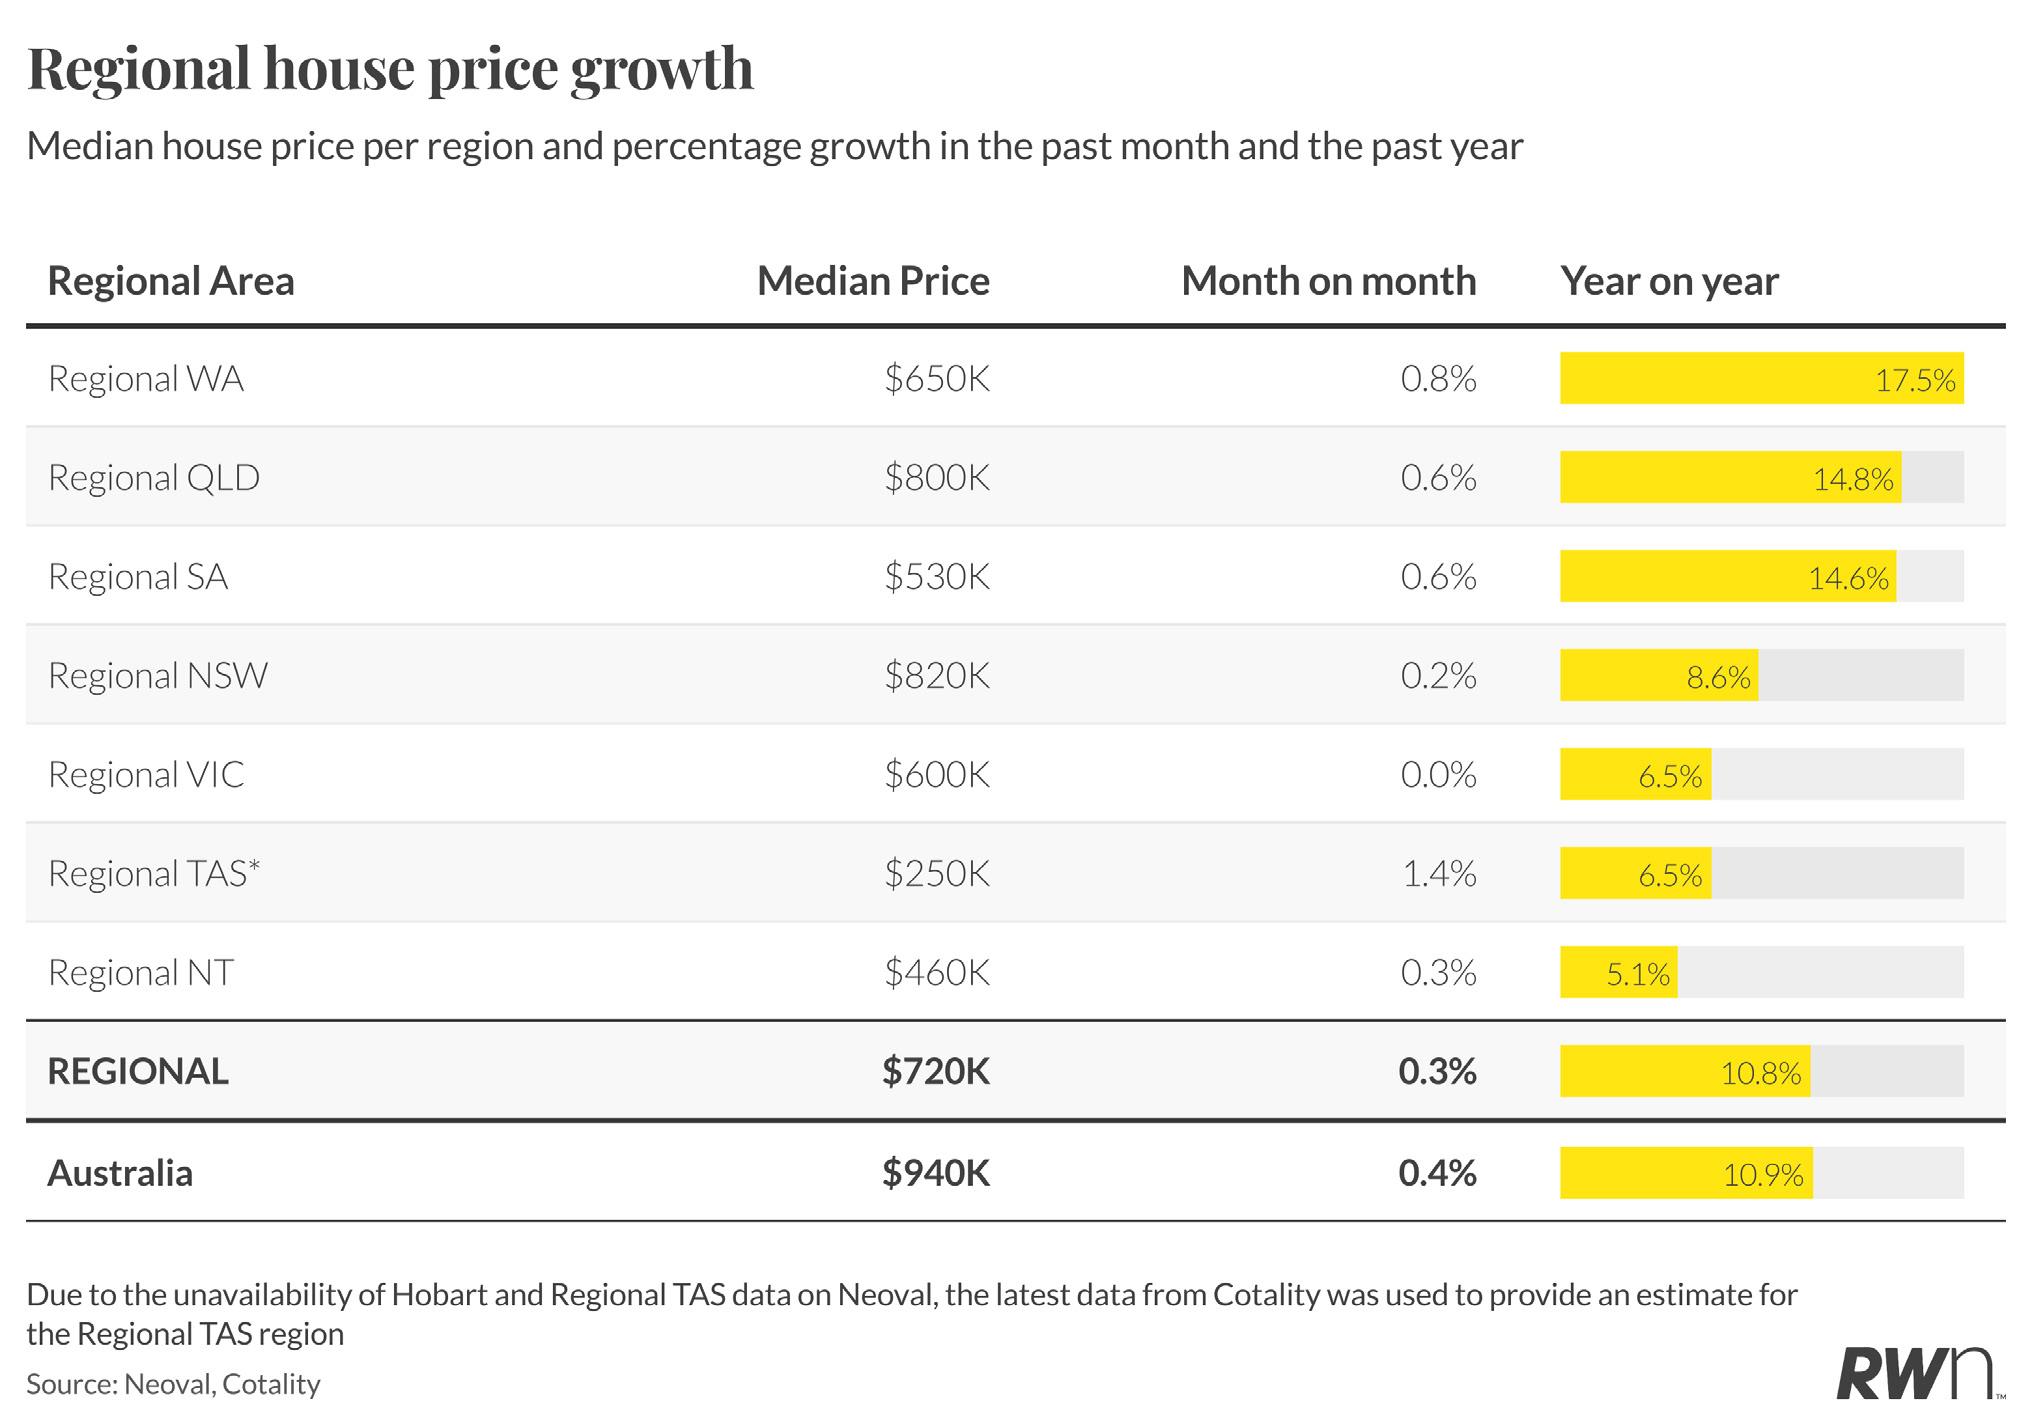
Regional Western Australia continues to lead the nation’s regional housing markets with 0.8 per cent monthly growth, pushing the median to $650,000 and maintaining exceptional annual growth of 17.5 per cent. Regional South Australia and Queensland both recorded 0.6 per cent monthly increases, with medians of $530,000 and $800,000 respectively. South Australia’s annual growth of 14.6 per cent demonstrates the strength of demand in areas surrounding Adelaide, whilst Queensland’s 14.8 per cent annual gain reflects ongoing migration patterns and lifestyle preferences driving regional demand.
Regional New South Wales posted modest 0.2 per cent monthly growth to $820,000, with annual gains of 8.6 per cent representing a more measured pace compared to other states. Regional Victoria recorded no monthly movement at $600,000, though annual growth of 6.5 per cent indicates ongoing underlying demand. Regional Tasmania posted 1.4 per cent monthly growth to $250,000, the strongest monthly result across all regional markets, though this represents its smaller market dynamics rather than broad-based strength. Regional Northern Territory managed 0.3 per cent monthly growth to $460,000, with annual gains of 5.1 per cent reflecting the more subdued conditions in this market.
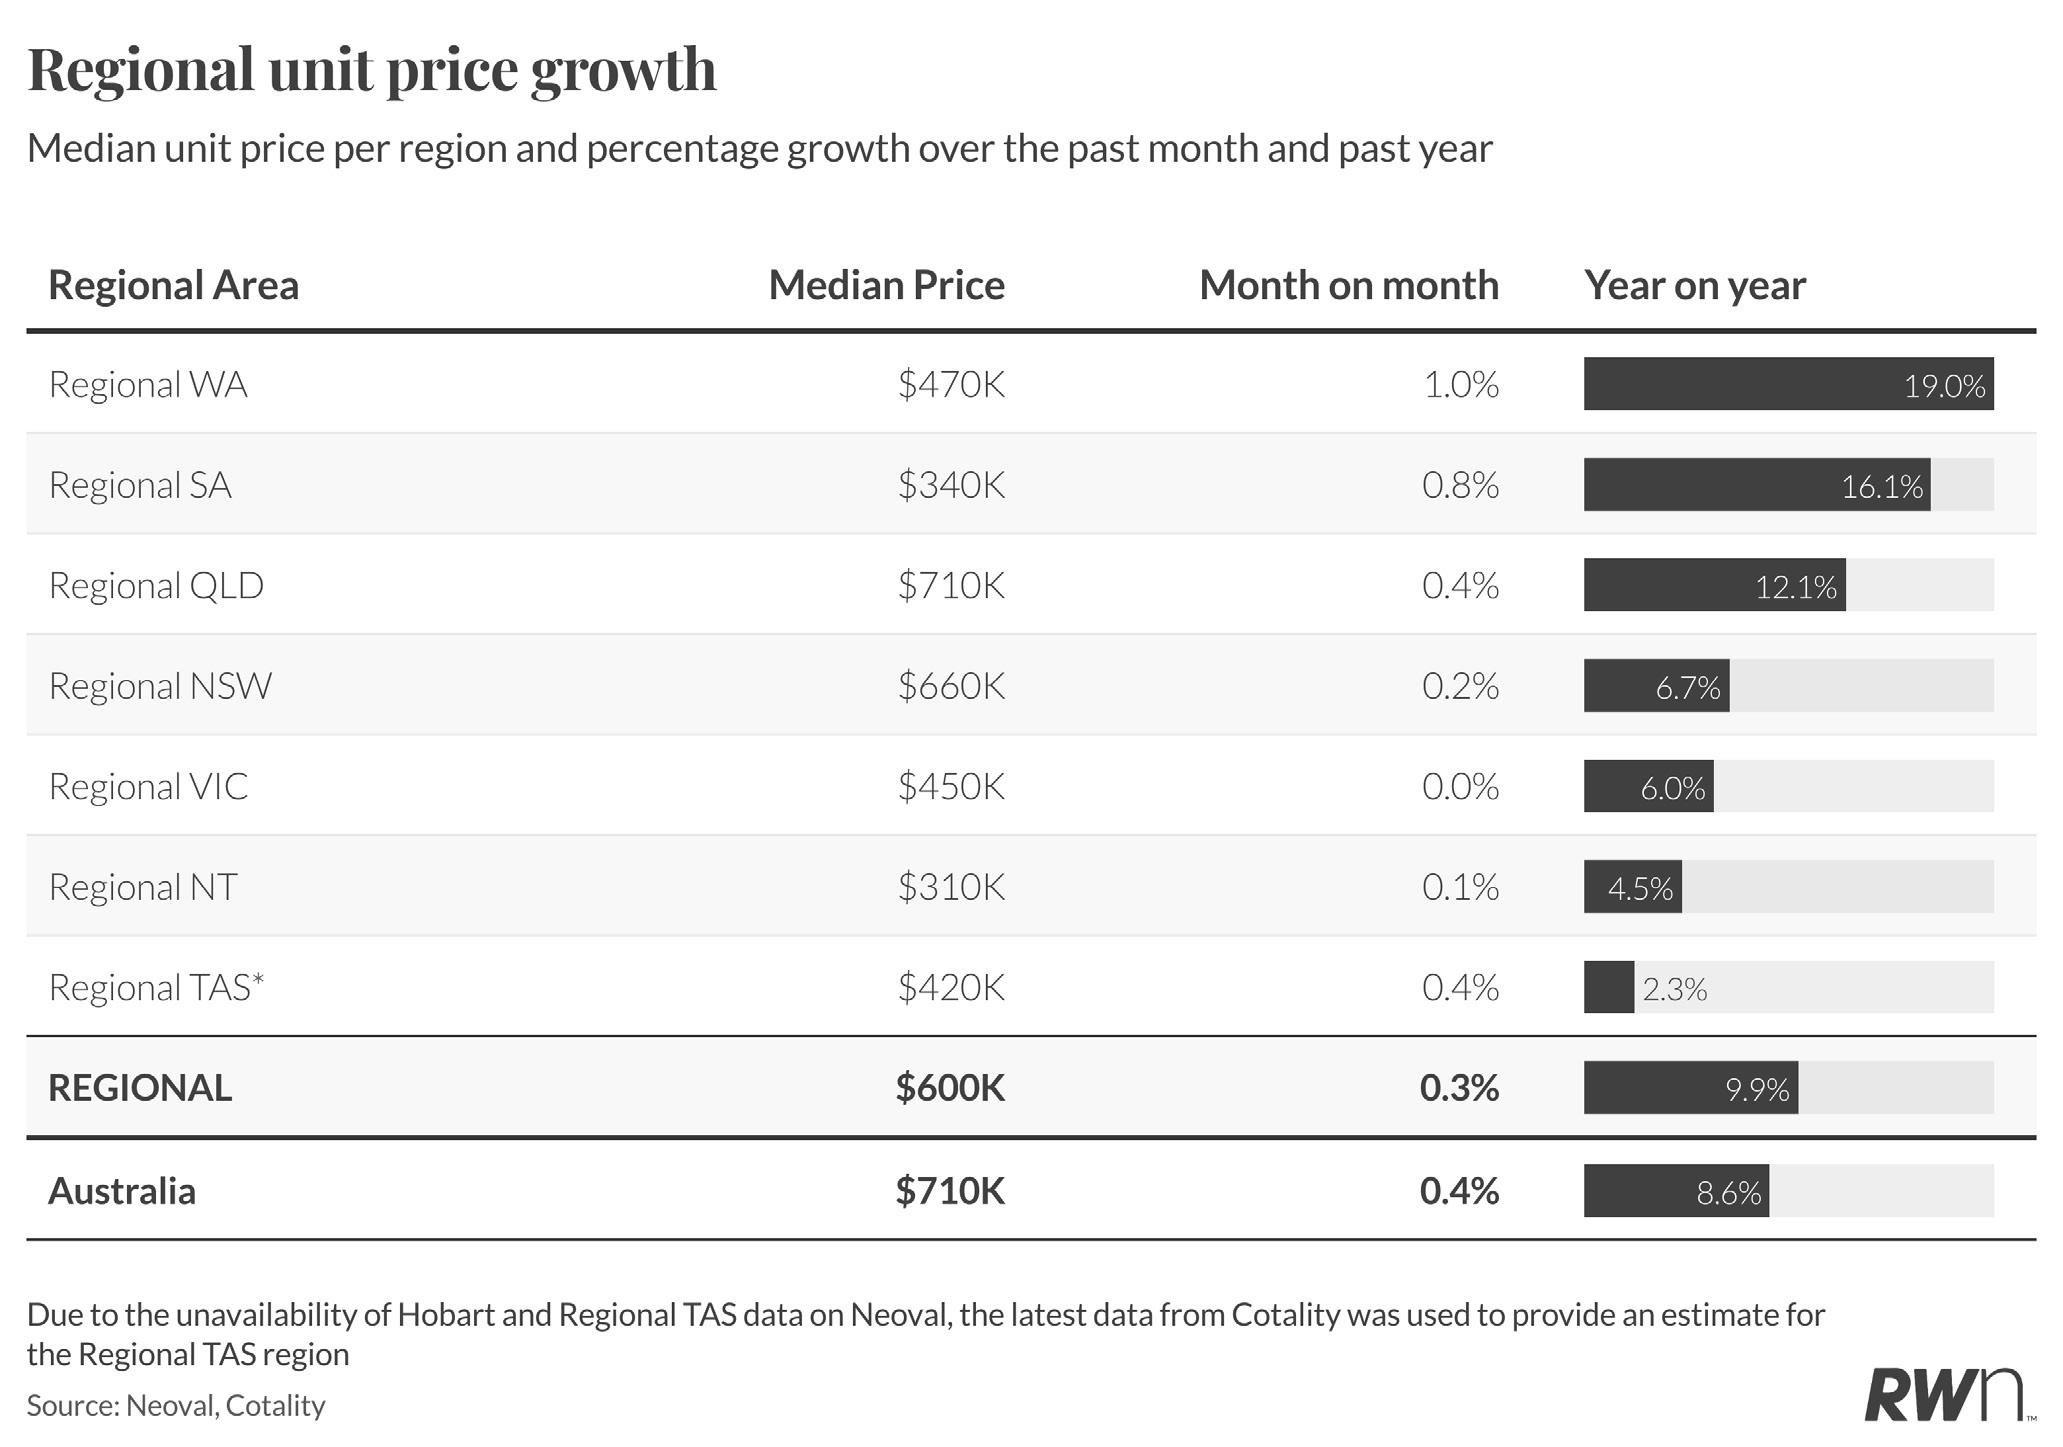
Regional Western Australia dominates the regional unit sector with 1.0 per cent monthly growth, driving the median to $470,000 and delivering annual appreciation of 19.0 per cent. Regional South Australia follows with 0.8 per cent monthly growth to $340,000 and annual gains of 16.1 per cent, demonstrating the strength of demand for more affordable housing options in areas surrounding Adelaide.
Regional Queensland recorded 0.4 per cent monthly growth to $710,000, with annual appreciation of 12.1 per cent reflecting sustained demand for coastal and lifestyle locations. Regional Tasmania posted 0.4 per cent
monthly growth to $420,000, though its annual gain of just 2.3 per cent represents the weakest performance among regional unit markets. Regional New South Wales managed 0.2 per cent monthly growth to $660,000 with annual gains of 6.7 per cent, whilst regional Victoria recorded no monthly movement at $450,000 despite annual growth of 6.0 per cent. Regional Northern Territory posted minimal monthly growth of 0.1 per cent to $310,000, with annual gains of 4.5 per cent reflecting limited supply and demand dynamics in this smaller market.
Source: Neoval
Updated as of November 2025
MAJOR CITY HOUSE PRICES (%CHANGE) SINCE
REGIONAL AUSTRALIA $940,000 0.4%
REGIONAL HOUSE PRICES (%CHANGE) SINCE LAST MONTH
Source: Neoval
LISTINGS ACTIVITY
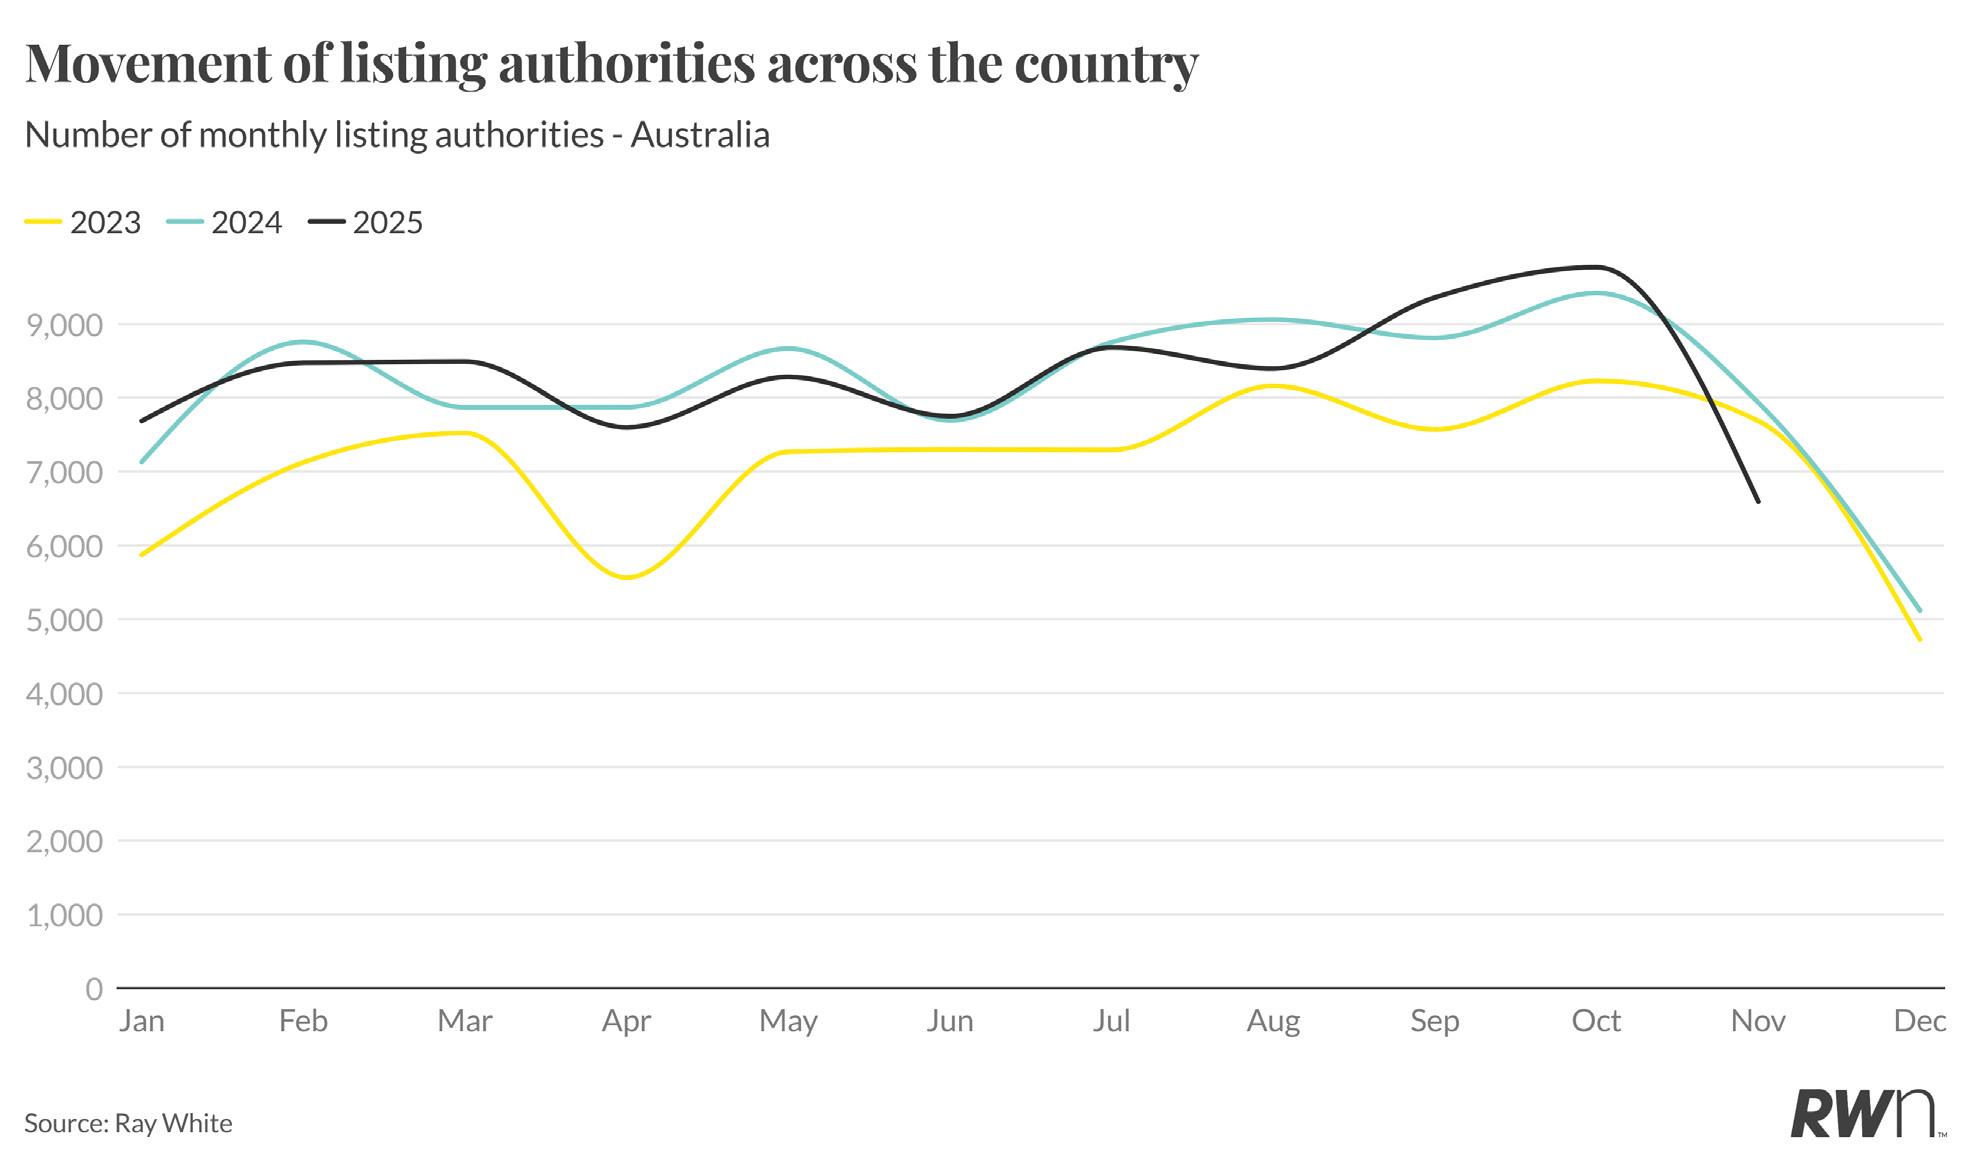
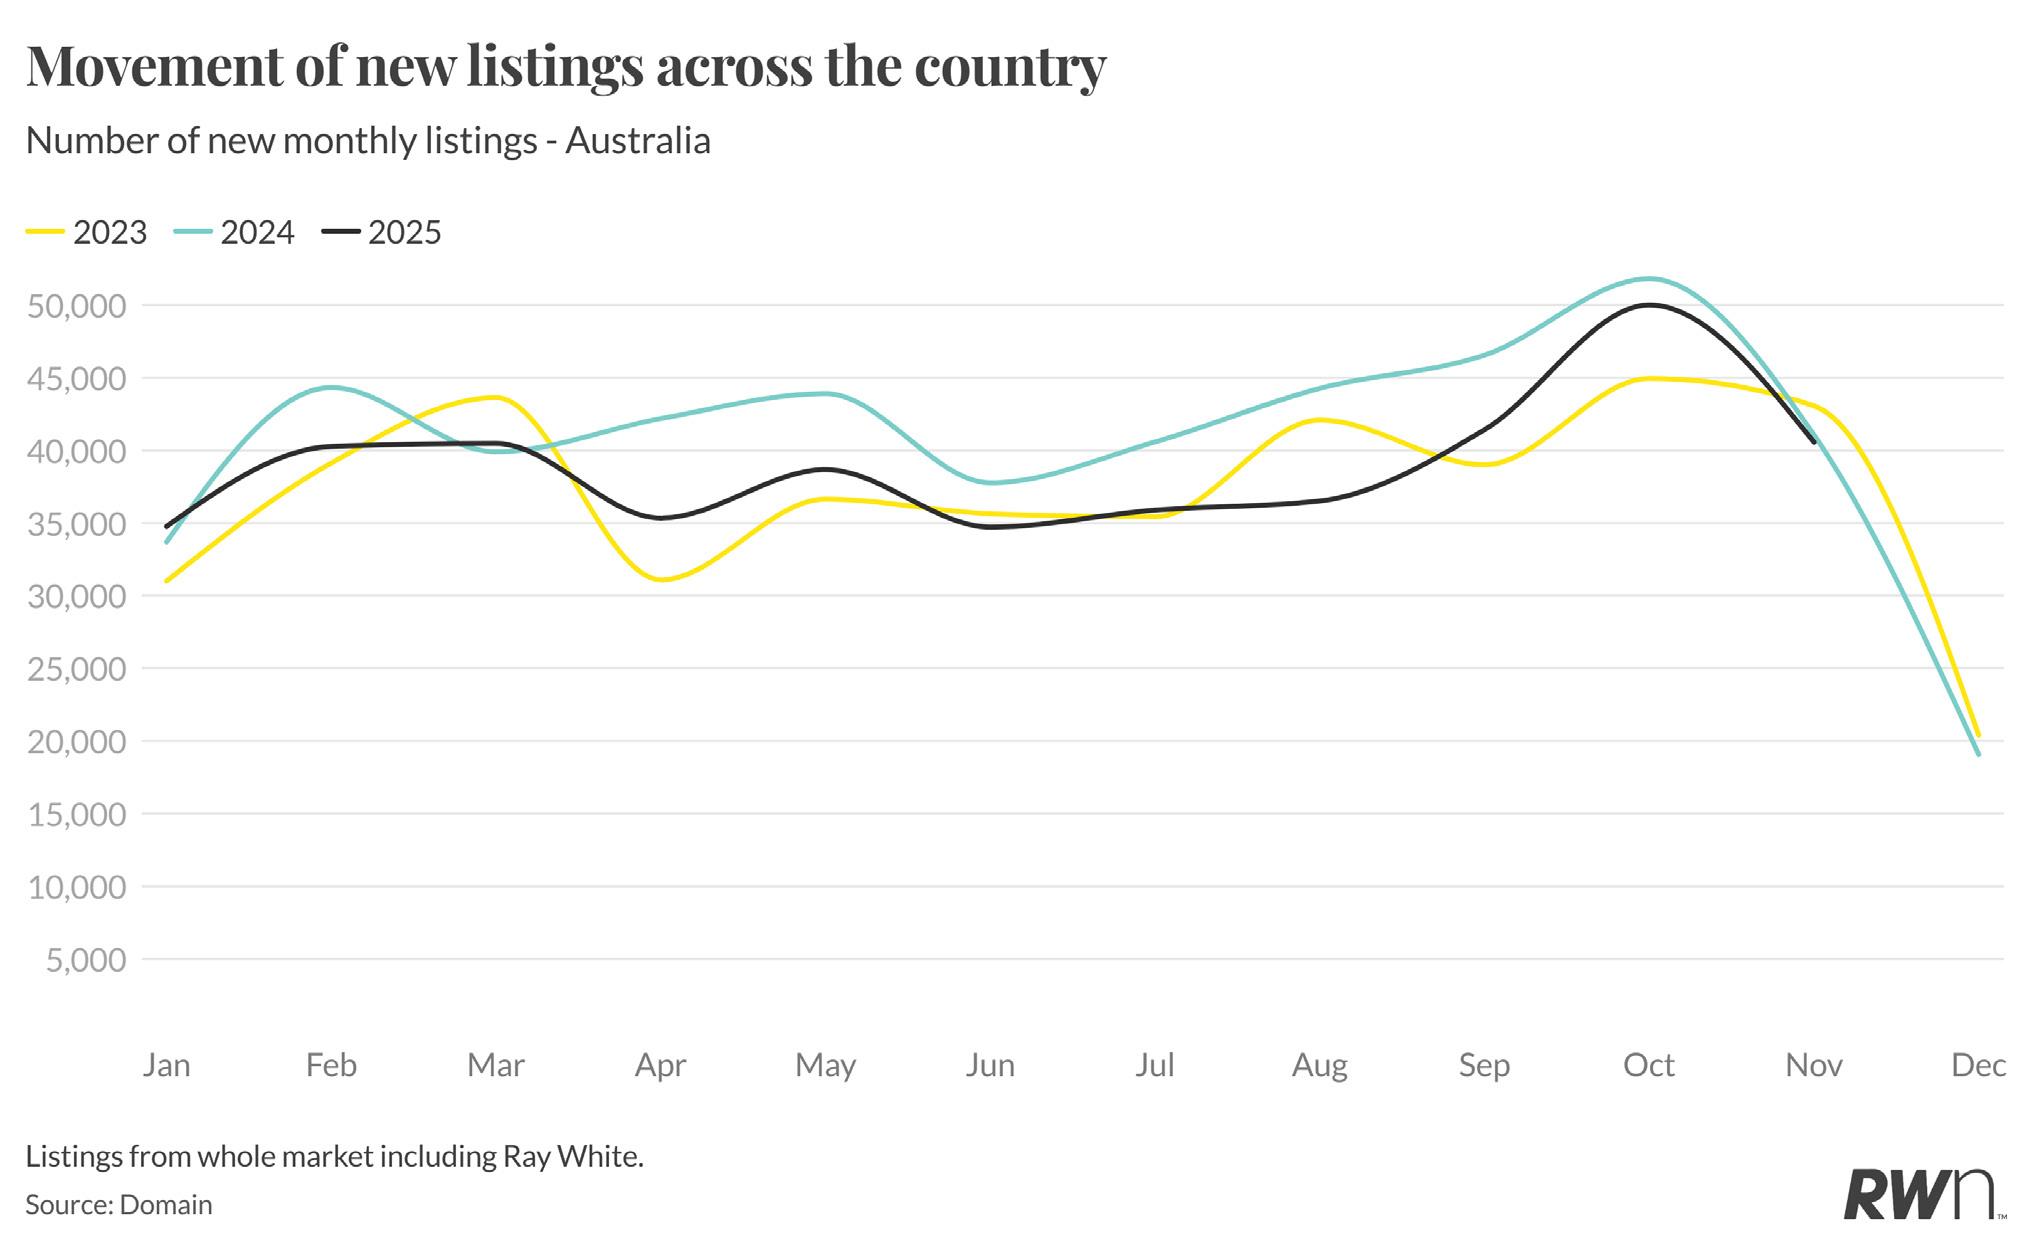
November listings fell sharply to 19,759 properties nationally, representing a 38.4 per cent decline from October’s 50,059 and a 9.5 per cent decrease compared to November 2024’s 21,838. This substantial contraction reflects the typical seasonal slowdown as the market enters the summer holiday period, with vendors increasingly reluctant to list properties during December when buyer activity traditionally diminishes.

The trajectory through 2025 demonstrates the familiar seasonal pattern, with listings building through winter and spring before the sharp November-December decline. The year tracked consistently above 2023 levels through most months, though generally below 2024’s elevated volumes. The November result marks the beginning of the traditional year-end lull, with December expected to see further significant declines as both vendors and buyers disengage ahead of the holiday season. This seasonal supply constraint, combined with ongoing demand pressures in supply-constrained markets, will likely support price stability through the quieter summer months before activity resumes in late January and February.
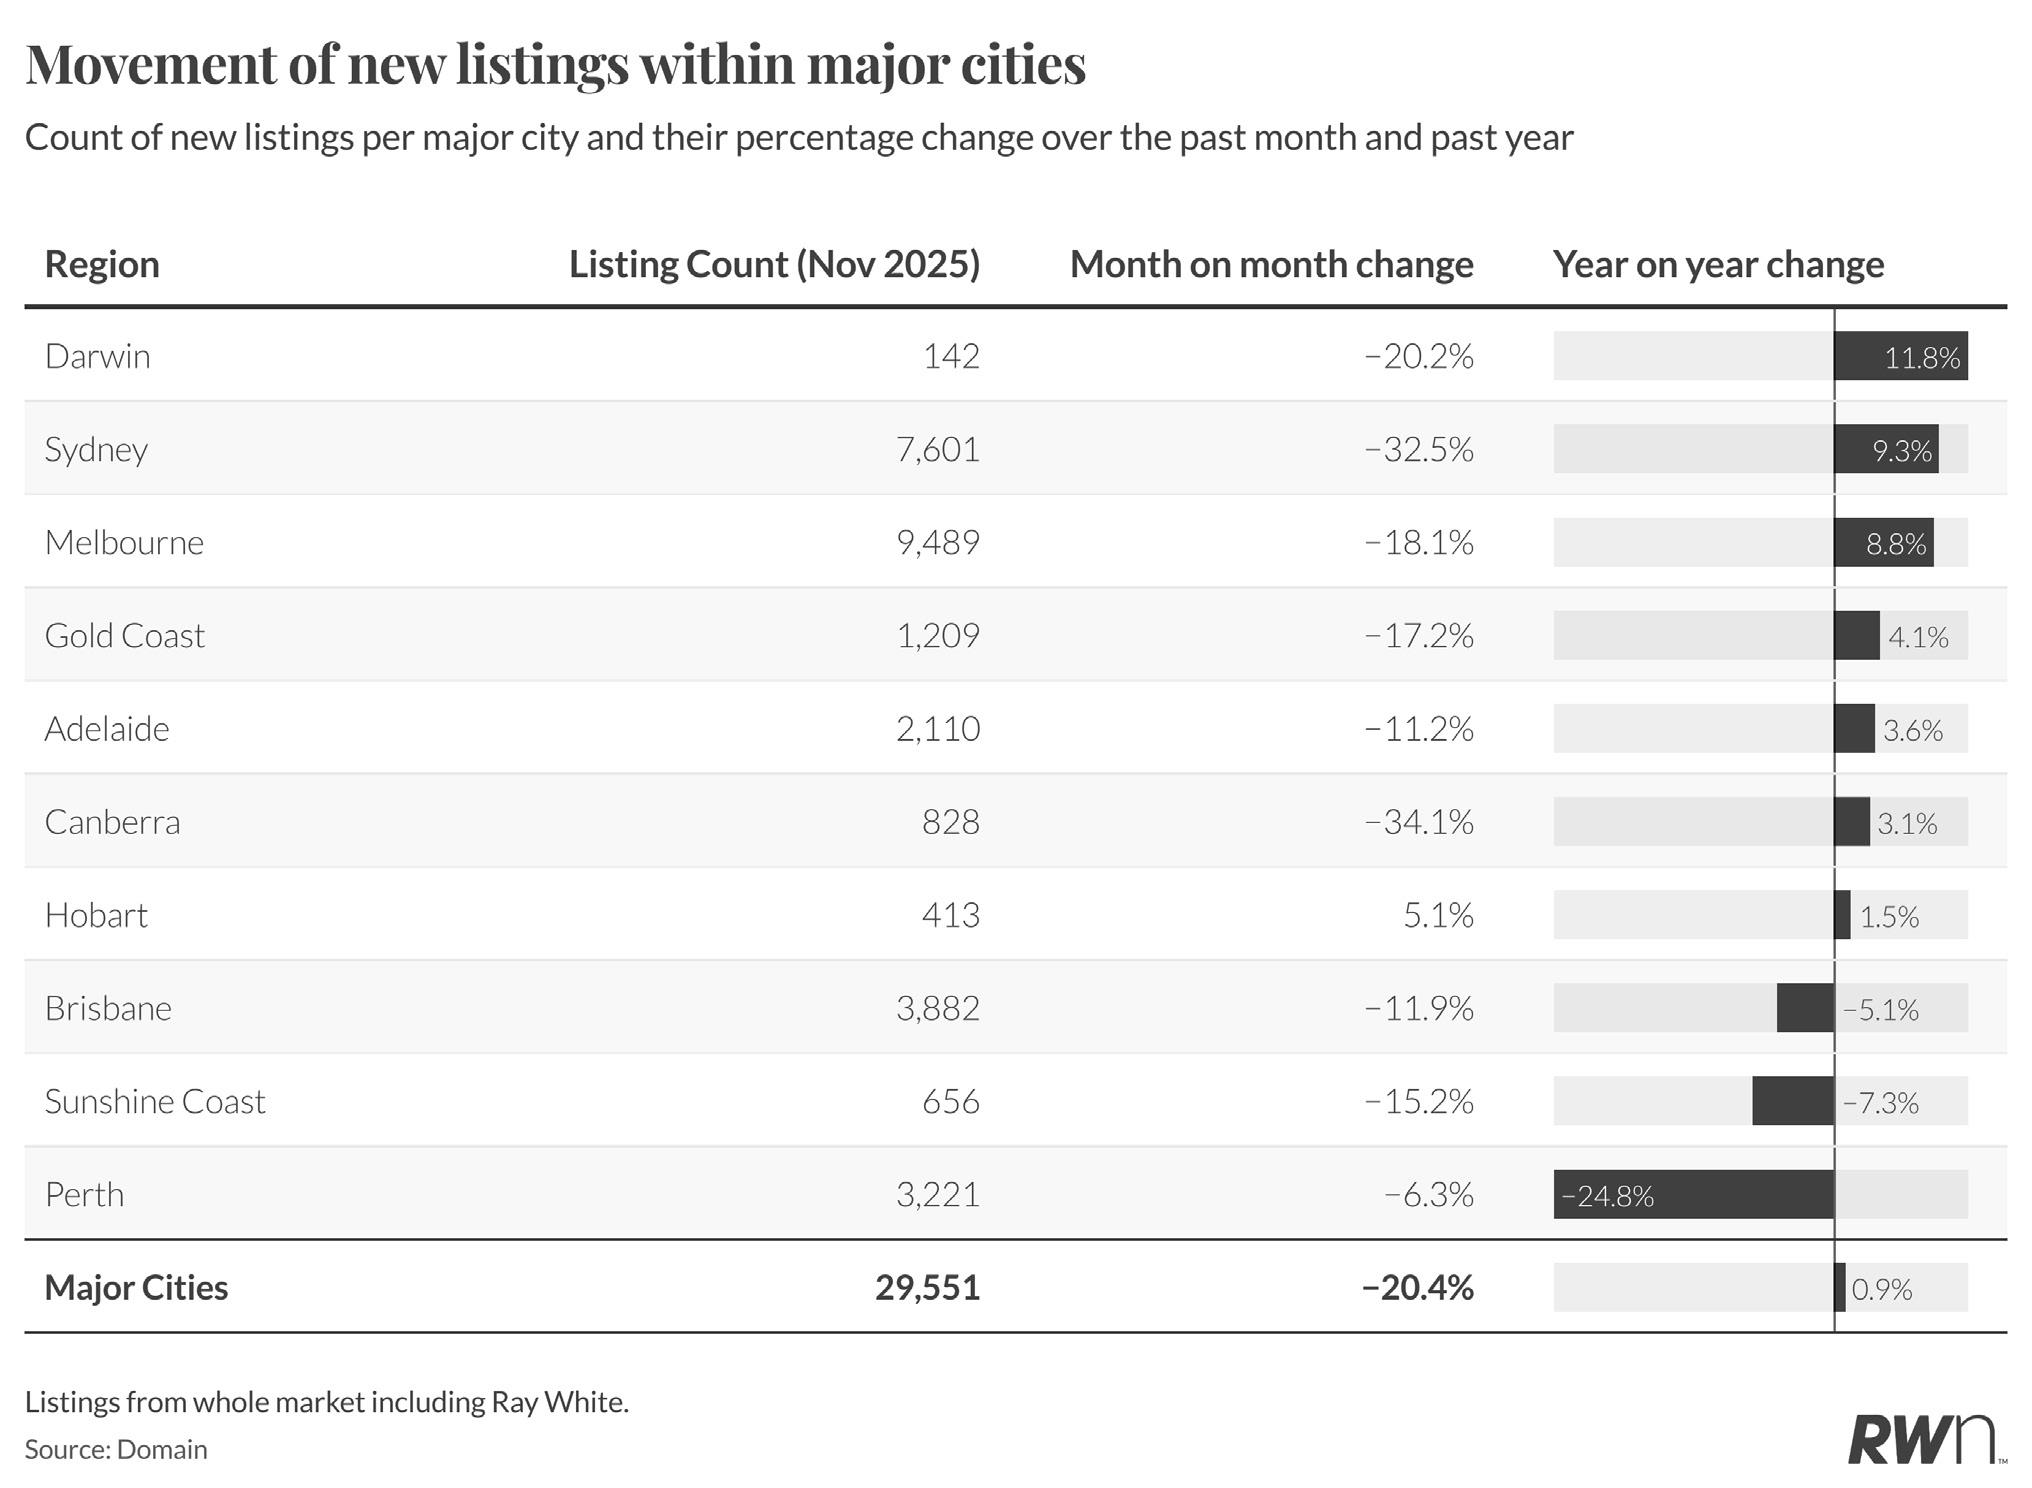
Major city listings declined sharply to 29,551 in November, down 20.4 per cent from October’s levels, though still recording modest 0.9 per cent annual growth. Sydney led absolute volumes with 7,601 new listings despite a substantial 32.5 per cent monthly decline, whilst maintaining 9.3 per cent annual growth. Melbourne recorded 9,489 listings, down 18.1 per cent month-on-month but up 8.8 per cent year-on-year.
Brisbane listings totalled 3,882, down 11.9 per cent monthly and 5.1 per cent annually, representing one of the few major cities experiencing year-on-year listing declines. Perth recorded the most dramatic annual contraction with listings down 24.8 per cent to 3,221, whilst the monthly decline of 6.3 per cent was more

modest compared to eastern capitals. Adelaide managed 2,110 listings despite an 11.2 per cent monthly decline, with annual growth of 3.6 per cent reflecting ongoing vendor confidence. Darwin recorded 142 listings, down 20.2 per cent monthly but maintaining annual growth of 11.8 per cent. Canberra experienced a severe 34.1 per cent monthly decline to 828 listings, though annual growth of 3.1 per cent indicates underlying supply improvement. Hobart bucked the monthly trend with 5.1 per cent growth to 413 listings, though annual growth of just 1.5 per cent reflects the more constrained Tasmanian market.
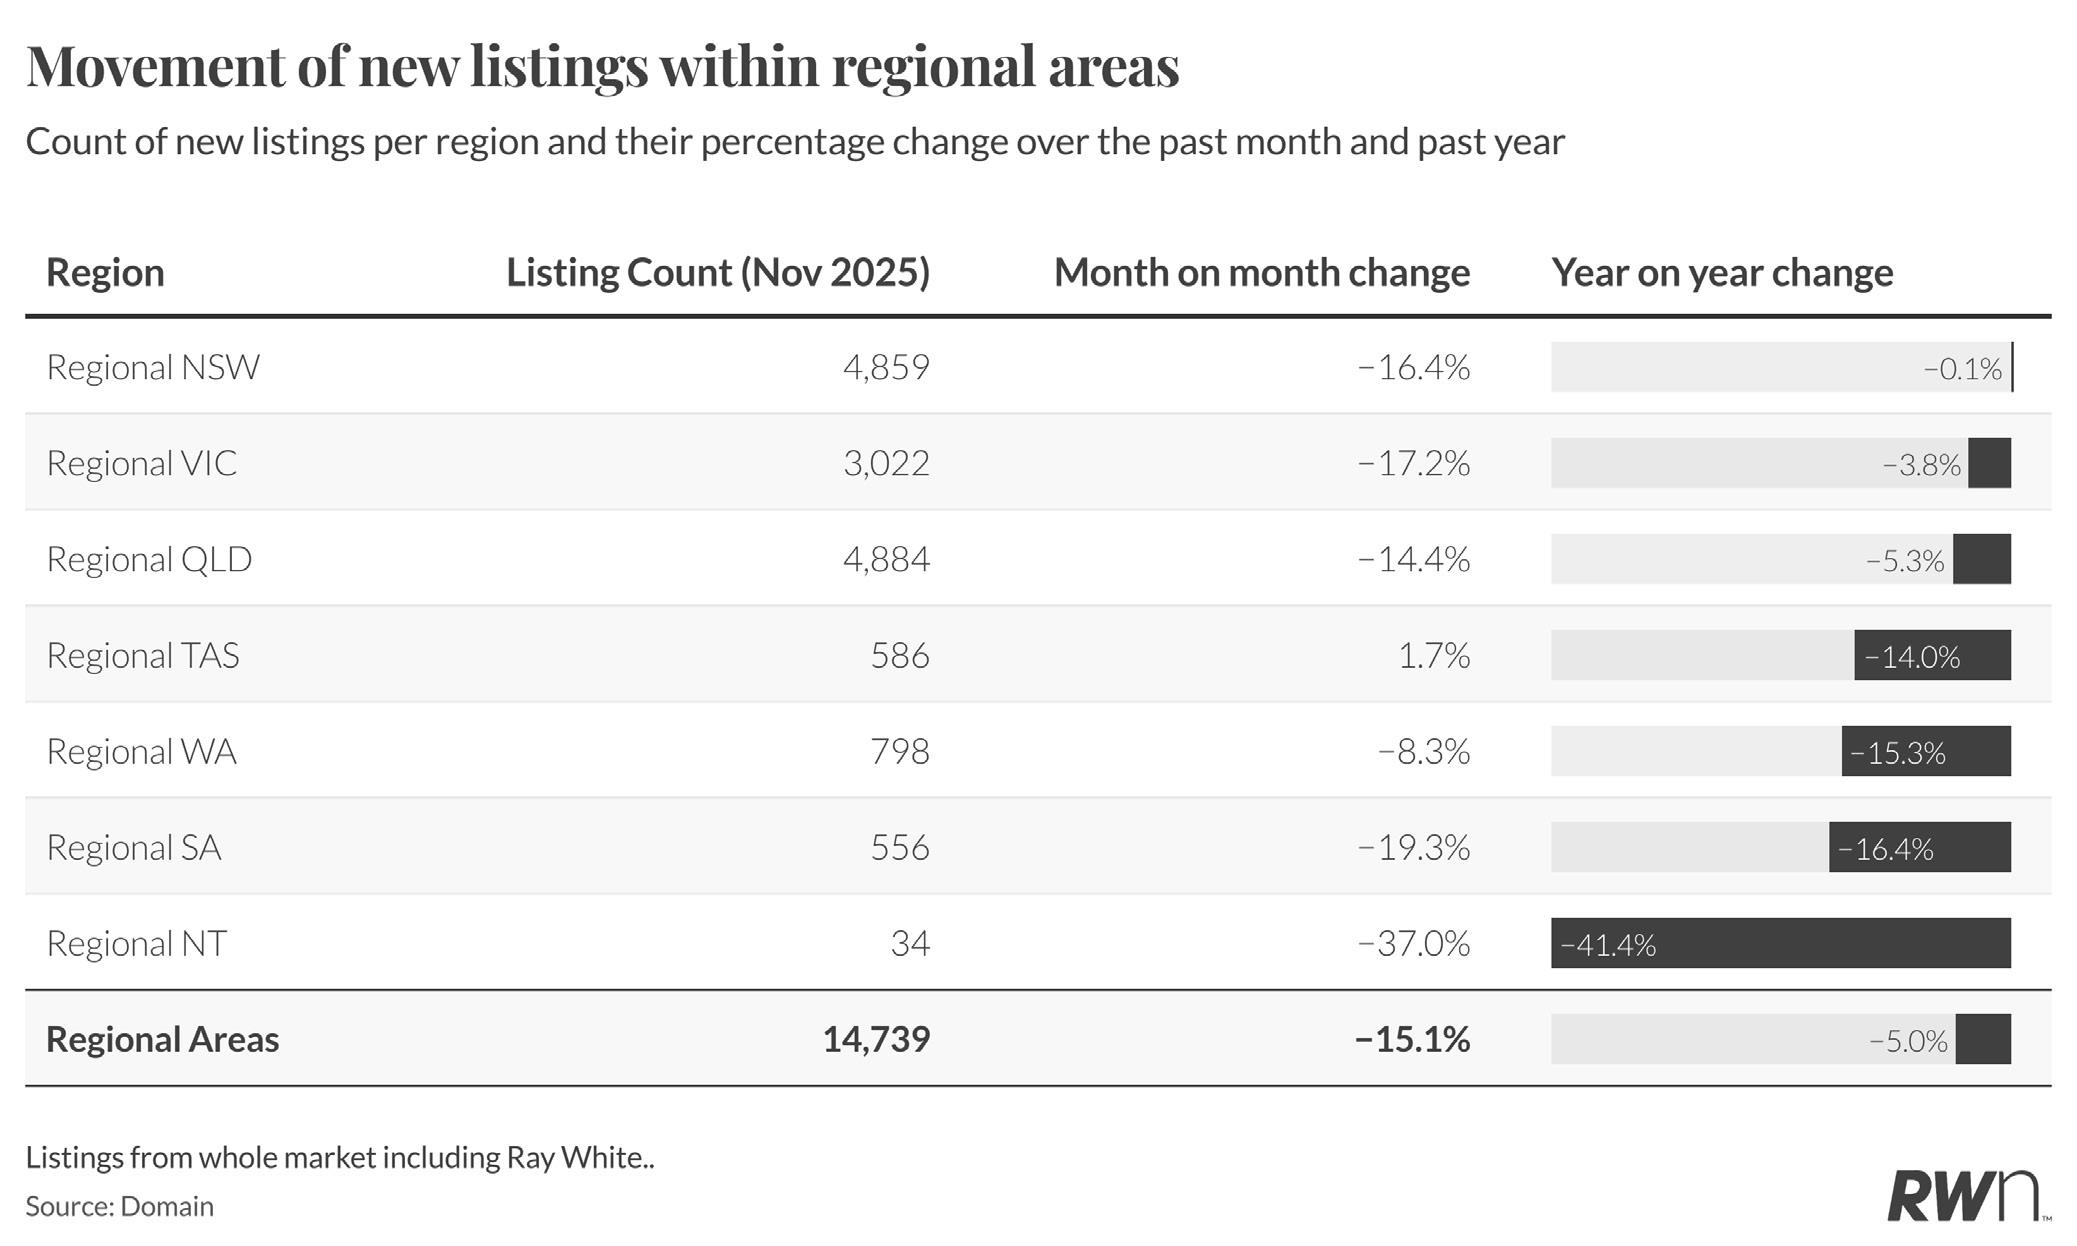
Regional listings fell 15.1 per cent monthly to 14,739 properties, whilst recording a 5.0 per cent annual decline that highlights ongoing supply constraints in these markets. Regional New South Wales led volumes with 4,859 listings despite a 16.4 per cent monthly decline, though annual listings remained virtually flat at negative 0.1 per cent. Regional Queensland recorded 4,884 listings, down 14.4 per cent monthly and 5.3 per cent annually.
Regional Victoria posted 3,022 listings, down 17.2 per cent monthly and 3.8 per cent annually, whilst regional Western Australia recorded 798 listings with an 8.3 per cent monthly decline and more substantial 15.3 per cent annual contraction. Regional South Australia managed 556 listings despite a severe 19.3 per cent monthly decline, with annual listings down 16.4 per cent reflecting the tight supply conditions that have driven strong price growth in this state. Regional Northern Territory experienced the most dramatic declines with just 34 listings, down 37.0 per cent monthly and 41.4 per cent annually, though these figures reflect the smaller scale of this market. Regional Tasmania recorded 586 listings, posting the only monthly increase of 1.7 per cent, though annual listings declined 14.0 per cent.

AUCTION INSIGHTS
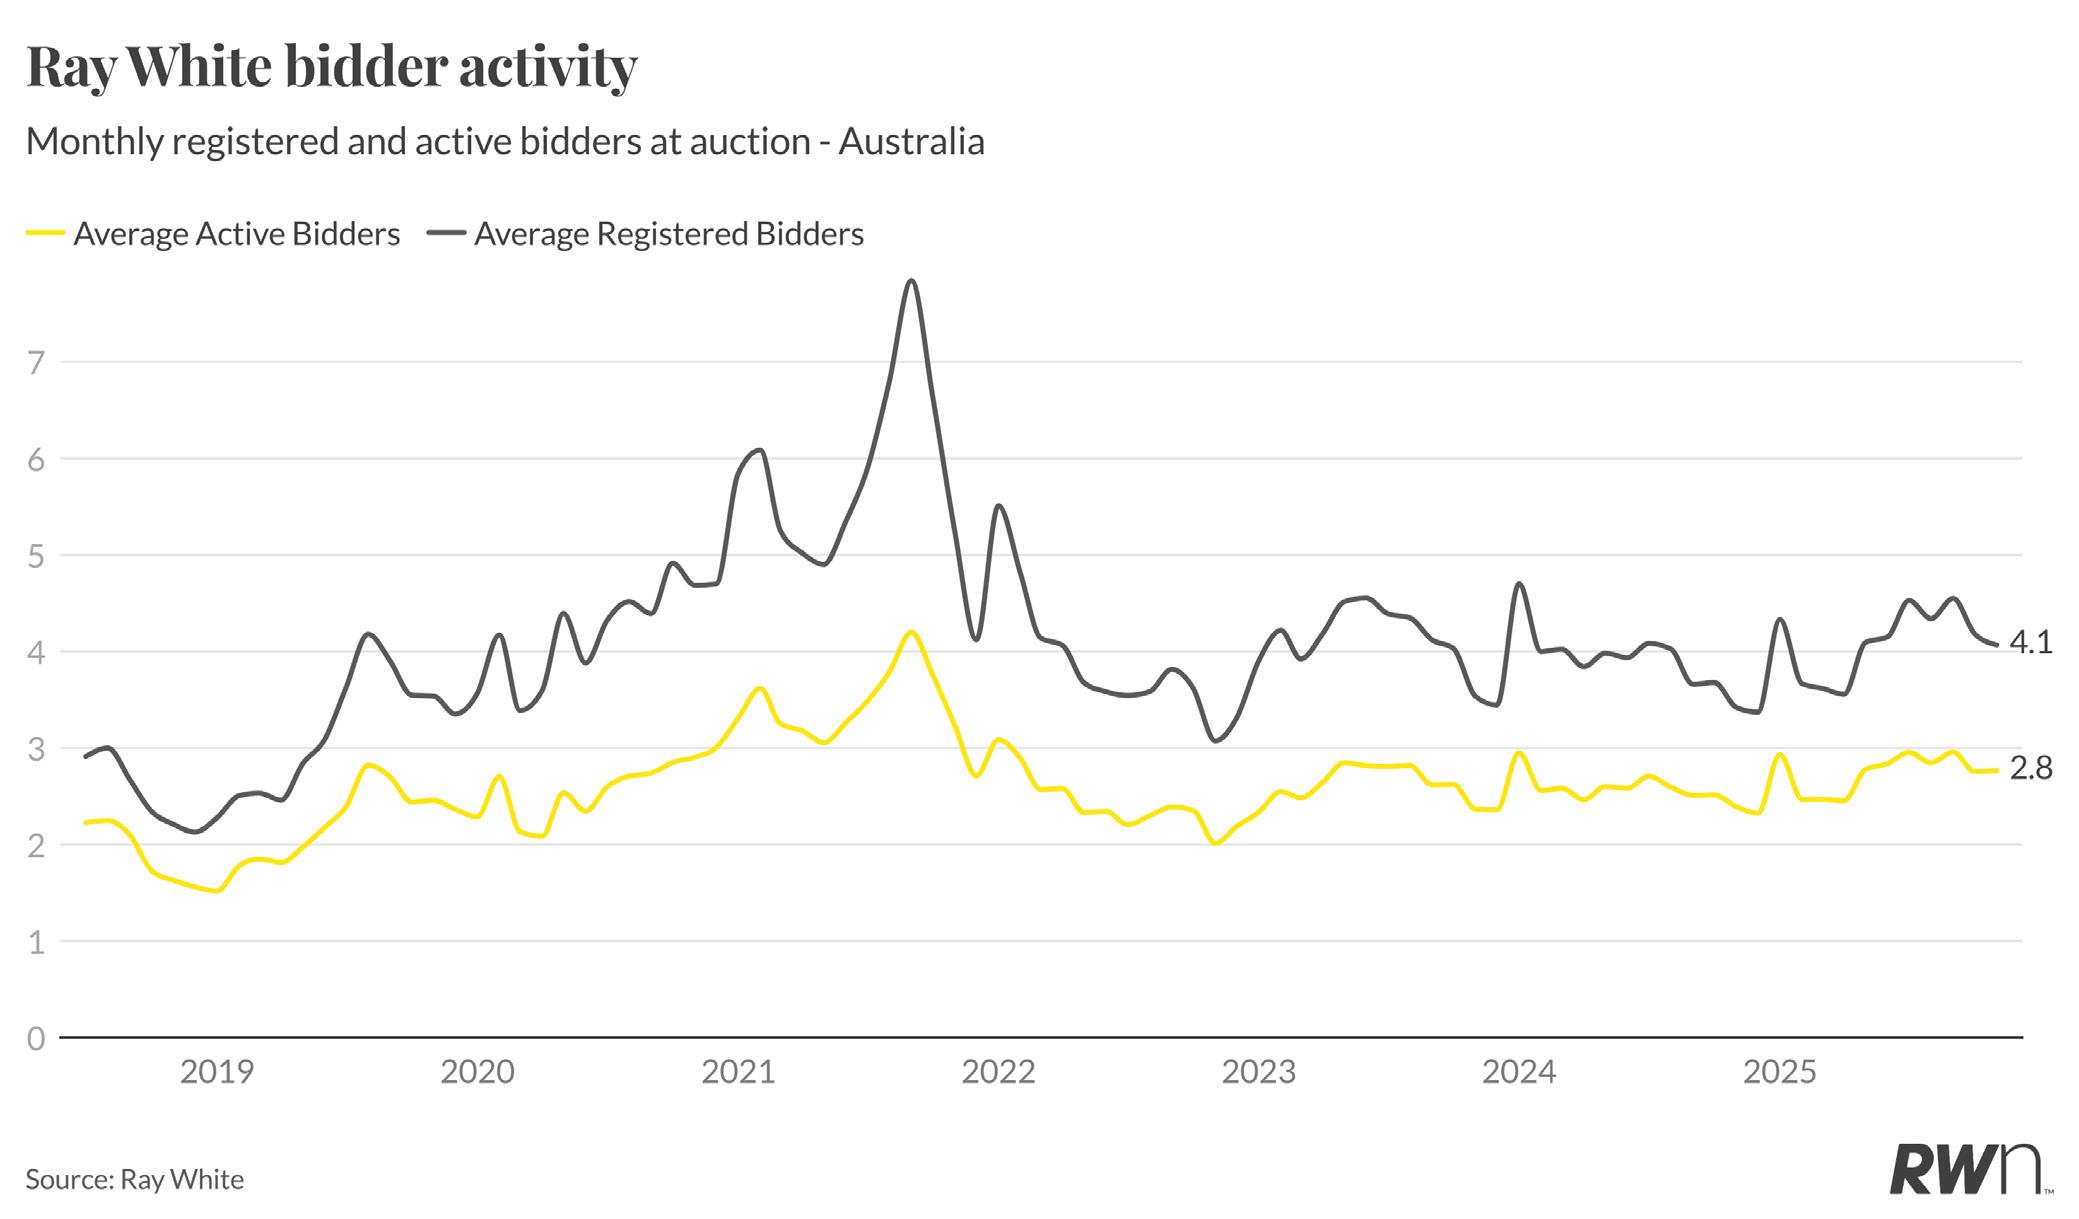
Average registered bidders at Ray White auctions held steady at 4.1 in November, representing a modest decline from October’s 4.2 but maintaining levels well above the depths observed through late 2023 and 2024. Active bidders averaged 2.8, remaining consistent with recent months and demonstrating sustained competitive engagement despite the approaching holiday season. The registration and bidding patterns through 2025 demonstrate relatively stable engagement compared to the volatility observed in prior years. Whilst both metrics have declined from the exceptional levels witnessed during the 2021 boom period when registered bidders exceeded 7.0 and active bidders approached 4.2, current figures reflect a more sustainable market dynamic. The maintenance of these levels heading into the traditional summer lull, combined with unchanged interest rates despite elevated inflation, suggests genuine buyer interest persists in supply-constrained markets. The ratio between registered and active bidders indicates approximately 68 per cent of registered parties are placing bids, demonstrating serious buyer intent rather than speculative attendance.

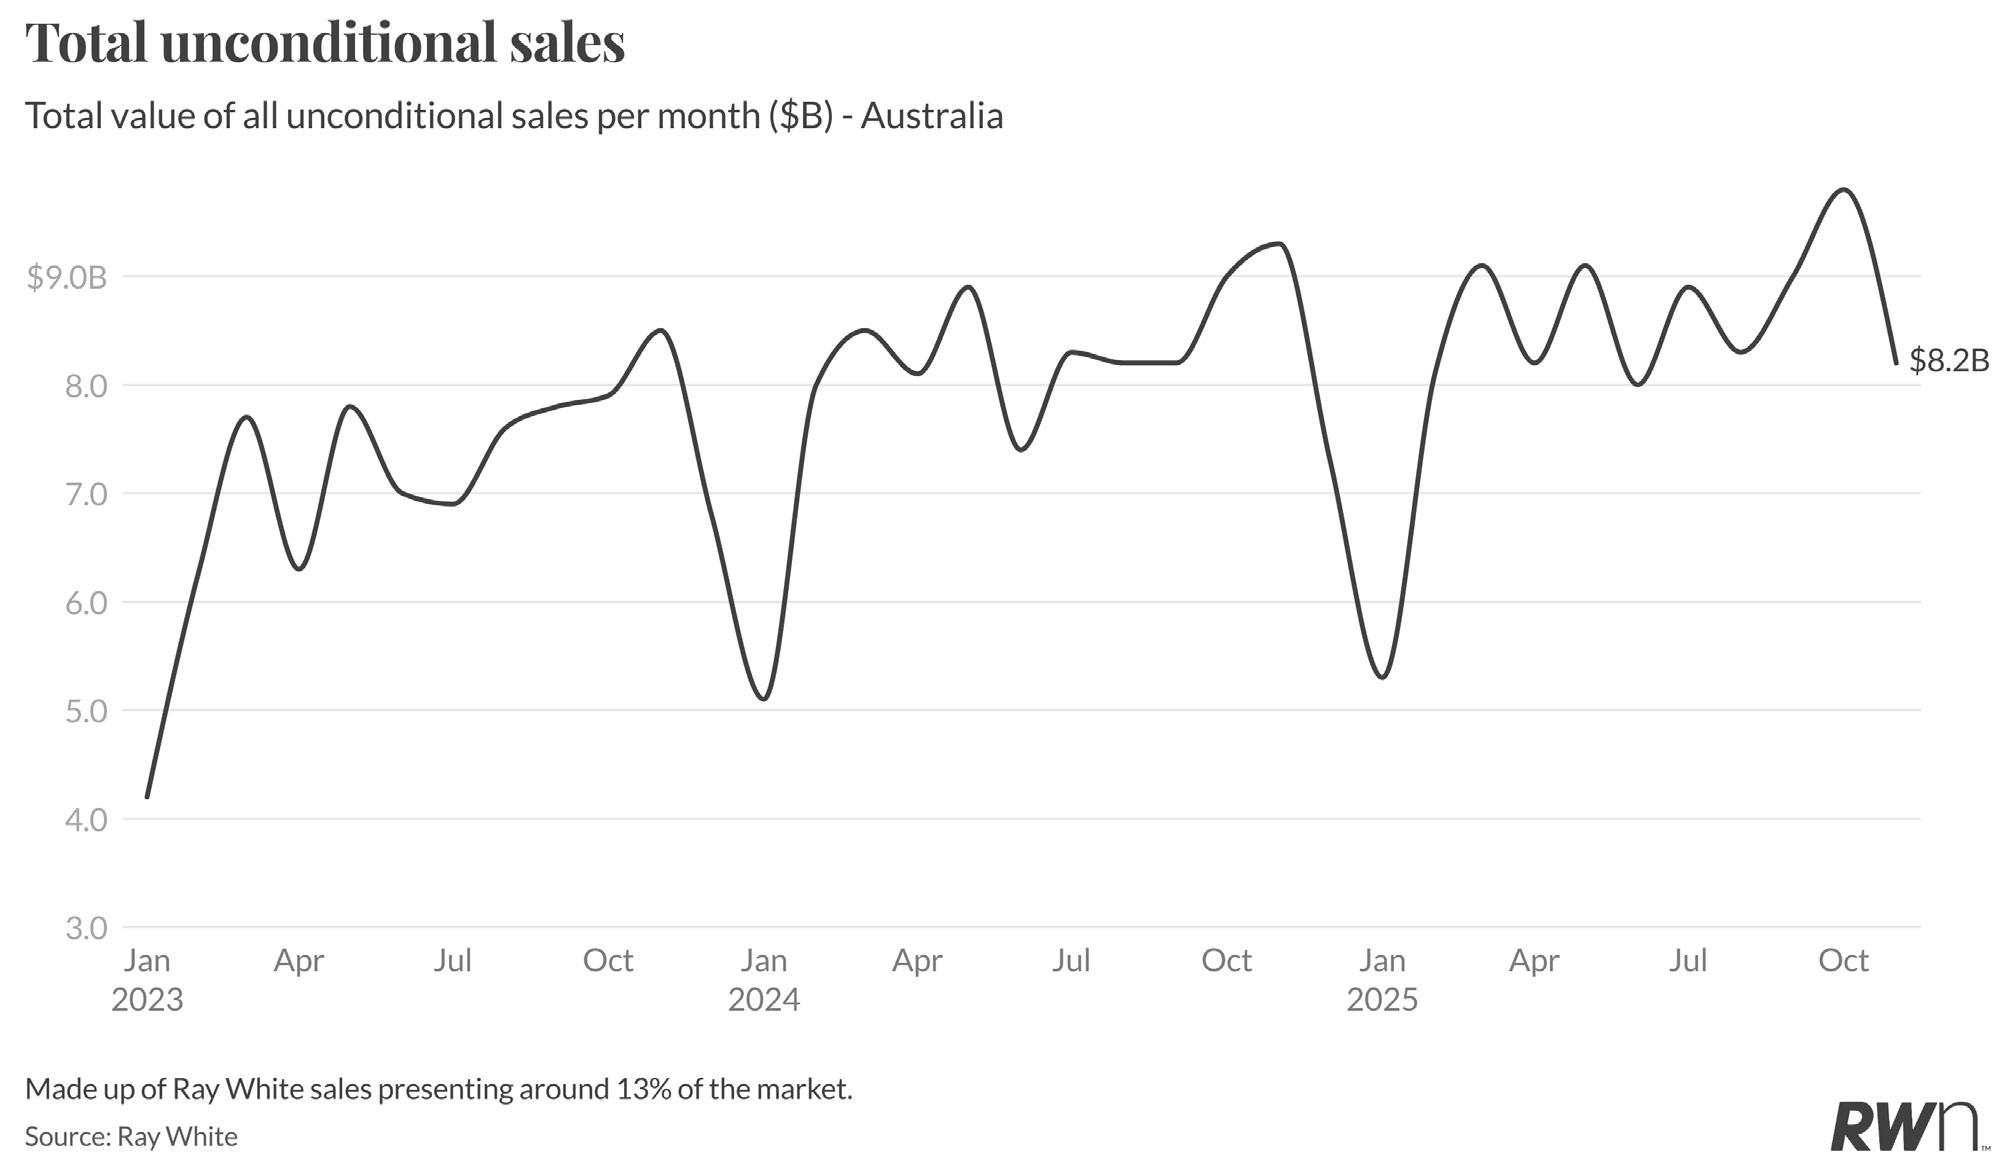
Ray White’s unconditional sales totalled $8.2 billion in November, representing a substantial decline from October’s $9.8 billion as the market enters its traditional year-end phase. This result reflects the seasonal pullback in transaction volumes typical of November, though it maintains reasonable strength compared to the broader holiday-affected period ahead.

The November figure aligns with typical seasonal patterns, with the year demonstrating consistent performance through the core selling months before the expected contraction toward year-end. The maintenance of $8.2 billion in sales value, despite the seasonal headwinds, indicates that underlying transaction quality remains solid, with completed sales reflecting genuine buyer commitment despite the approaching holiday period. With December expected to see further moderation as both buyers and vendors disengage ahead of the summer break, the current result positions the market for the anticipated rebound in late January and February when activity traditionally resumes following the holiday slowdown.
Ray White’s unconditional sales totalled $8.2 billion in November, representing a substantial decline from October’s $9.8 billion as the market enters its traditional year-end phase. This result reflects the seasonal pullback in transaction volumes typical of November, though it maintains reasonable strength compared to the broader holiday-affected period ahead.
The November figure aligns with typical seasonal patterns, with the year demonstrating consistent performance through the core selling months before the expected

contraction toward year-end. The maintenance of $8.2 billion in sales value, despite the seasonal headwinds, indicates that underlying transaction quality remains solid, with completed sales reflecting genuine buyer commitment despite the approaching holiday period. With December expected to see further moderation as both buyers and vendors disengage ahead of the summer break, the current result positions the market for the anticipated rebound in late January and February when activity traditionally resumes following the holiday slowdown.
Ray White listing authorities declined to 6,592 in November, down from October’s 9,770 and representing the expected seasonal contraction as vendors increasingly defer listing decisions until after the holiday period. This 32.5 per cent monthly decline reflects typical year-end market dynamics, though the November figure remains well below the elevated levels observed through spring when authorities peaked at 9,770 in October.
The 2025 trajectory showed listing authorities building steadily through the year from January’s 7,686 to the October peak, before the sharp November decline that traditionally marks the beginning of the summer slowdown. Compared to November 2024’s 7,934 authorities, the current result is down 16.9 per cent, though this comparison is complicated by the timing of the spring peak across different years. December will likely see further substantial declines as the holiday period takes hold, with authorities expected to remain subdued through the summer months before recovering in late January and February when vendor confidence typically returns alongside stronger buyer activity.