Qatar Real Estate Market Report - May 2023

Page 1

The Real Estate Bulletin 5th Issue of May 2023

List of the Monthly Bulletin of the Properties Sold for May 2023

The Volume of the Real Estate Trading during May 2023

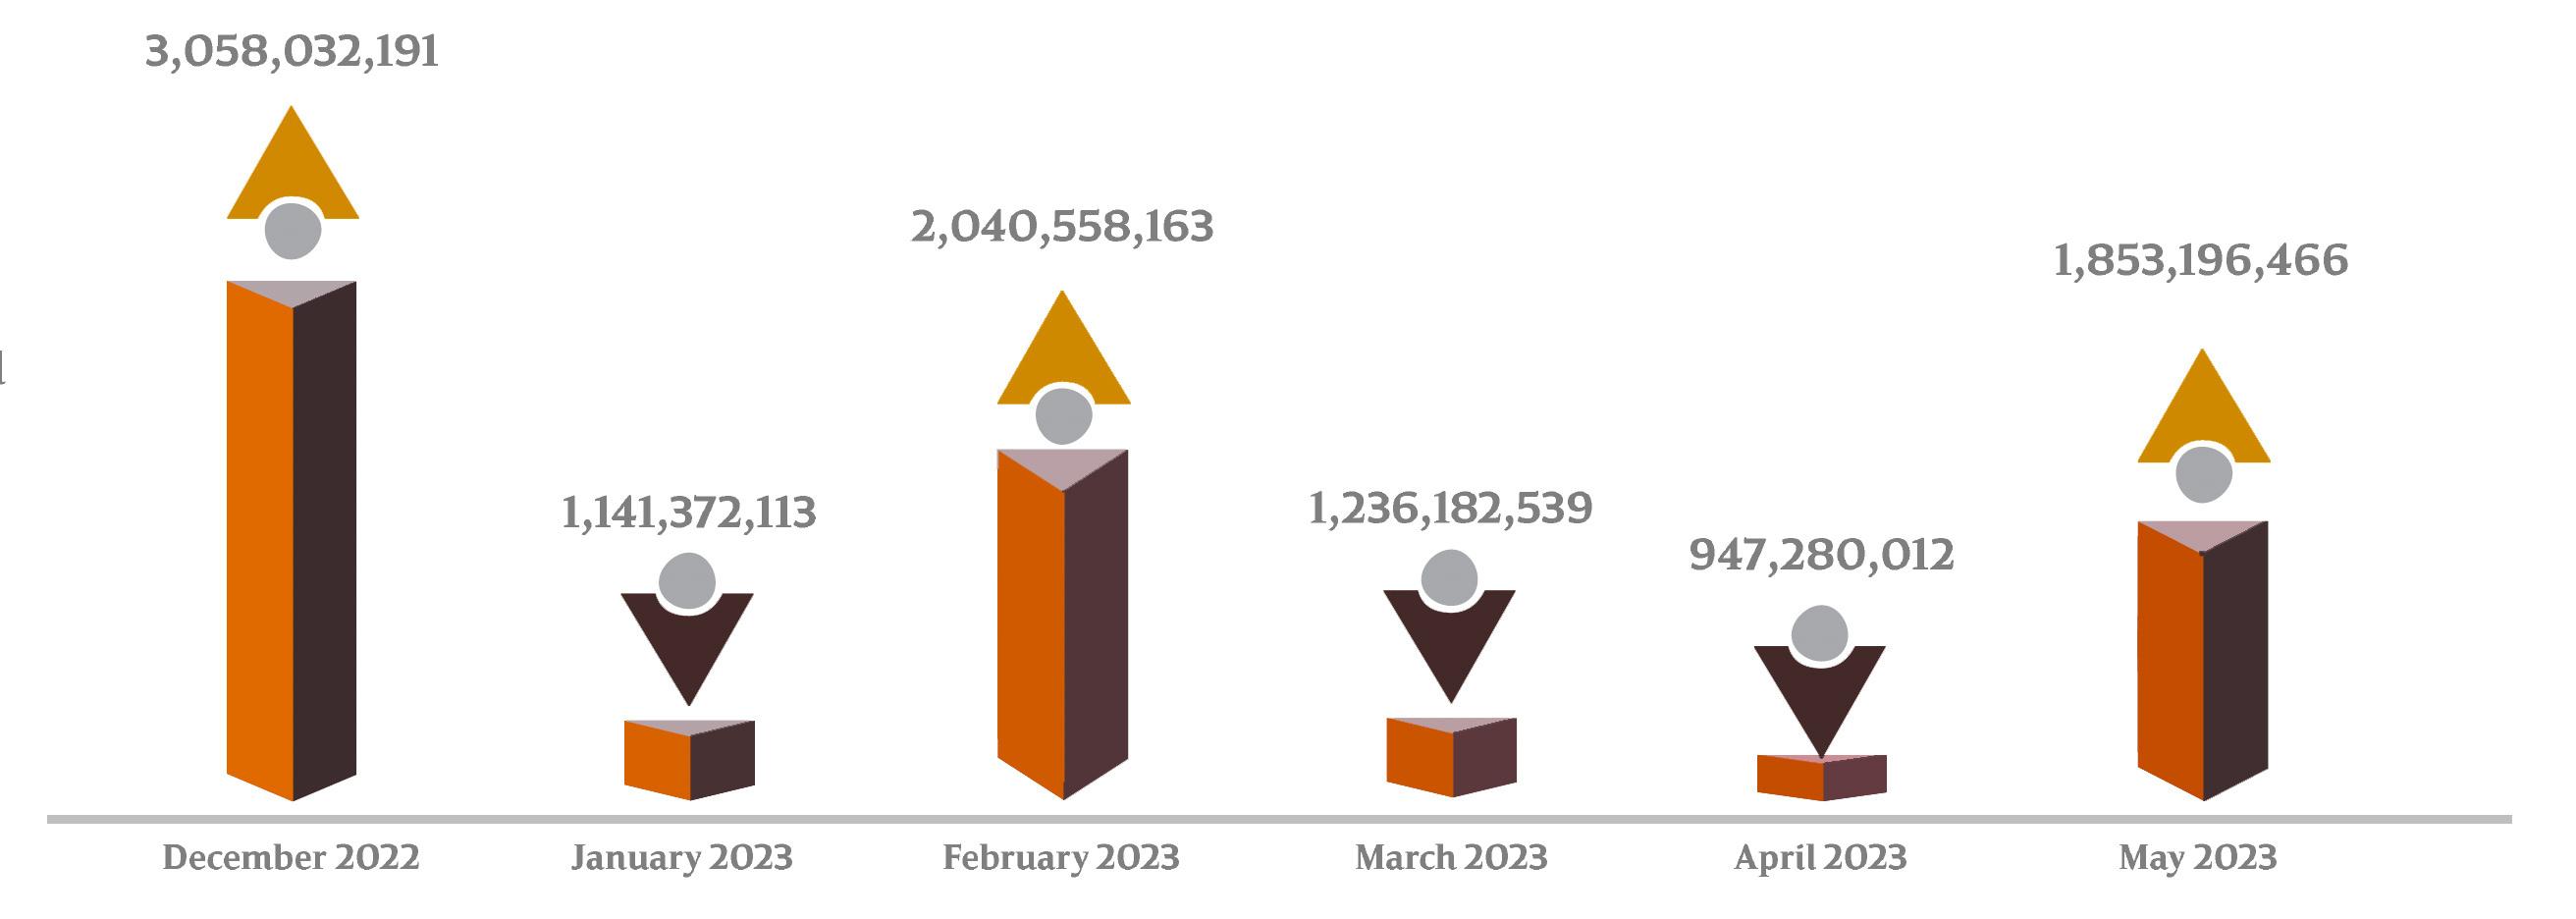
The real estate transactions index reached 1,853,196,466 QR for 337 transactions. In April 2023 the real estate index increased by 115% While the traded areas index increased by 183%

The Real Estate Bulletin I May 2023/ Ministry of Justice

Real Estate Trading Volume During May 2023

The Deals Financial Value Index for May 2023

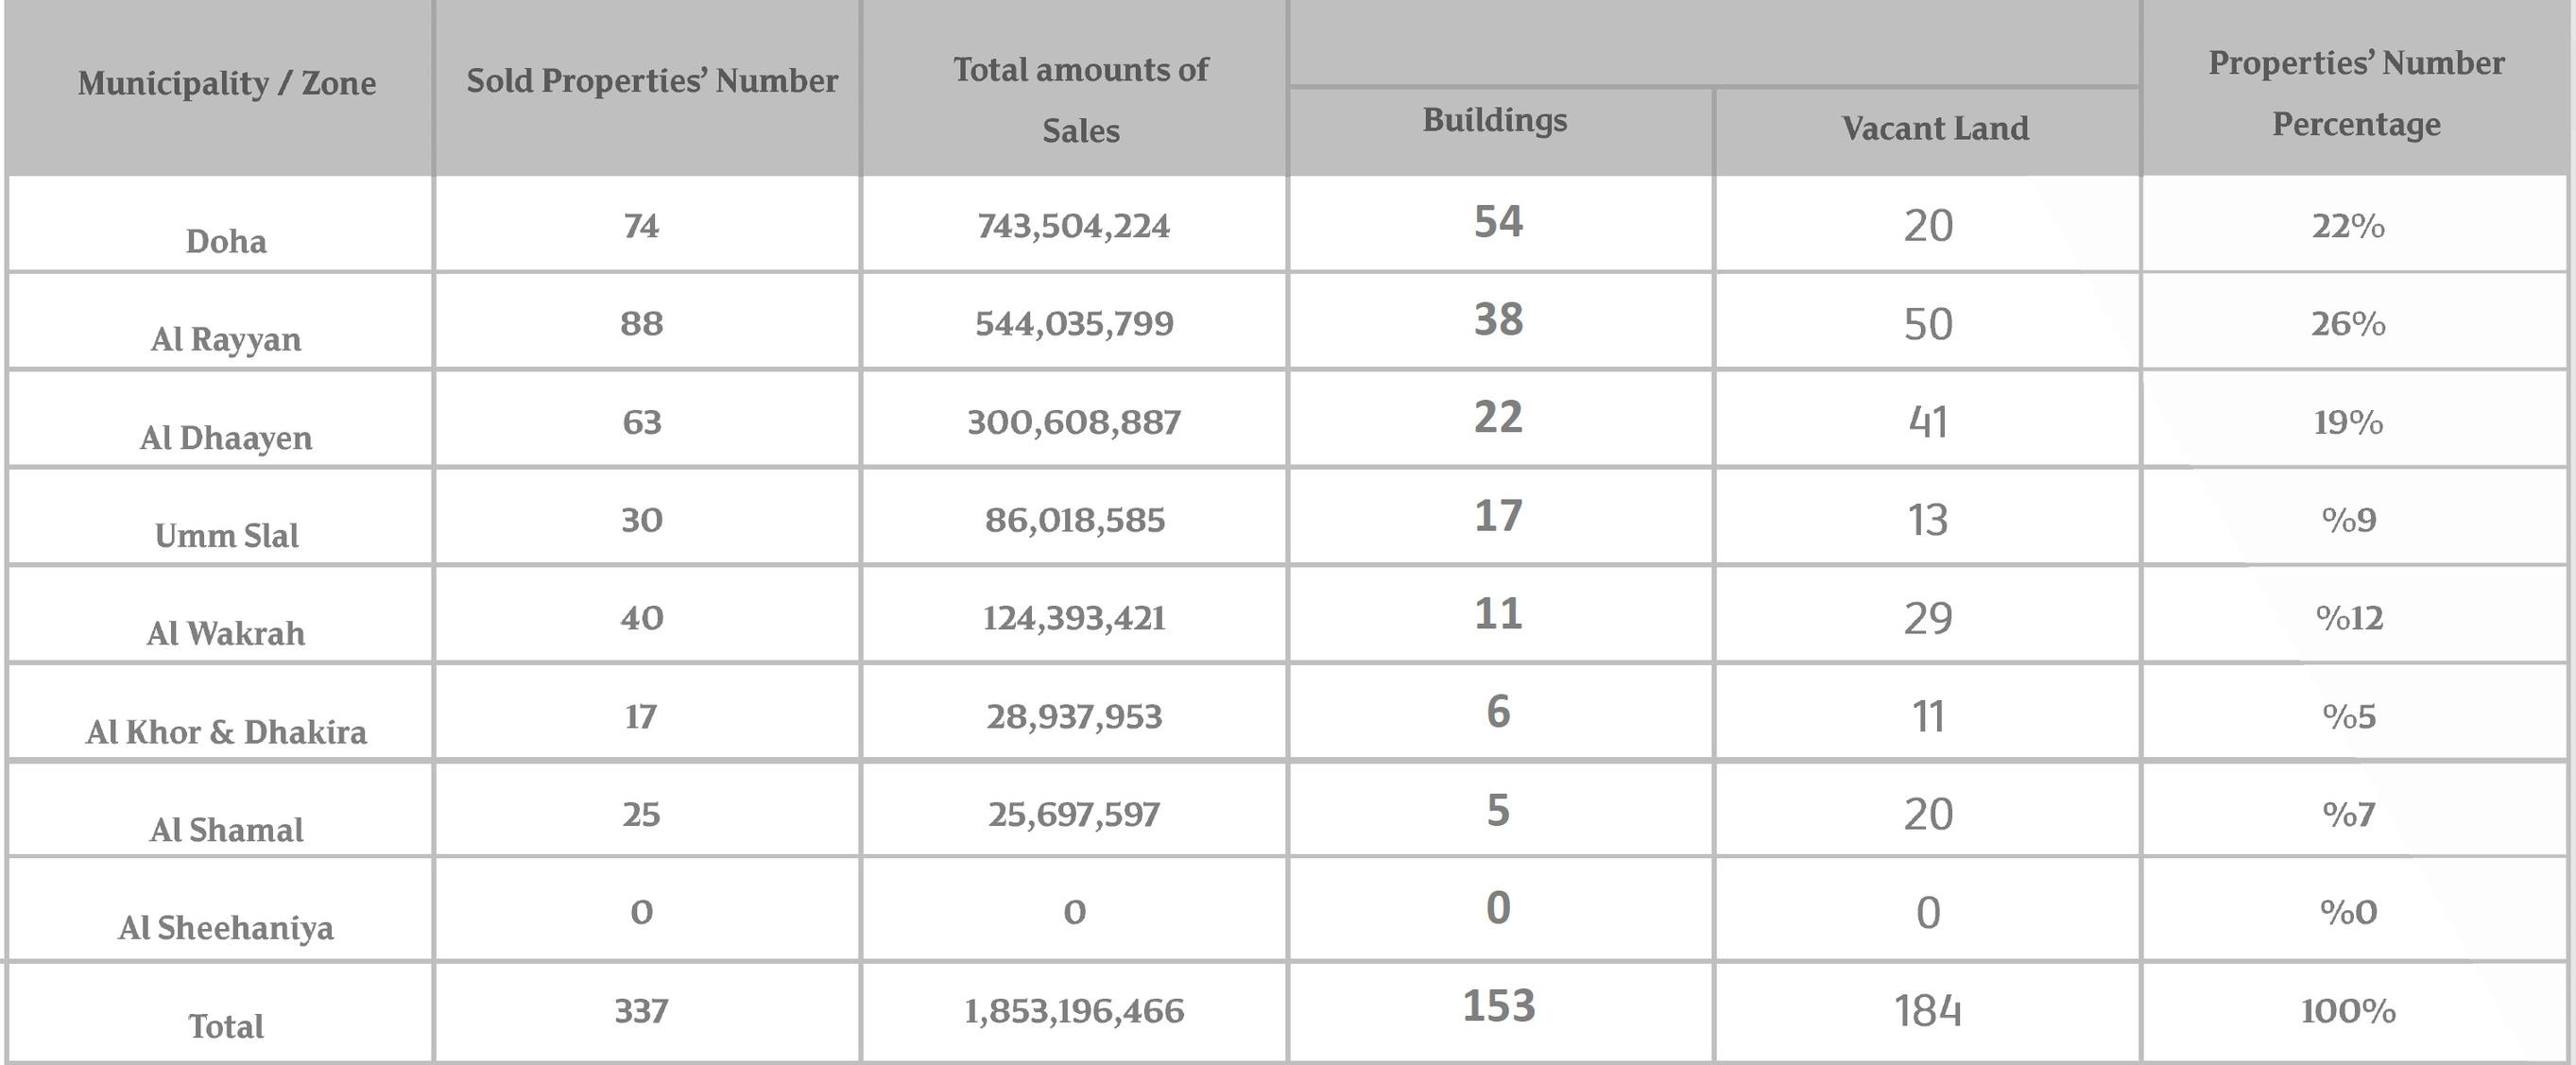
Doha Municipality, Al Rayyan Municipality and then Al Daayen Municipality are the most active in terms of financial value, with Doha Municipality dealings reaching (743,504,224) QR, Al Rayyan Municipality ranking second with (544,035,799) QR, and Al Daayen Municipality ranking third with (300,608,887) QR

Doha
Difference in Performance Change Of the Real
The Real Estate Bulletin I May 2023/ Ministry of Justice
Estate Market
Al Rayyan Al
743,504,224 544,035,799 300,608,887 124,393,421 28,937,953 Al Daayen Al Khor & Dhakira 86,018,585 Al Shamal 25,697,597
The Real Estate Bulletin I May 2023/ Ministry of Justice
Wakrah Umm Slal

Number of Traded Properties as per Municipalities

TradedSpaces

Percentage of Traded Spaces as per Municipalities

Al Rayyan Municipality 36% of the trading movement, followed by Al Daayen Municipality (21%) and Doha Municipality with 20% of total transactions

Doha Municipality QR 743 504 224 Al Daayen Municipality QR 300,608,887 Al-Khor & Dhekra Municipality QR 28 937 953 Al Shamal Municipality QR 25,697,597 Umm Slal Municipality Al Sheehaniya Municipality QR 86,018,585, QR 0 Al Rayyan Municipality QR 5544,035,799 Al Wakrah Municipality QR 124,393,421
25 30 0 88 40 74 63 17 AlRayyan 36% AlDhaayen 21% Doha 20% AlWakrah 9% UmmSlal 7% AlShamal 4%
The Real Estate Bulletin I May 2023/ Ministry of Justice The Real Estate Bulletin I May 2023/ Ministry of Justice Al Khor & Dhakira 3%

Al Rayyan Municipality sold the most real estate (26%), followed by Doha (22%) and Al Dhaayen Municipality by (19%)

Mortgage Trading Movement during May 2023

Doha Municipality recorded the highest number of mortgage transactions with (59) transactions, equivalent to (46.1%) of the total number of mortgaged real estate, followed by Al Rayyan Municipality, with (38) transactions, equivalent to (29 7%) of the total number of mortgaged real estate.

AlRayyan 26% Doha 22% AlDhaayen 19% AlWakrah 12% UmmSlal 9% Al-Shamal 7% AlKhorandAlDakhira 5%
The Real Estate Bulletin I May 2023/ Ministry of Justice TransactionsNumberIndicator The Real Estate Bulletin I May 2023/ Ministry of Justice Doha 461% AlRayyan 297% AlDhaayen 133% UmmSlal 39% AlWakra 23% AlShamal 08%
Percentage of Number of Deals Traded as per Municipalities
Al Khor & Dhekra 3 9%

Al Shamal Municipality has not registered any building sale transaction Al Sheehaniya Municipality has not registered any building sale transaction.

Al Sheehaniya and Al Shamal Municipality has not registered any sale transaction

AverageperSquareFootPricesforMay2023andApril2023 The Real Estate Bulletin I May 2023/ Ministry of Justice Doha Al Wakrah Umm Slal Al Dhaayen Al-Shamal Al Khor and Dakhira 896 Al Rayyan 472 533 262 460 314 437 298 585 135 217 Doha Al Wakrah Umm Slal Al Dhaayen Al-Shamal Al Khor and Dakhira 274 Al Rayyan 487 331 403 311 473 327 171 716 700 217 May 2023
2023
April
Buildings Vacant Land Buildings Vacant Land 240 324 Al sheehaniya 202 212 310 267 151 267 864 335 252 297 142

Top Ten Properties

List of the top (10) real estate in May 2023, including seven (7) in Doha Municipality and (2) properties in Al Daayen and (1) in Al Rayyan Municipality

Jeryan Jenaihat The Pearl Al Mansoura 27,500,000 33,000,000 34,350,000 38,136,079 51,736,034 46,500,000 54,092,975 150,000,000 185,872,752 Al Daayen Doha Doha Doha Doha Doha Al Rayyan Doha 46,000,000 Al Daayen
The Ten Most Expensive Properties for April 2023 The Real Estate Bulletin I May 2023/ Ministry of Justice
Umm Ghuwailina Doha Al Sakhama The Pearl Al Mansoura Al Mansoura New Al Rayyan Al Qassar

Mortgage Trading Movement during May 2023

Doha Municipality had the most mortgages (4,807,082,354) QR, while Al Shamal had the least (1,650,000) QR

A study of the mortgage transaction movement index reveals that the percentage of mortgaged real estate is higher than the percentage of mortgage transaction amounts in all municipalities that recorded mortgage transactions, except for Doha and Al Daayen Municipality.

Percentage of the Number and Amounts of mortgage transactions as per Municipalities

4,807,082,354 3,579,877,000 376,435,964 23,683,000 Al Khor & Dhekra 15,433,377 2,822,306 Al Rayyan Doha
Real Estate
Justice
The
Bulletin I May 2023/ Ministry of
0 20 40 60 Alshamal AlKhor&Dhekra UmmSlal AlWakrah AlDaayen AlRayyan Doha 0 3% 2 3% 59 6% 0 1% 4 3% 40 6% 13 3% 54 6% The Real Estate Bulletin
May 2023/ Ministry of Justice
I
The Mortgage Amounts Percentage The Properties Number Percentage Al Daayen Umm Slal 0 8% 3 9% Al Wakrah 0 2% 1,650,000 Al Shamal 3 9% 29 7% 46 1%

18%

Total of the top 10 mortgage Transactions

Total of Remaining Mortgage Transactions

82%

The total percentage of the Top Mortgage Transactions

The Real Estate Bulletin I May 2023/ Ministry of Justice

Doha Municipality recorded 8 of the top 10 mortgaged properties in May 2023 The top ten real estate mortgage deals accounted for 82% of May's total value

Real Estate Trading Movement - The Pearl and Al Kassar Area

Comparison of Residential Units Trading Indicators

The Real Estate Bulletin I May 2023/ Ministry of Justice

May 2023 had an increase in The Pearl and Al Kassar Area than April 2023 67 residential unit transactions totaled 145,097,703 QR

MortgageTradingMovementduringMay2023
Email: contacts@thepearlgastes.com
Issuu converts static files into: digital portfolios, online yearbooks, online catalogs, digital photo albums and more. Sign up and create your flipbook.