


The Real Estate Bulletin 3rd Issue of March 2023
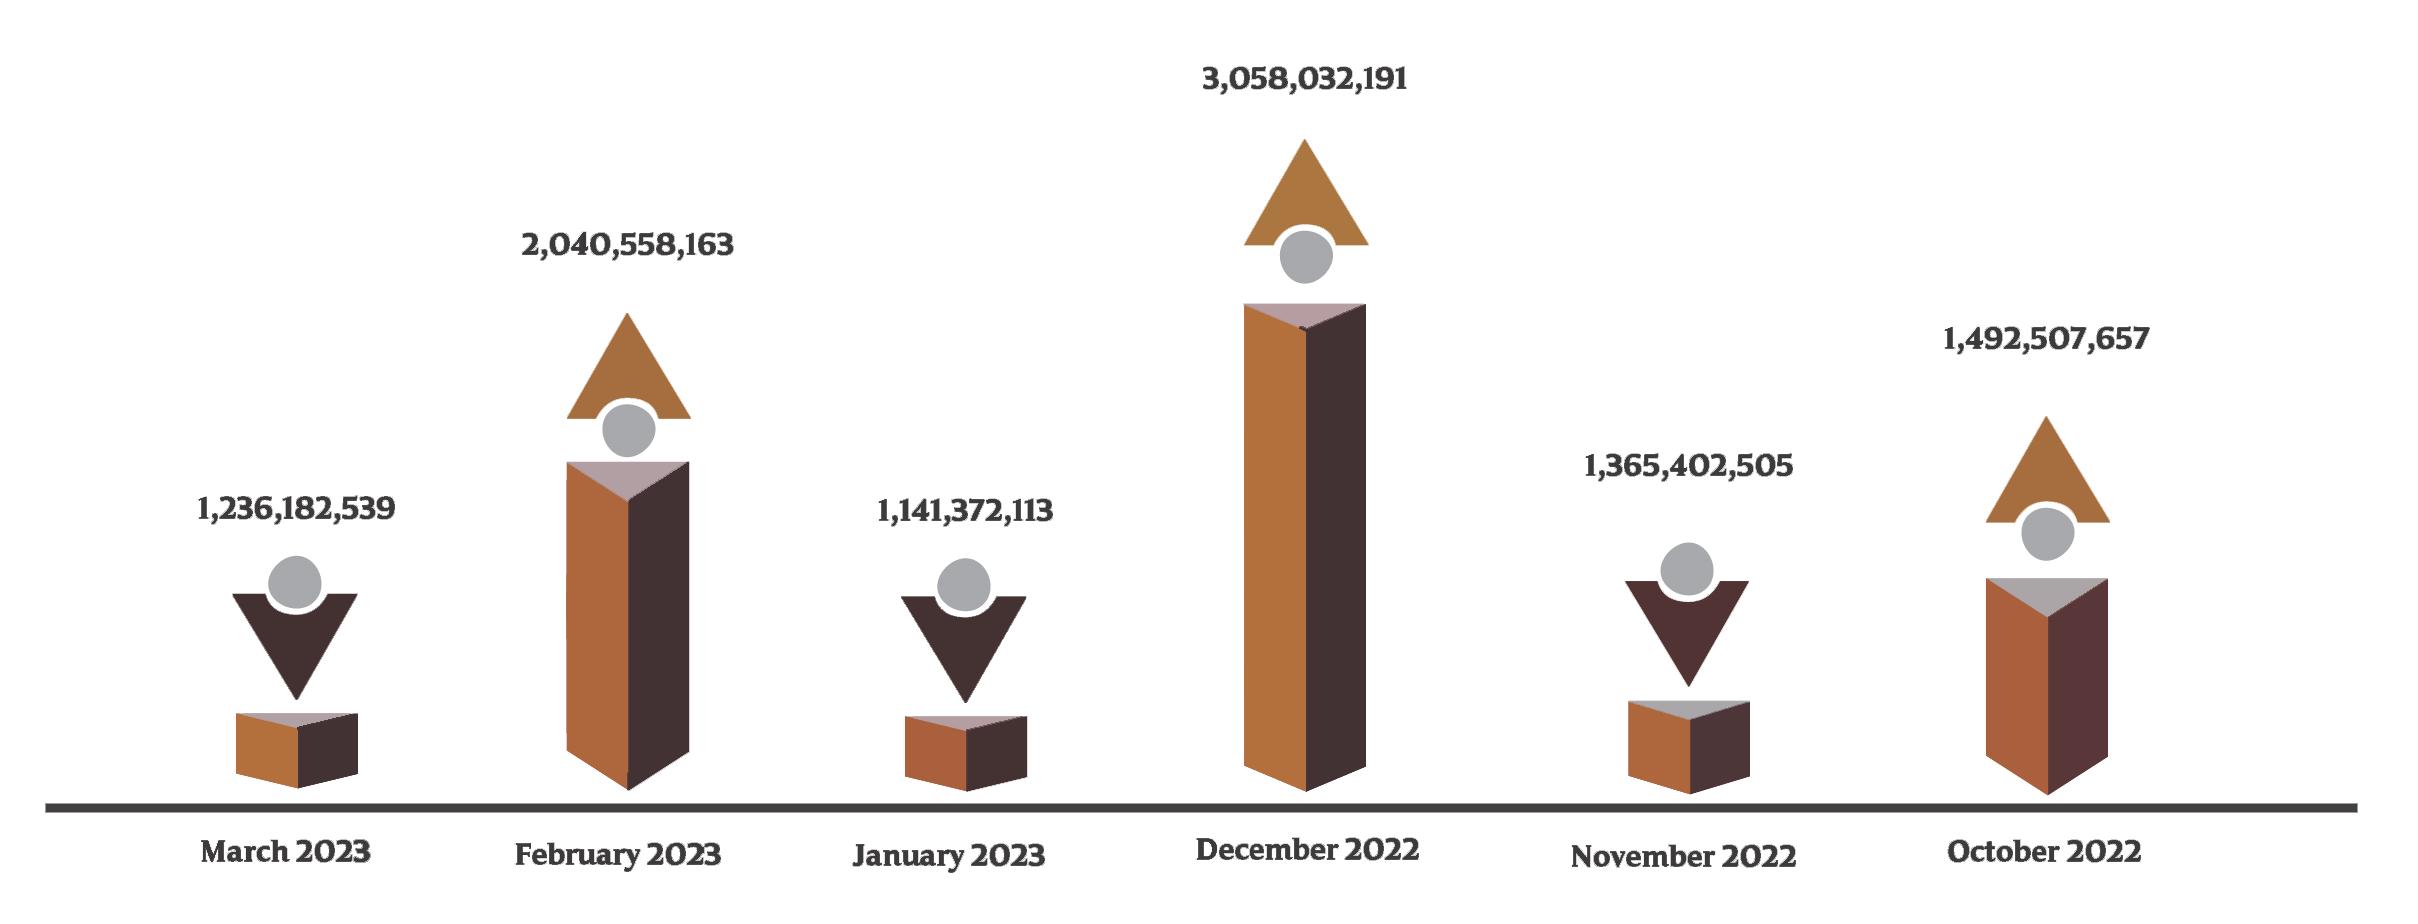
The Volume of the Real Estate Trading during March 2023

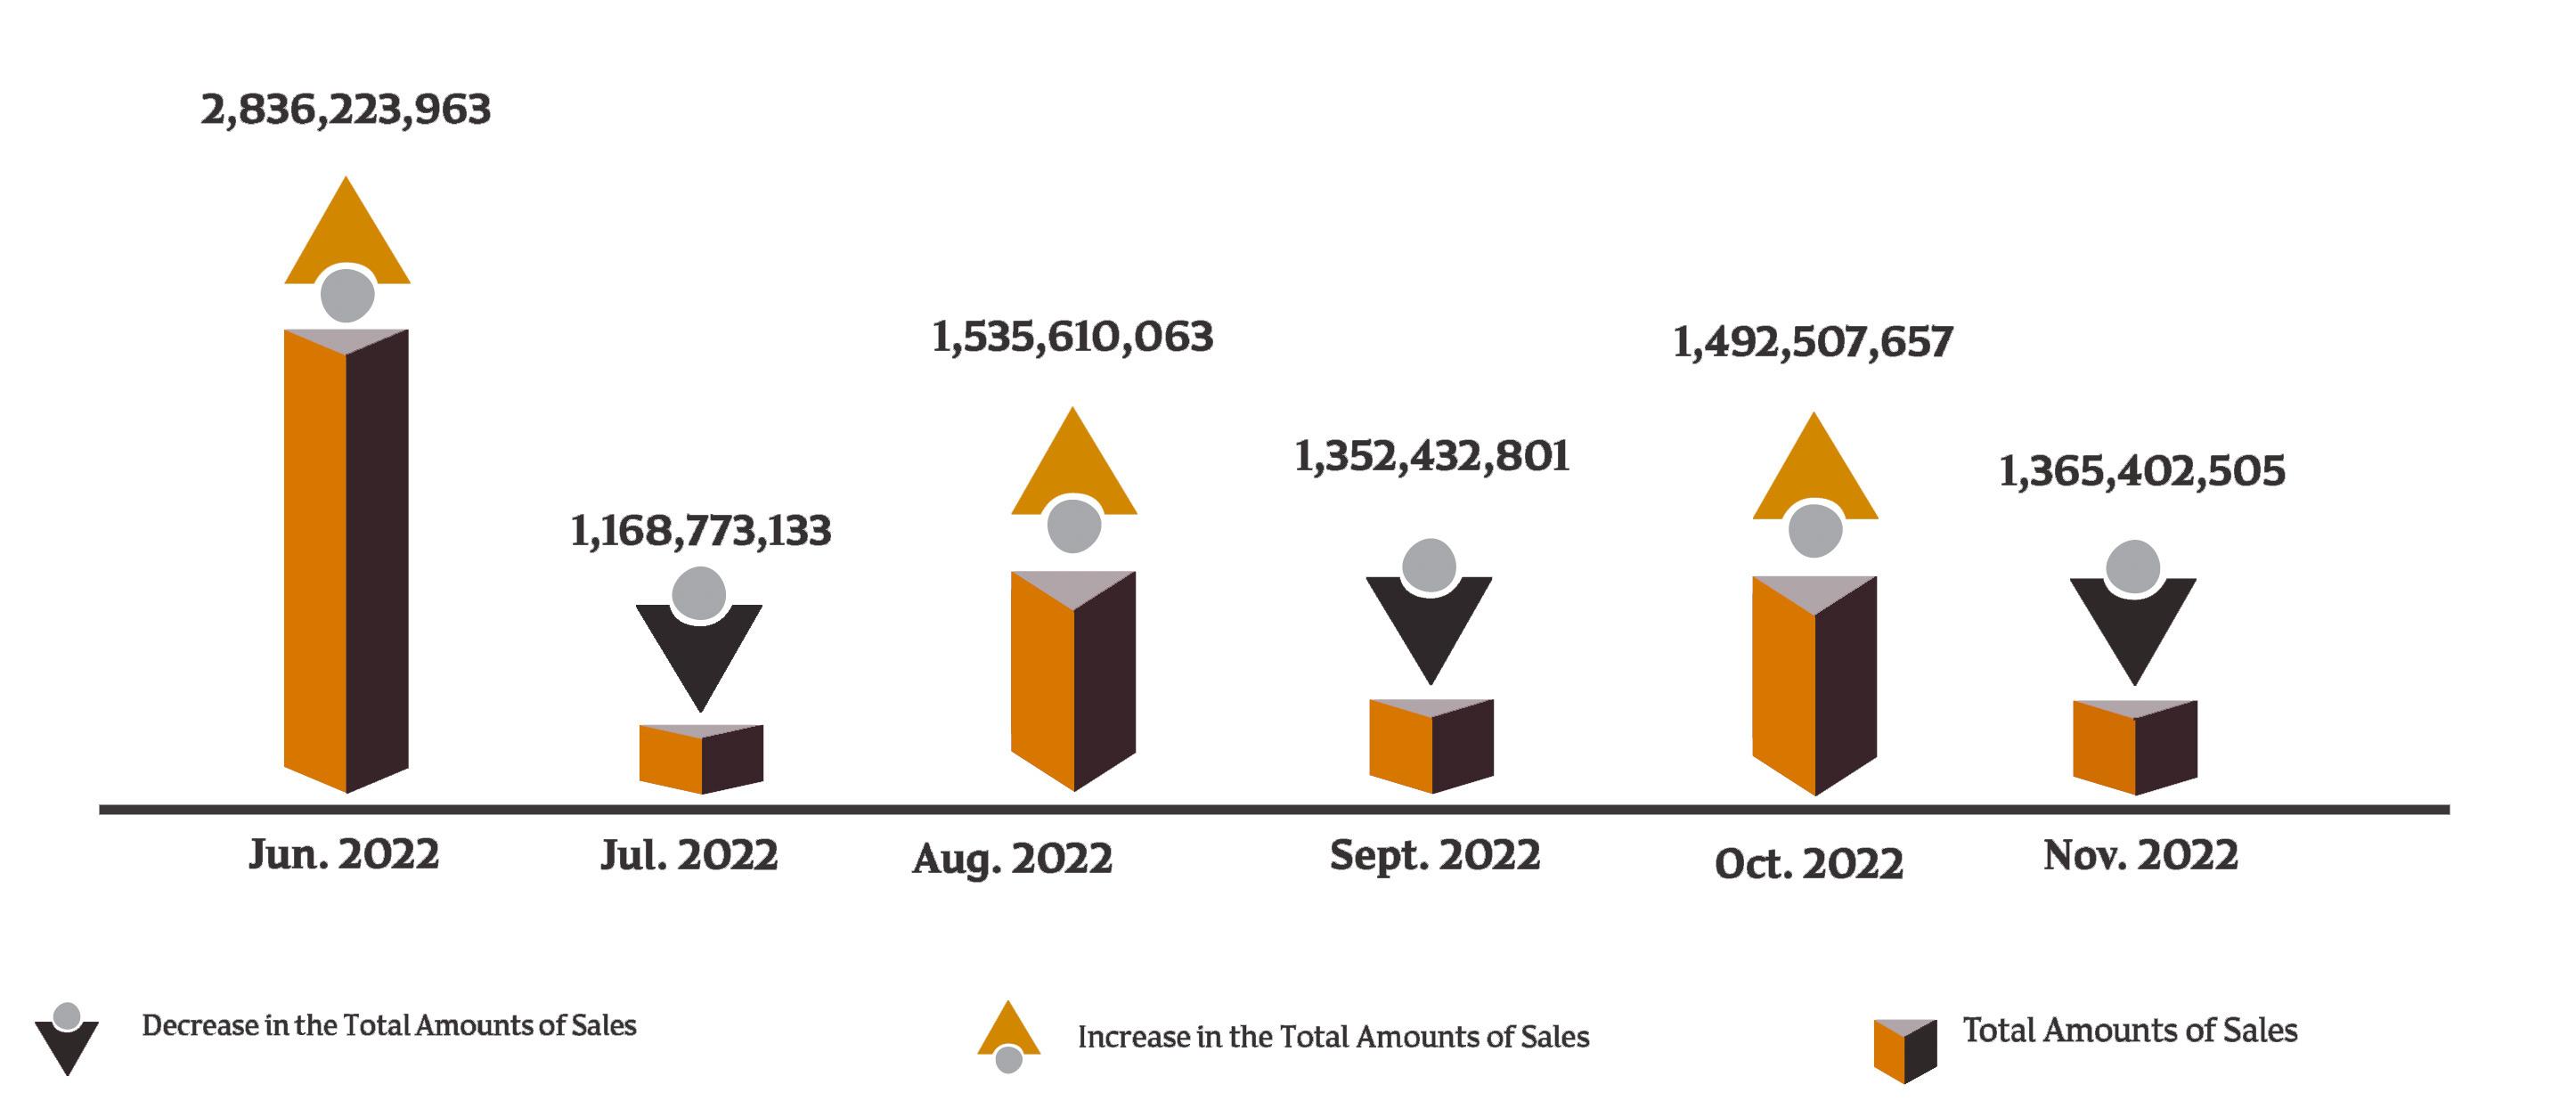
The real estate transactions index reached 1,236,182,539 QR for 340 transactions. In February 2023 the real estate index decreased by 11% While the traded areas index decreased by -26%
The Real Estate Bulletin I March 2023/ Ministry of Justice
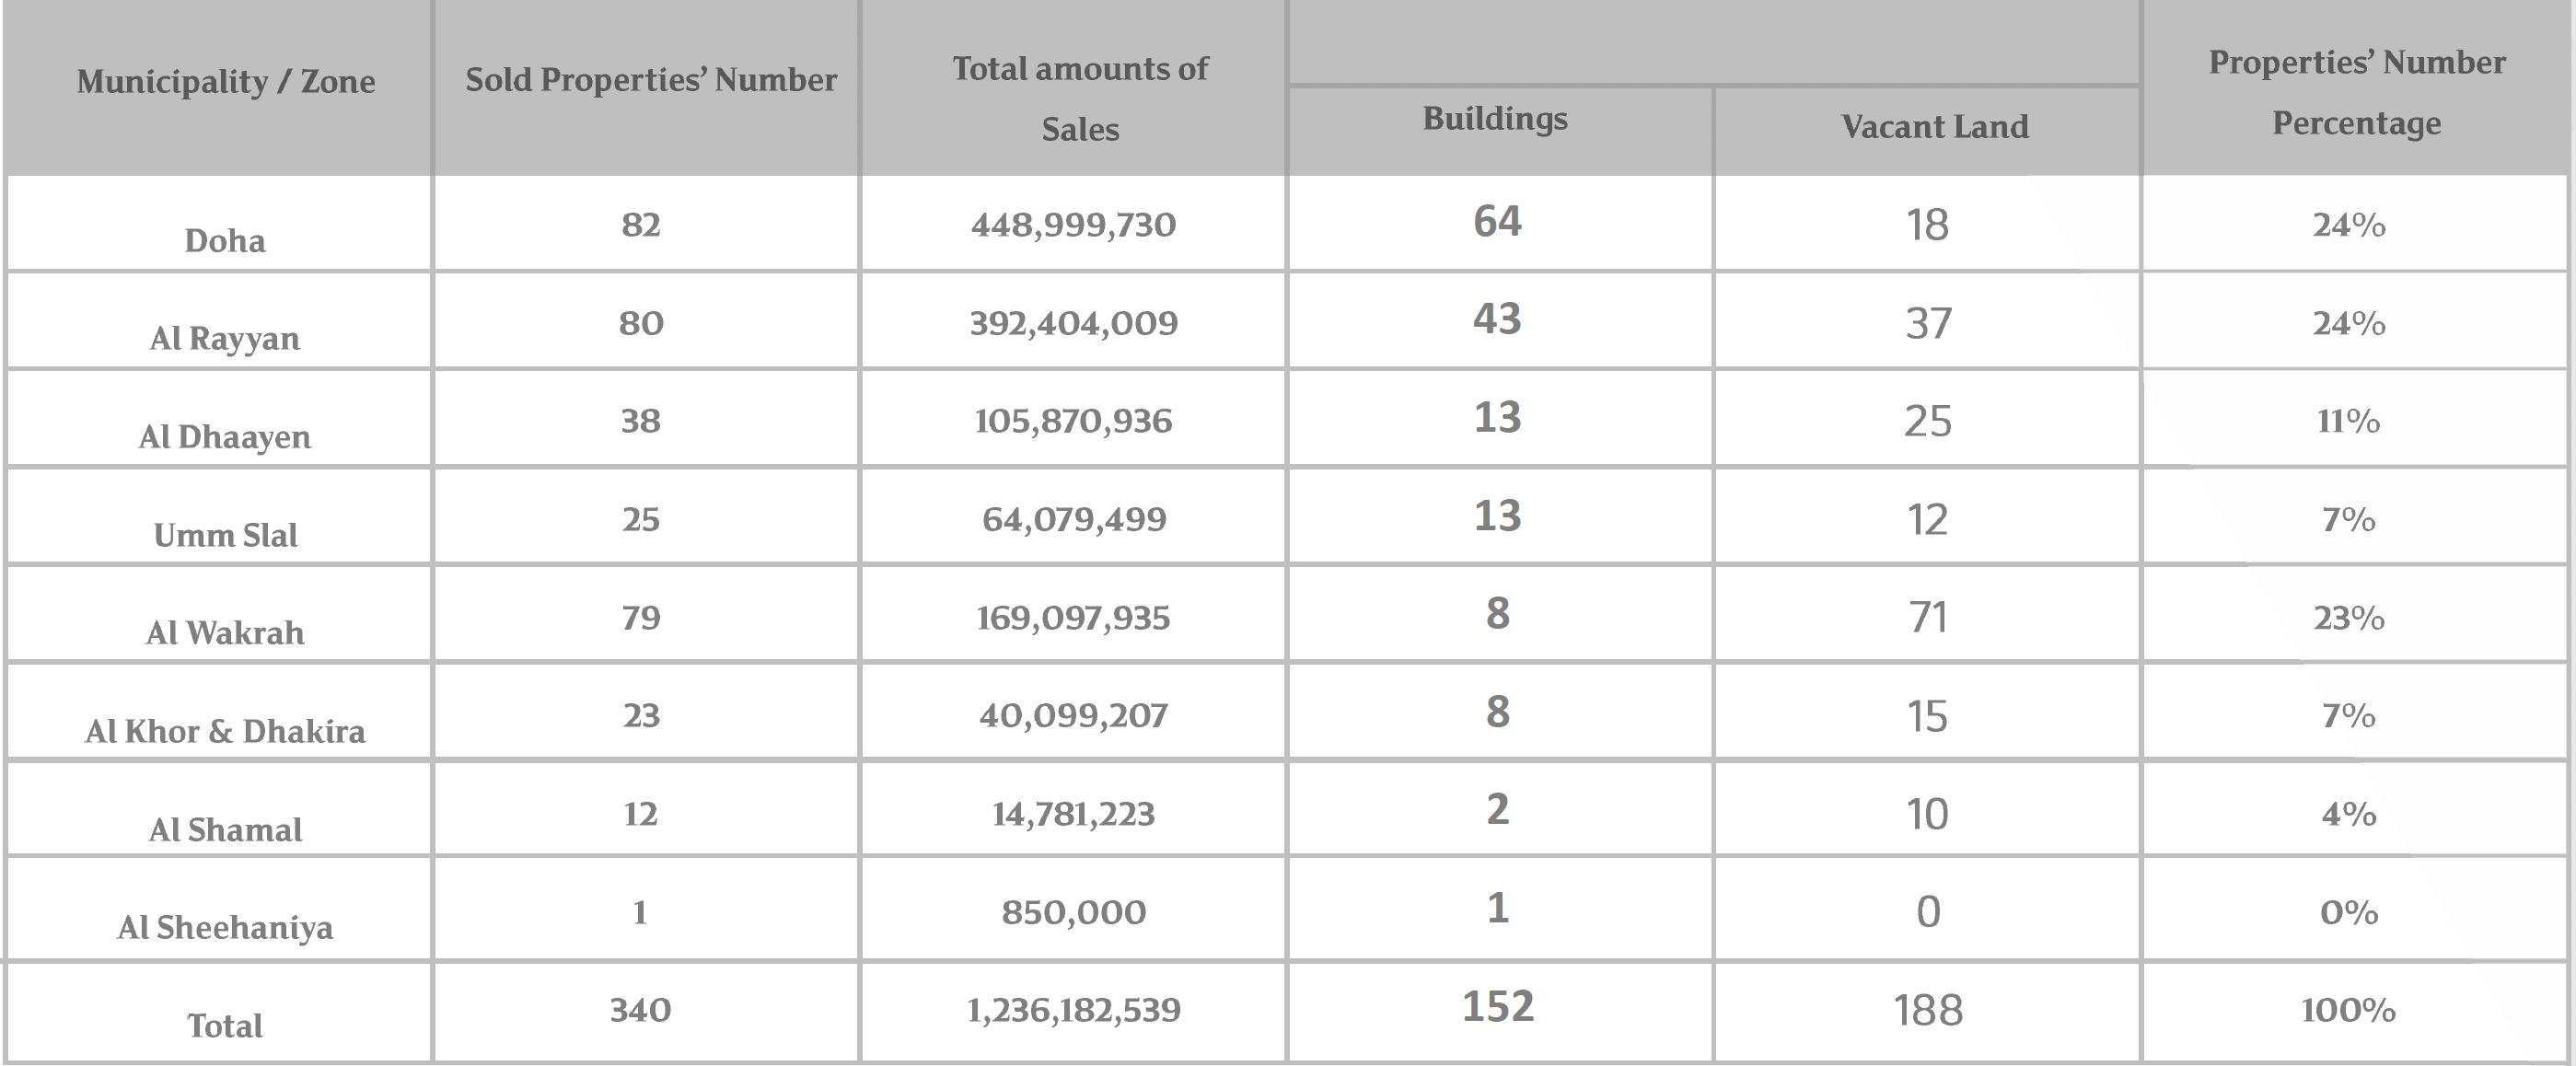
List of the Monthly Bulletin of the Properties Sold for March 2023
The Real Estate Bulletin I March 2023/ Ministry of Justice
Real Estate Trading Volume

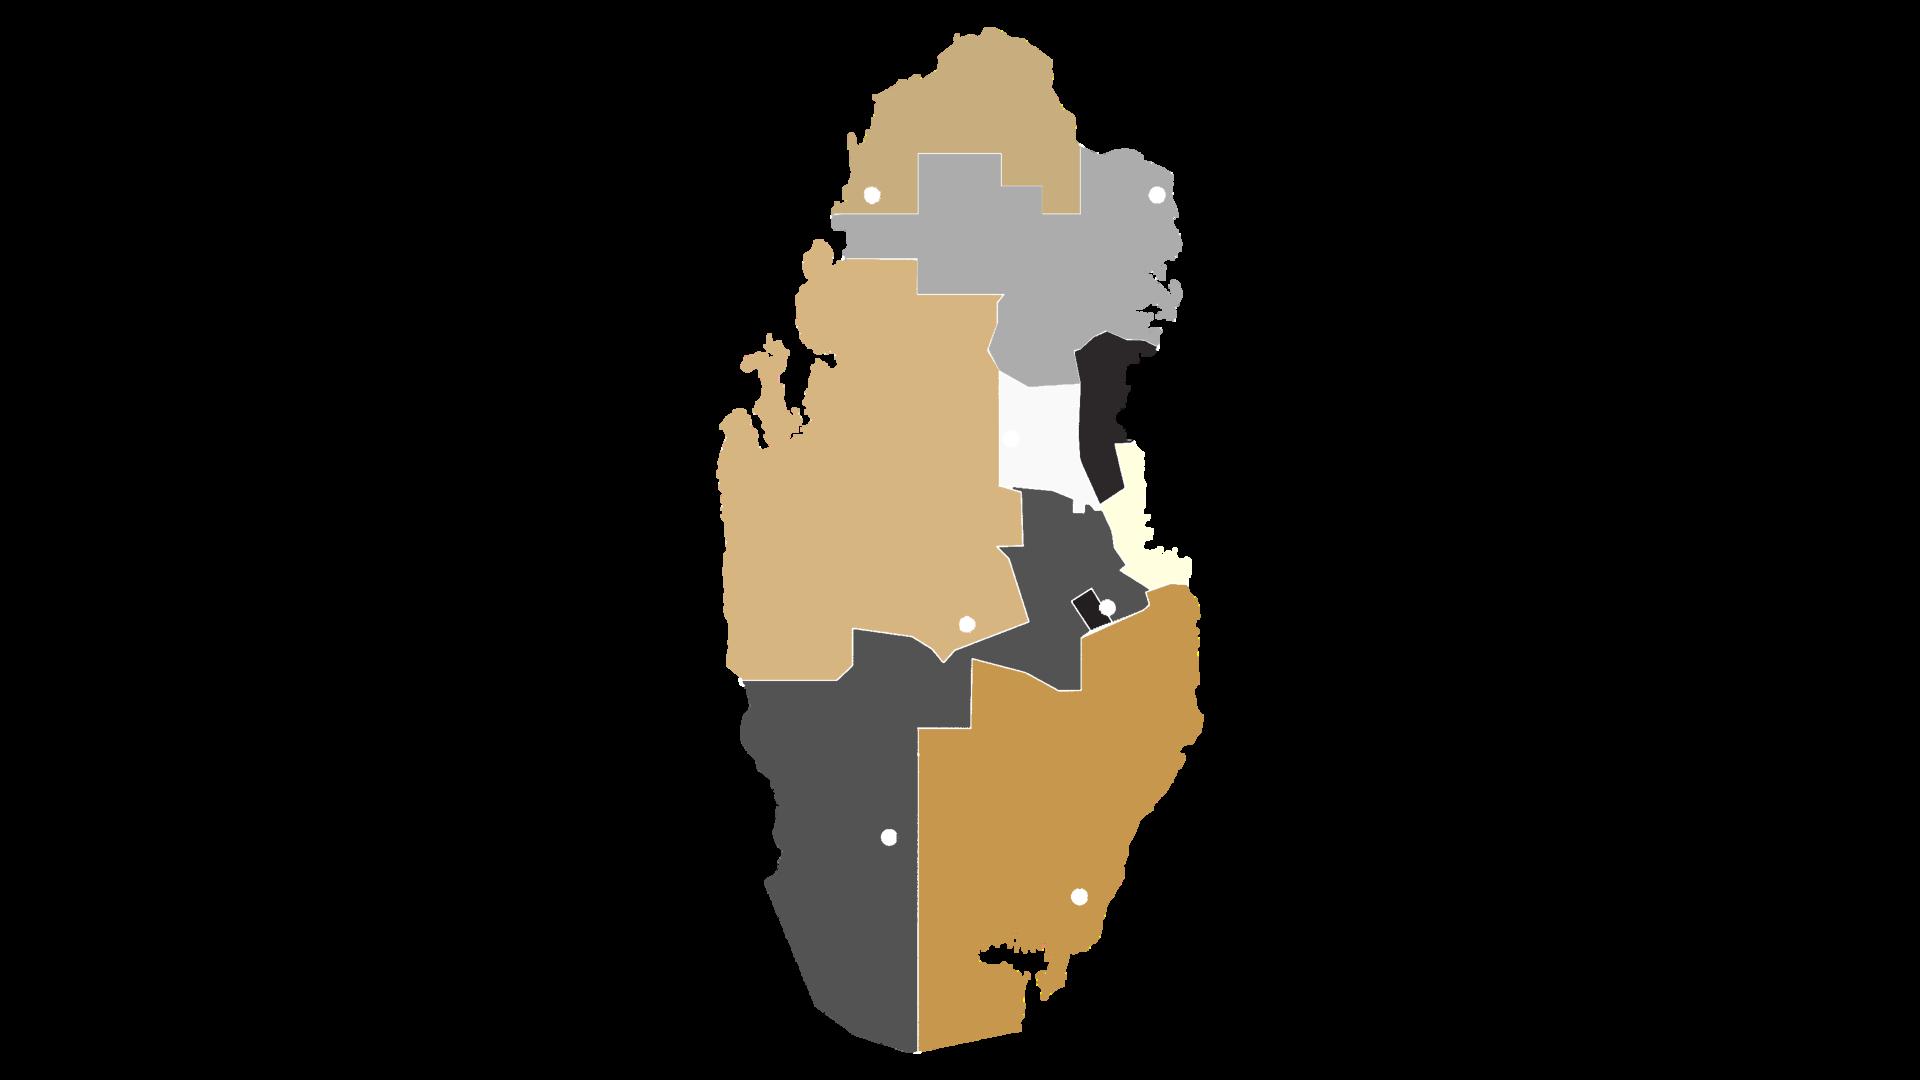
The Deals Financial Value Index for March 2023
Doha Municipality and Al Wakrah Municipality are the most active in terms of financial value, with Doha Municipality dealings reaching (448,999,730) QR, Al Rayyan Municipality ranking second with (7,392,404,009) QR, and Al Wakrah Municipality ranking third with (169,097,935) QR
Doha
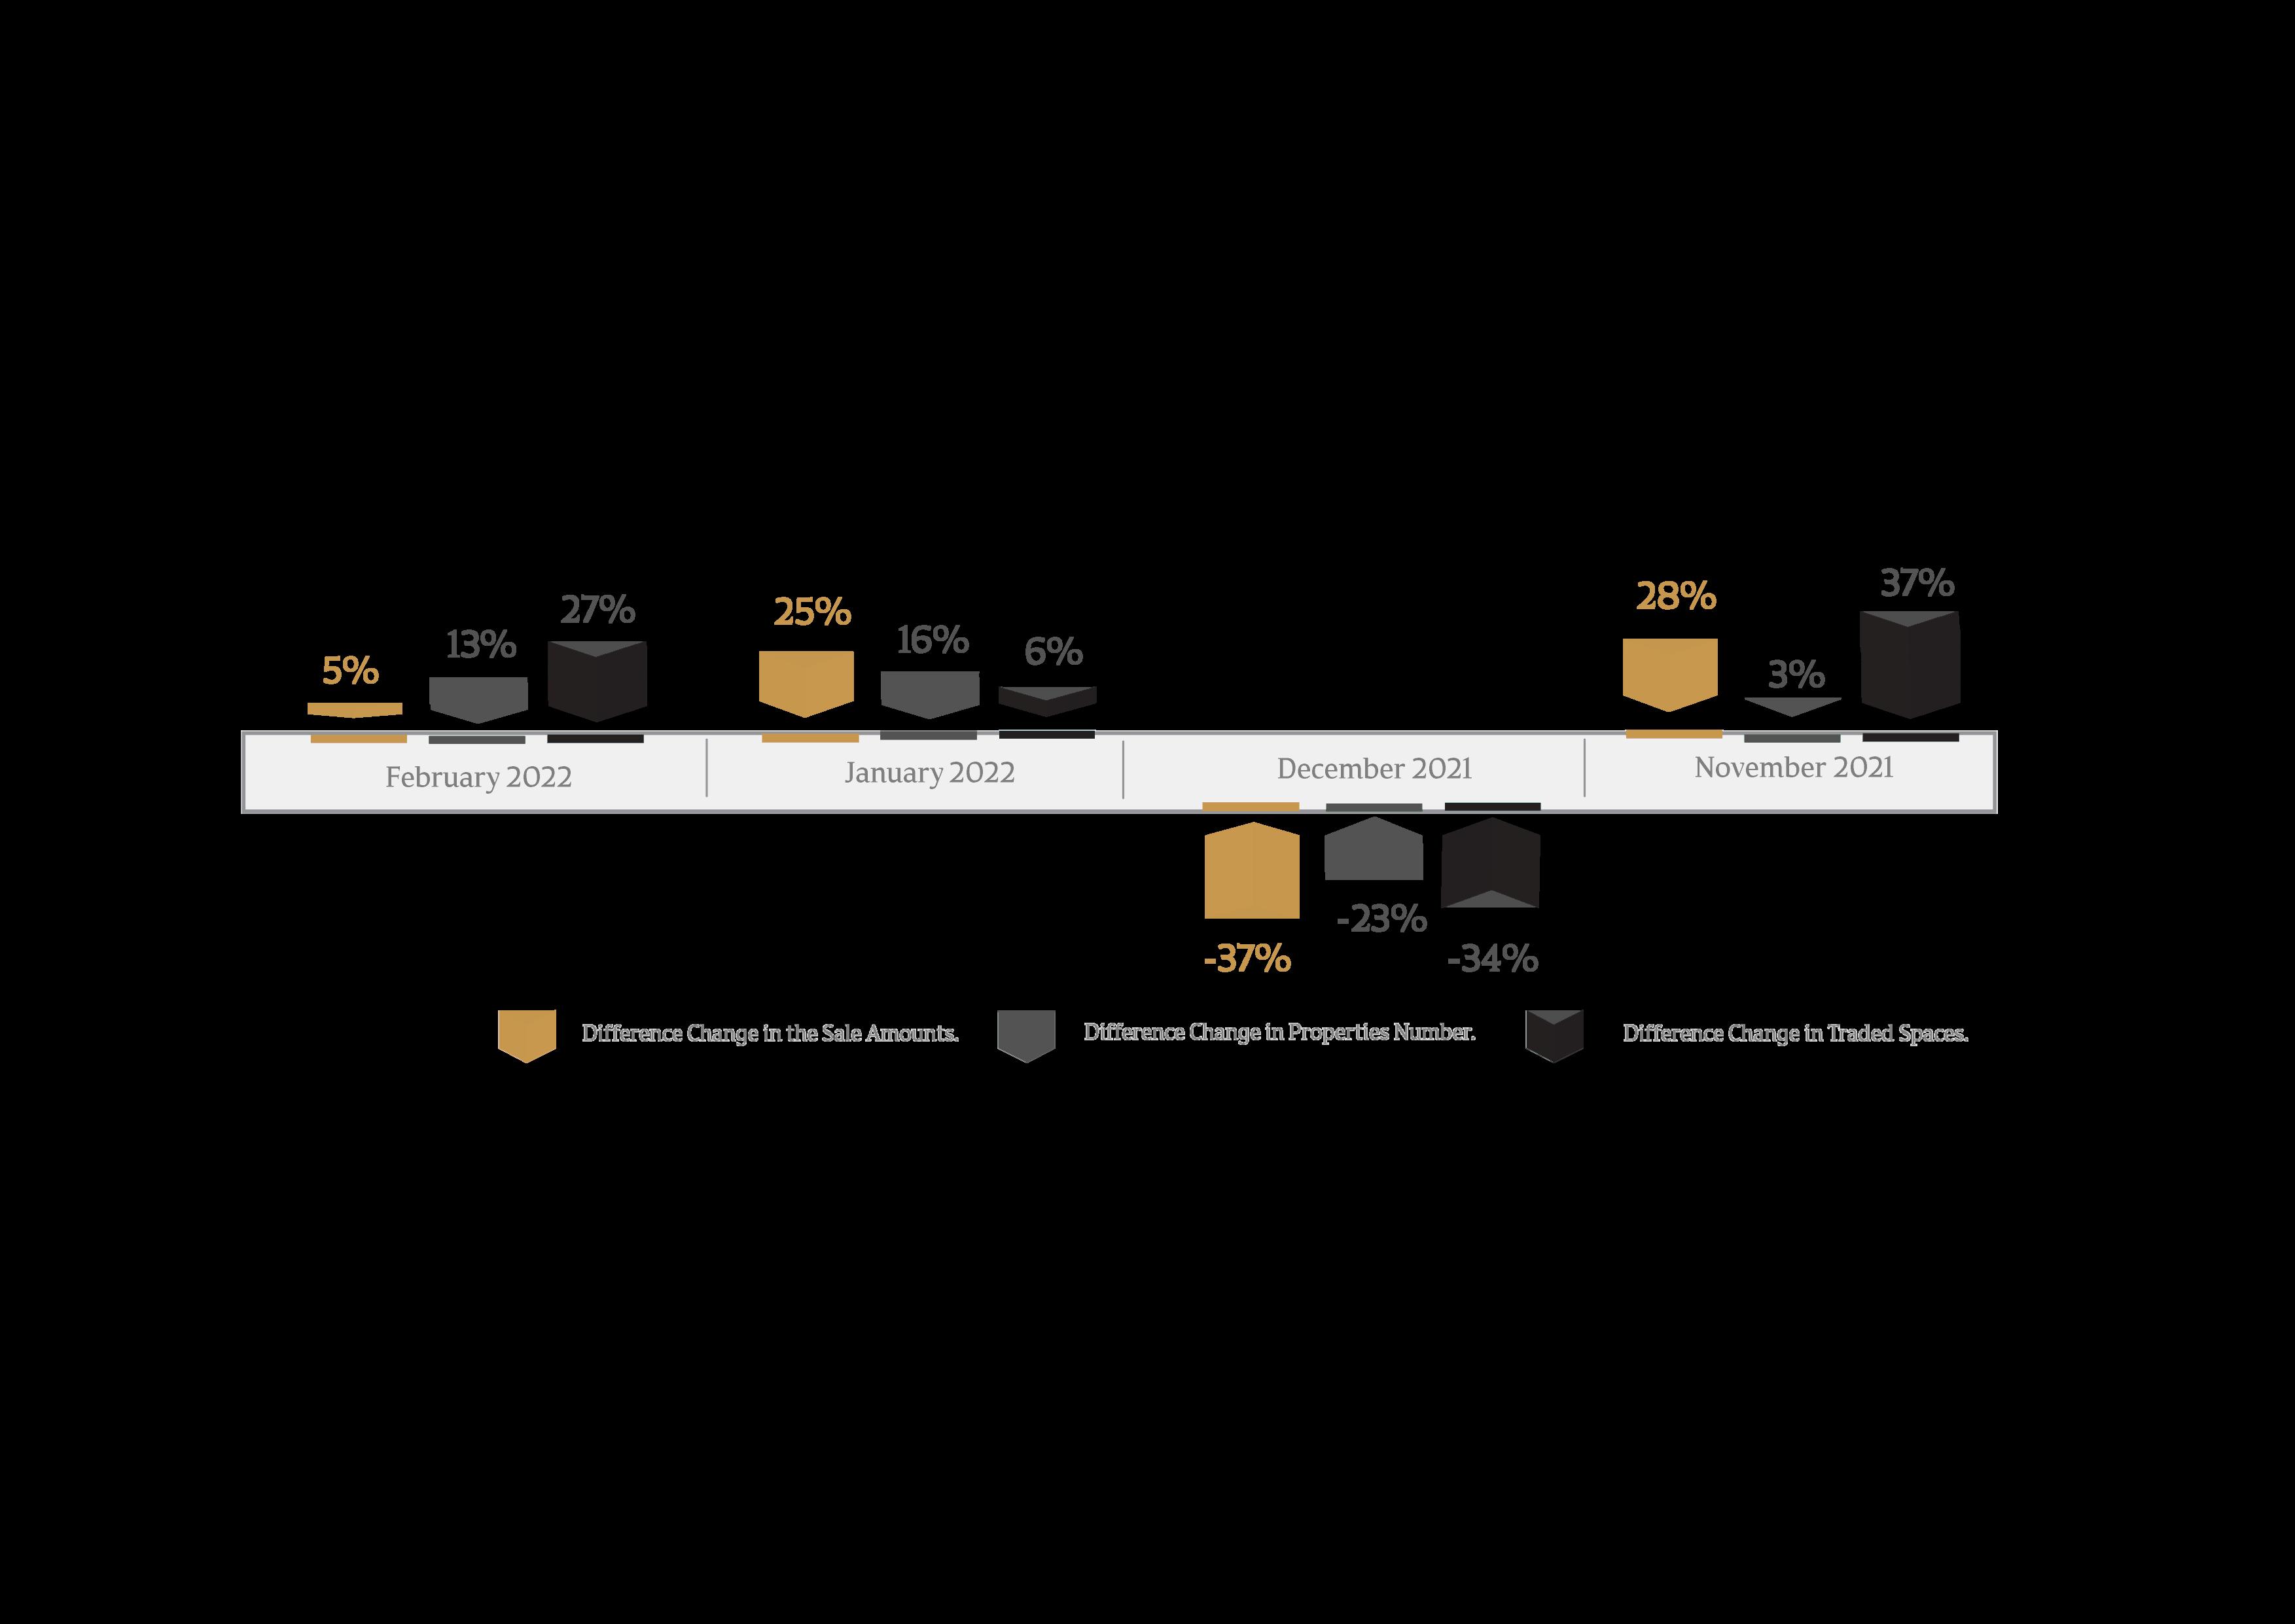
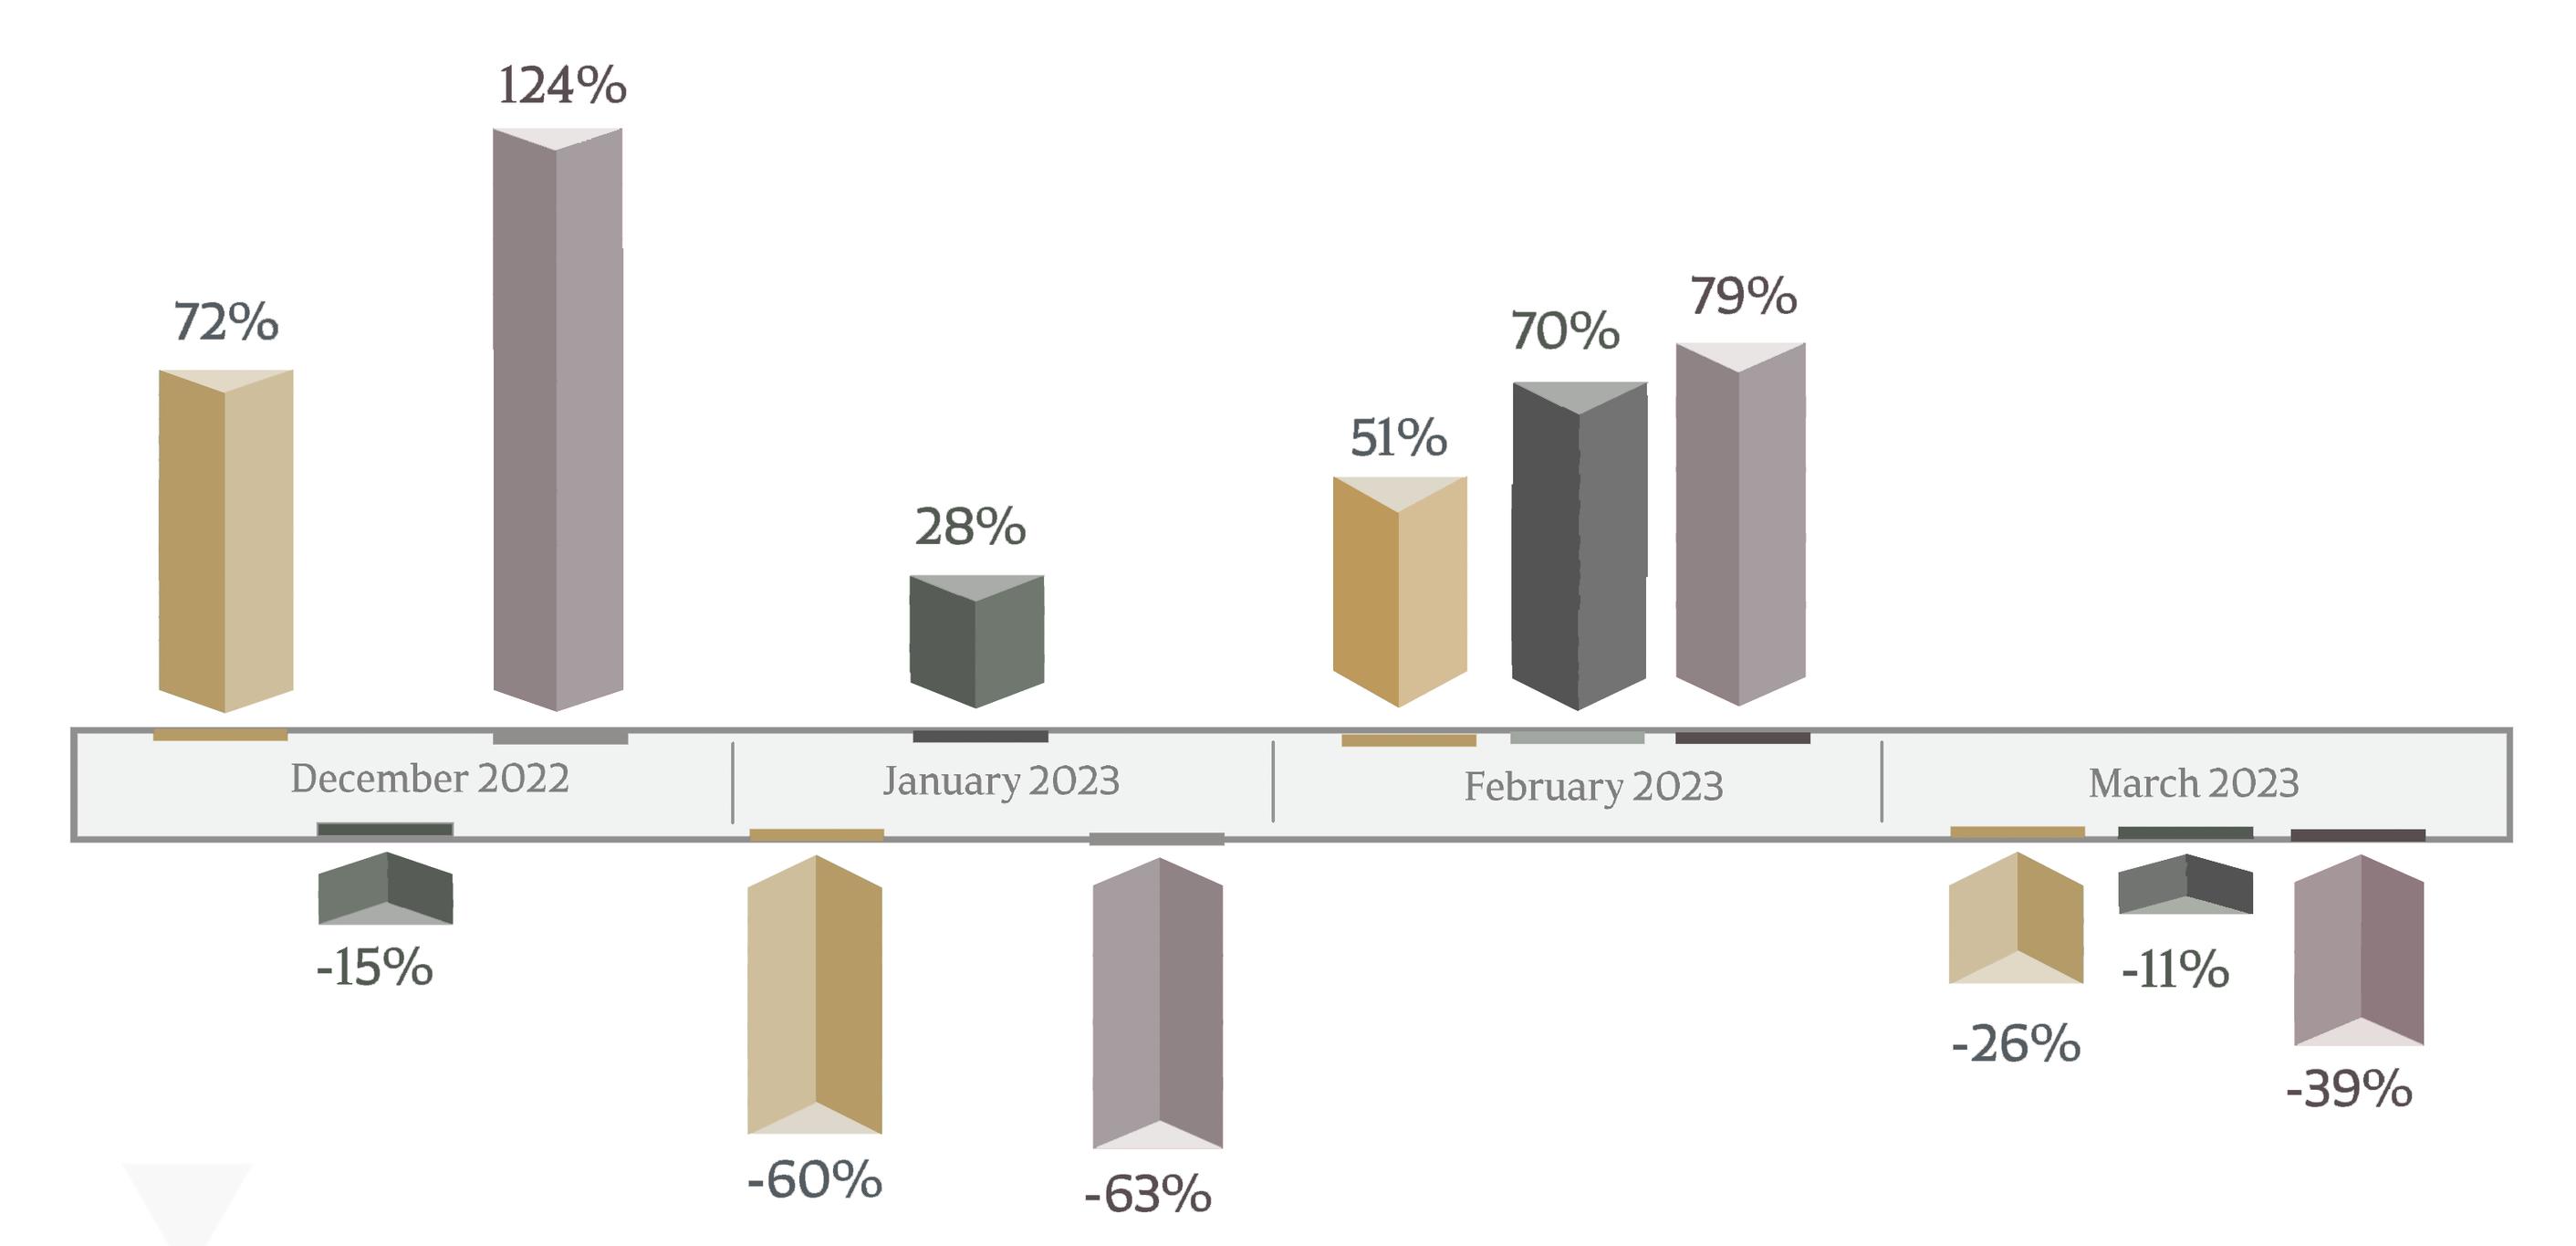
Difference in Performance Change Of the Real Estate
During March 2023 The Real Estate Bulletin I March 2023/ Ministry of Justice
Market
Ministry
Justice Al-Rayyan Al Dhaayen Al sheehaniya Umm Slal 448,999,730 392,404,009 169,097,935 105,870,936 64,079,499 14,781,223 Al Wakrah Al Khor & Dhakira 40,099,207 Al Shamal 850,000
The Real Estate Bulletin I March 2023/
of
Number of Traded Properties as per Municipalities
TradedSpaces

Percentage of Traded Spaces as per Municipalities
Al Rayyan and Al Wakrah Municipality has 28% of the trading movement, followed by Doha Municipality (20%)
Doha Municipality QR 448 999 730 Al Daayen Municipality QR 105,870,936 Al-Khor & Dhekra Municipality QR 40 099 207 Al Shamal Municipality QR 14,781,223 Umm Slal Municipality Al Sheehaniya Municipality QR 64,079,499 QR 850,000 Al Rayyan Municipality QR 392,404,009 Al Wakrah Municipality QR 169,097,935
12 25 1 80 79 82 38 23 AlRayyan 28% AlWakrah 28% Doha 20% AlDhaayen 9% UmmSlal 7% Al-Khor&DhekraMunicipality 5%
The Real Estate Bulletin I March 2023/ Ministry of Justice The Real Estate Bulletin I March 2023/ Ministry of Justice Al Shamal 3%
Doha andAl Rayyan Municipality sold the most real estate (24%), followed by Al Wakra (23%).
Mortgage Trading Movement during March 2023
Al Rayyan Municipality recorded the highest number of mortgage transactions with (35) transactions, equivalent to (36.1%) of the total number of mortgaged real estate, followed by Doha Municipality, with (33) transactions, equivalent to (34%) of the total number of mortgaged real estate.

Doha 24% AlRayyan 24% AlWakrah 23% AlDhaayen 11% AlKhorandAlDakhira 7% UmmSlal 7%
The Real Estate Bulletin I March 2023/
of
TransactionsNumberIndicator The Real Estate Bulletin I March 2023/ Ministry of Justice AlRayyan 361% Doha 34% AlDhaayen 103% AlWakra 82% UmmSlal 72% AlShamal 21%
Percentage of Number of Deals Traded as per Municipalities
Ministry
Justice
Al
shamal 4%
AverageperSquareFootPricesforMarch2023andFebruary2023 The Real Estate Bulletin I March 2023/ Ministry of Justice Doha Al Wakrah Umm Slal Al Dhaayen Al-Shamal Al Khor and Dakhira 996 Al Rayyan 474 445 208 519 391 558 234 267 604 171 227 Doha Al Wakrah Umm Slal Al Dhaayen Al-Shamal Al Khor and Dakhira 1338 Al Rayyan 632 459 180 579 311 453 327 171 677 446 206 March 2023 February 2023
Buildings Vacant Land Buildings Vacant Land 297 106 324 Al sheehaniya 365 151 Al Sheehaniya 369
Al Sheehaniya Municipality has not registered any building sale transaction
Al Sheehaniya Municipality has not registered any sale transaction
Top Ten Properties
Khaled
Khaled
The Real Estate Bulletin I March 2023/ Ministry of Justice
List of the top (10) real estate in March 2023, including six (6) in Al Rayyan Municipality.
Fereej bin Birham New Al Rayyan Rawdat Al Khail 15,500,000 17,008,000 18,000,000 19,722,816 26,000,000 23,400,000 26,000,000 35,556,290 37,300,000 Doha Al Rayyan Doha Al Rayyan Al
Al Rayyan Doha Al Rayyan 20,000,000 Doha
Rayyan
The Ten Most Expensive Properties for March 2023
Al Waab Al
Rayyan Rawdat Al Khail Ain Khaled Ain
Ain
Al Sadd Al Waab
Mortgage Trading Movement during March 2023

Doha Municipality had the most mortgages (3,631,400,183) QR, while Al Wakrah had the least (6,963,128 QR)
A study of the mortgage transaction movement index reveals that the percentage of mortgaged real estate is higher than the percentage of mortgage transaction amounts in all municipalities that recorded mortgage transactions, except for Doha
Percentage of the Number and Amounts of mortgage transactions as per Municipalities
1,277,109,031 419,821,706 89,308,043 35,994,208 Al Dhaayen 20,064,529 3,365,000 Al Wakrah Doha Al Shamal The Real Estate Bulletin I March 2023/ Ministry of Justice
0 25 50 75 AlShamal AlKhor&Dhekra UmmSlal AlWakrah AlDhaayen AlRayyan Doha 0 2% 4 8% 1 1% 8 2% 1 9% 69 1% 10 3% 22 7% 34% The Real Estate Bulletin I March 2023/ Ministry of Justice
The Mortgage Amounts Percentage The Properties Number Percentage Al Rayyan Umm Slal 0 1% 2 1% 2 1% 2,460,000 Al Khor & Dhekra 7 2% 36 1%
9% 91%
Total of the top 10 mortgage Transactions
Total of Remaining Mortgage Transactions
The total percentage of the Top Mortgage Transactions
The Real Estate Bulletin I March 2023/ Ministry of Justice
Doha Municipality recorded 5 of the top 10 mortgaged properties in March 2023 The top ten real estate mortgage deals accounted for 79% of March's total value
Real Estate Trading Movement - The Pearl and Al Kassar Area
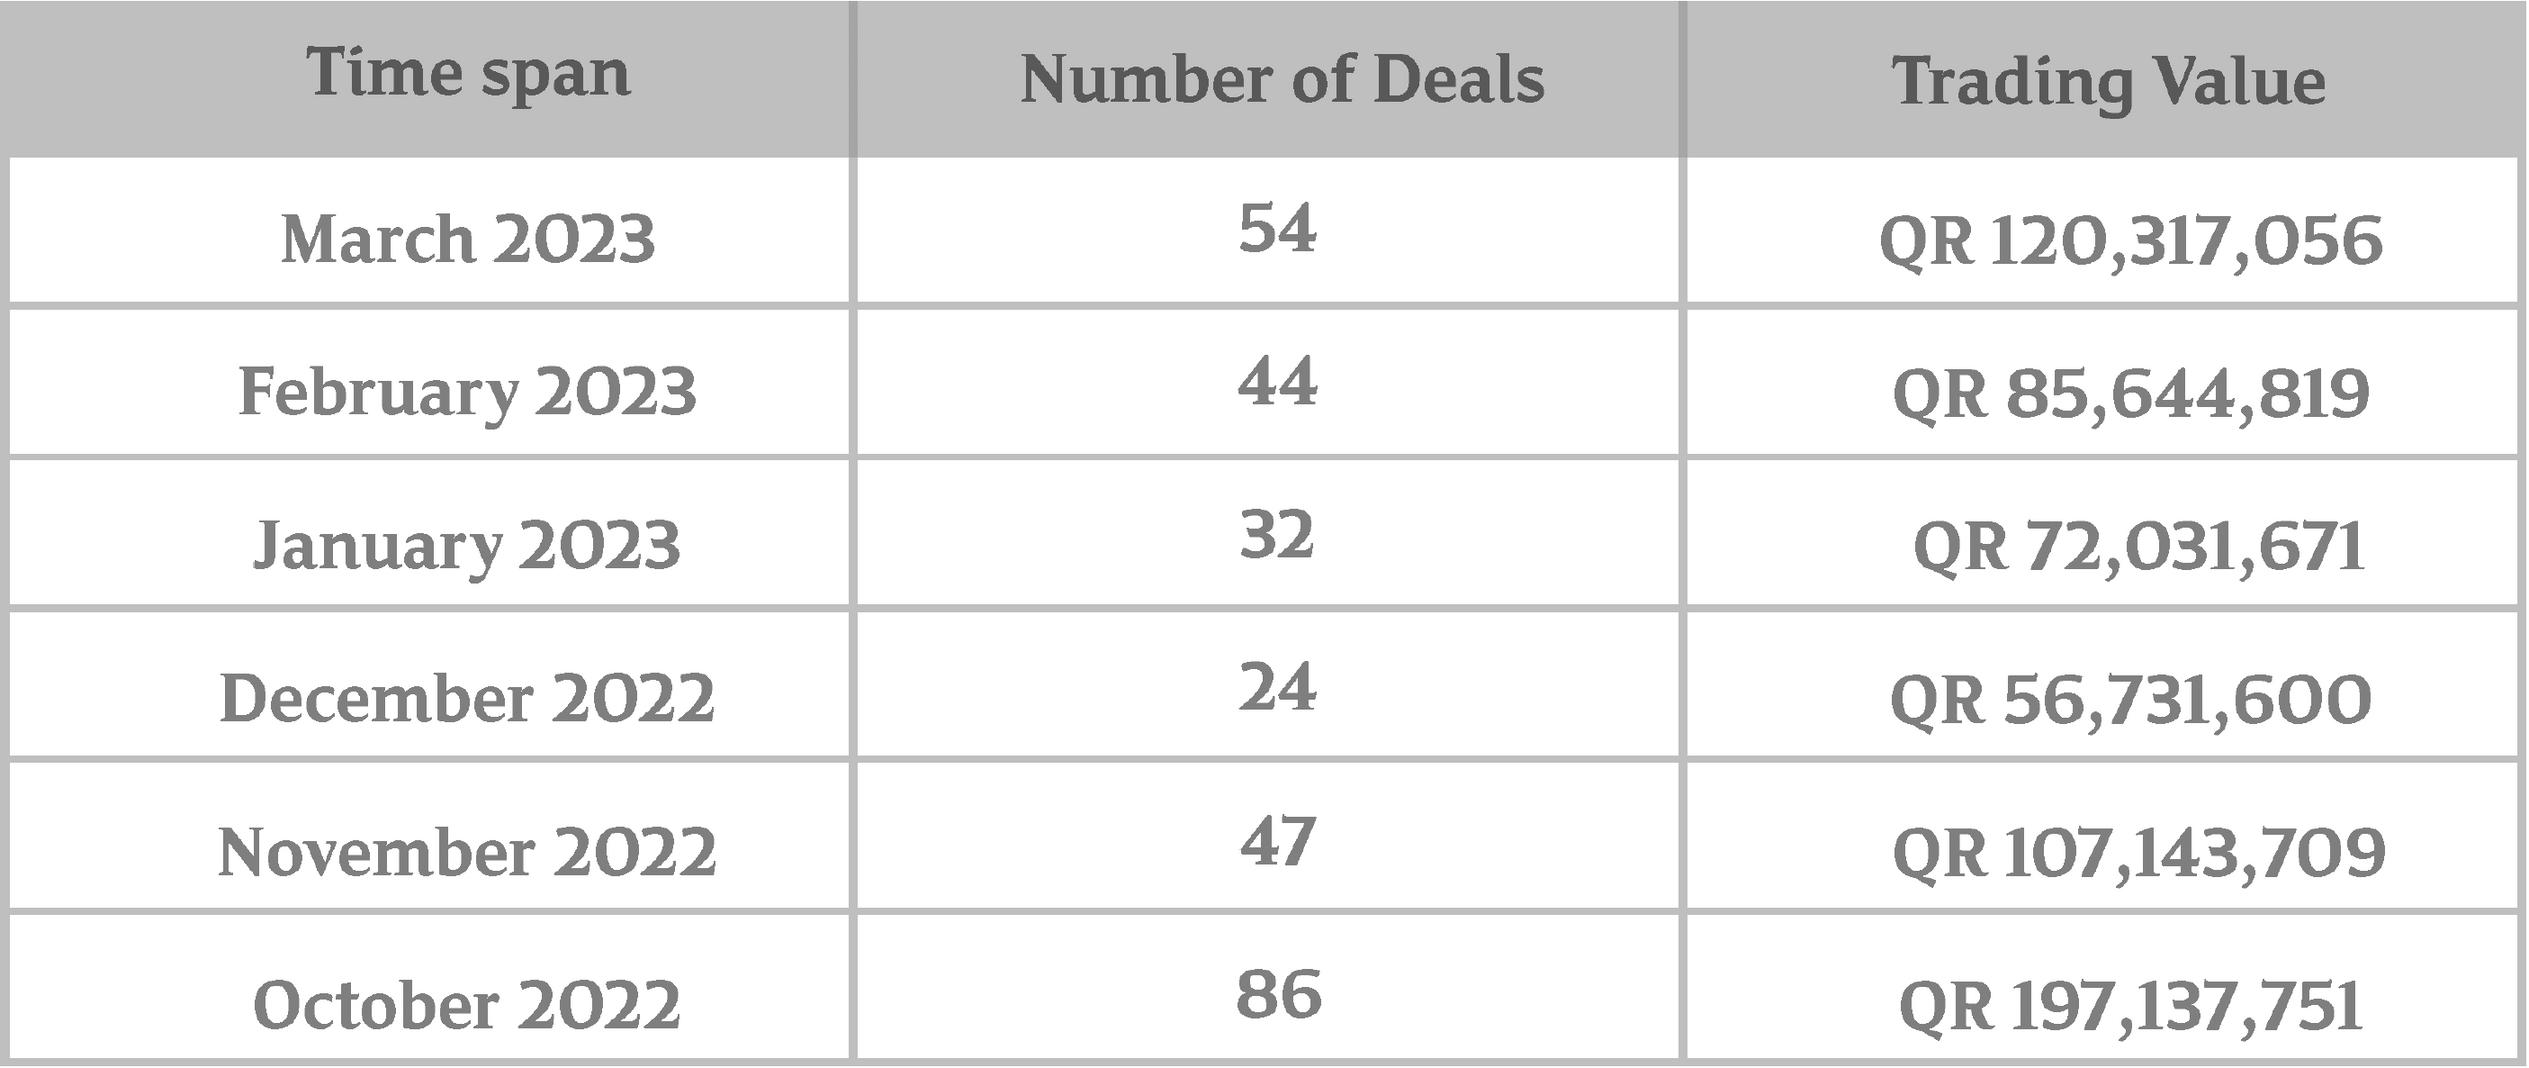
Comparison of Residential Units Trading Indicators March 2023 had an increase in The Pearl and Al Kassar Area than February 2023 54 residential unit transactions totaled
The Real Estate Bulletin I March 2023/ Ministry of Justice

MortgageTradingMovementduringMarch2023
120,317,056 QR

Email: contacts@thepearlgastes.com