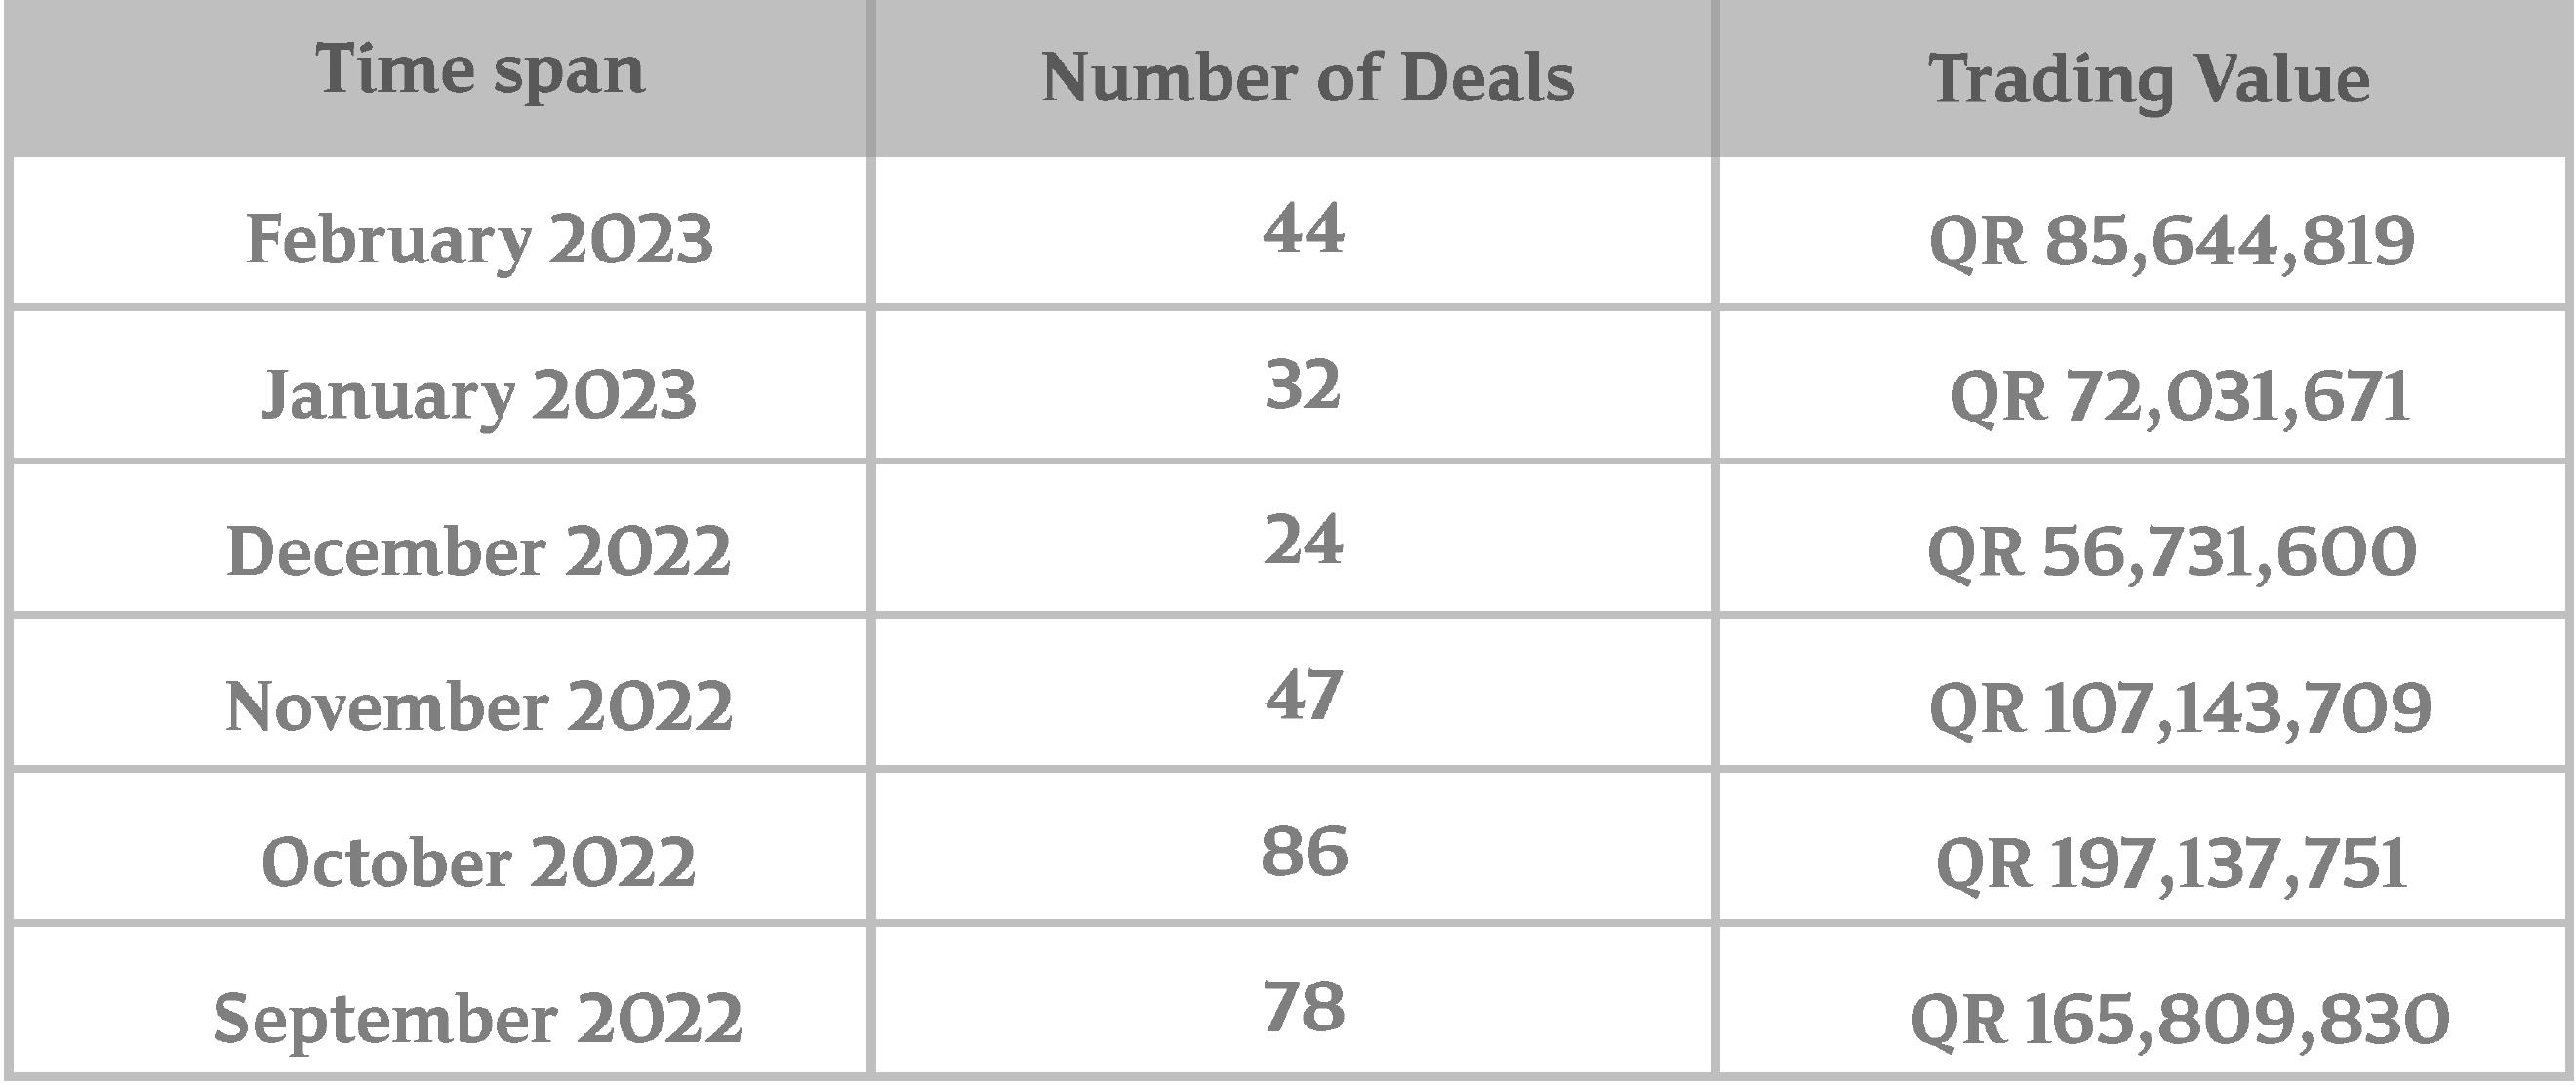
Real Estate Trading Volume During February 2023

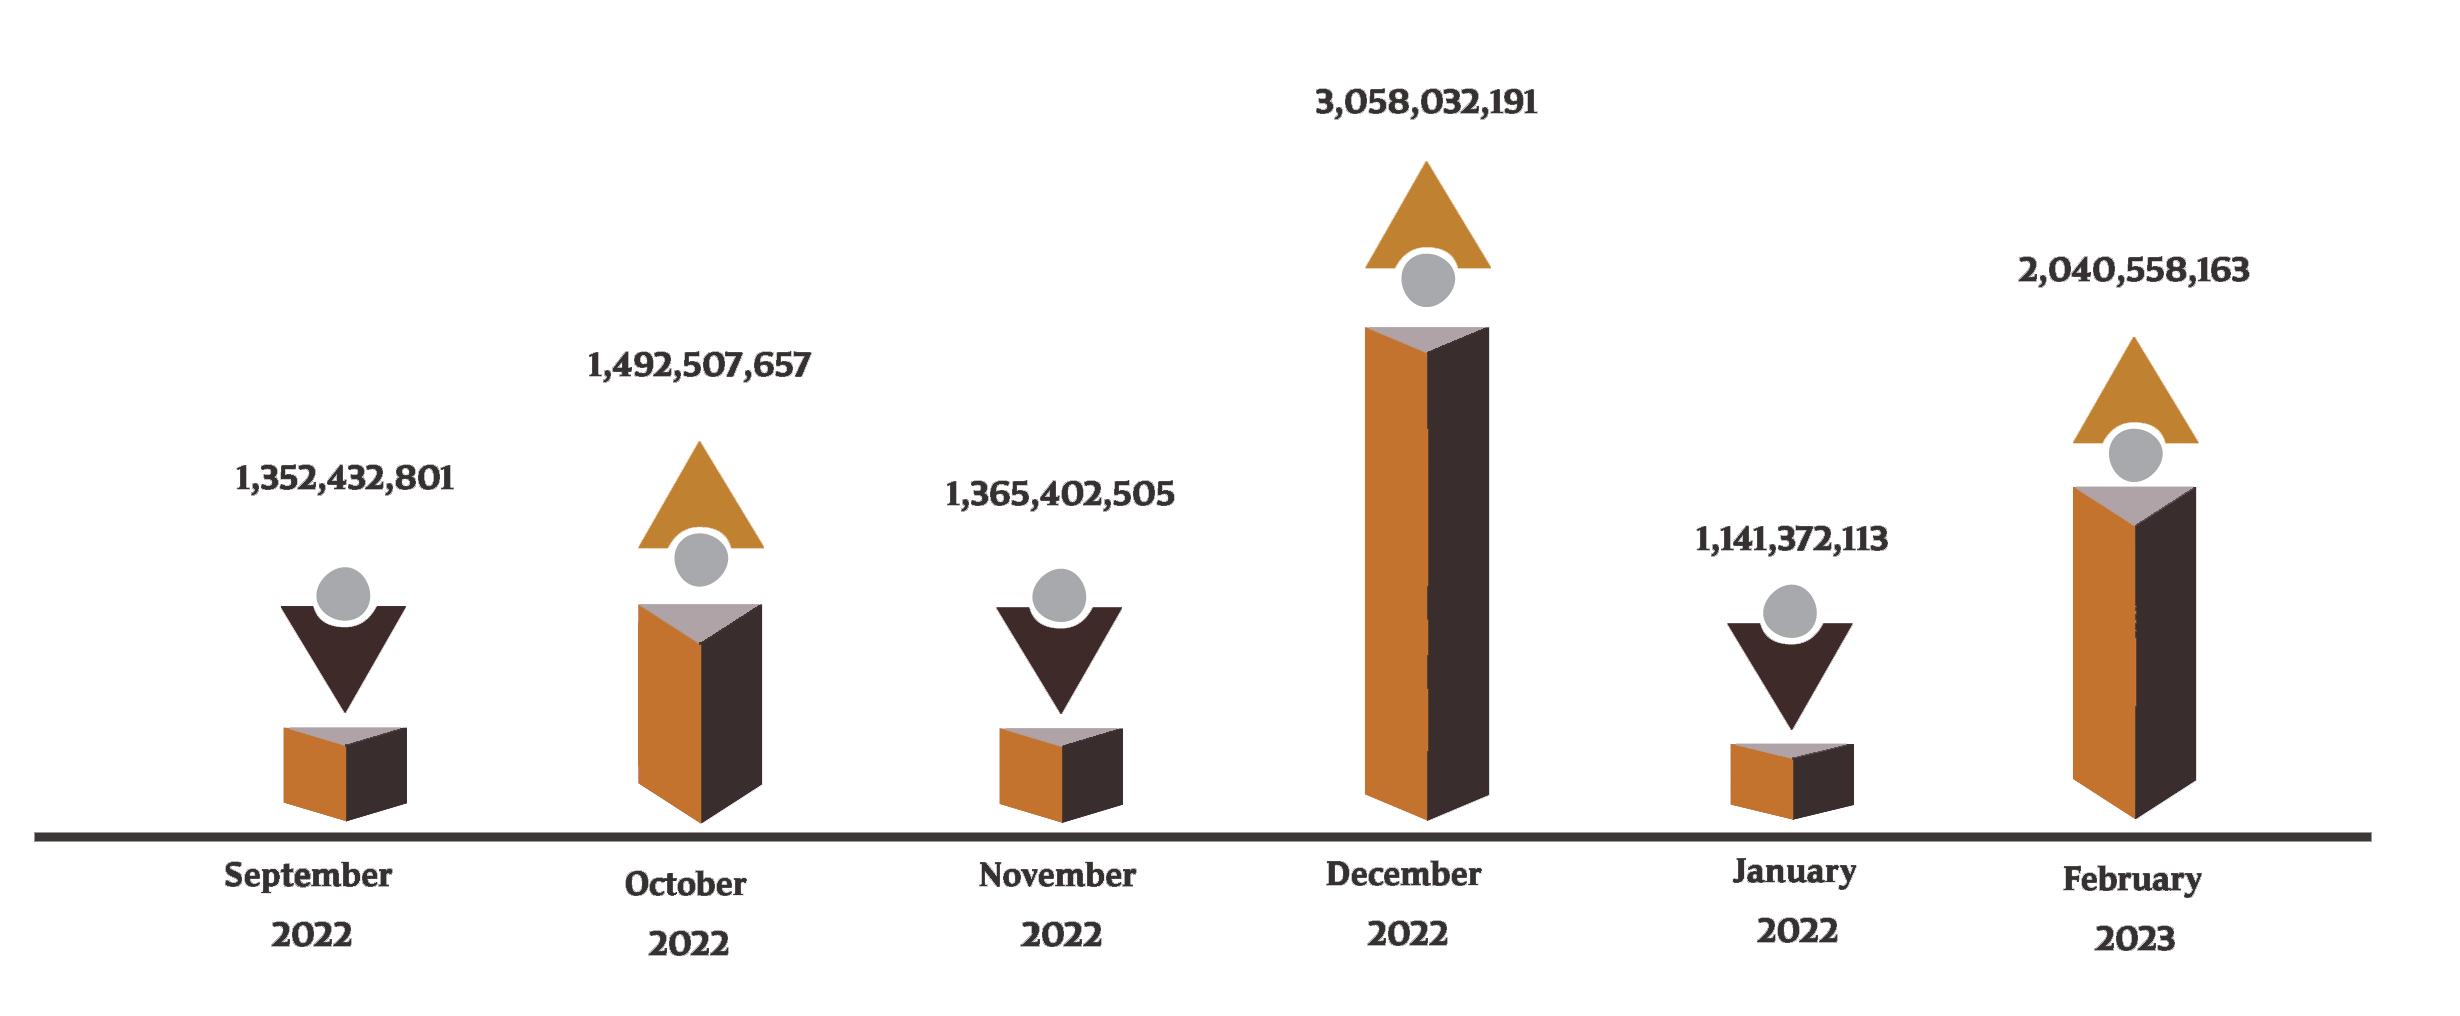
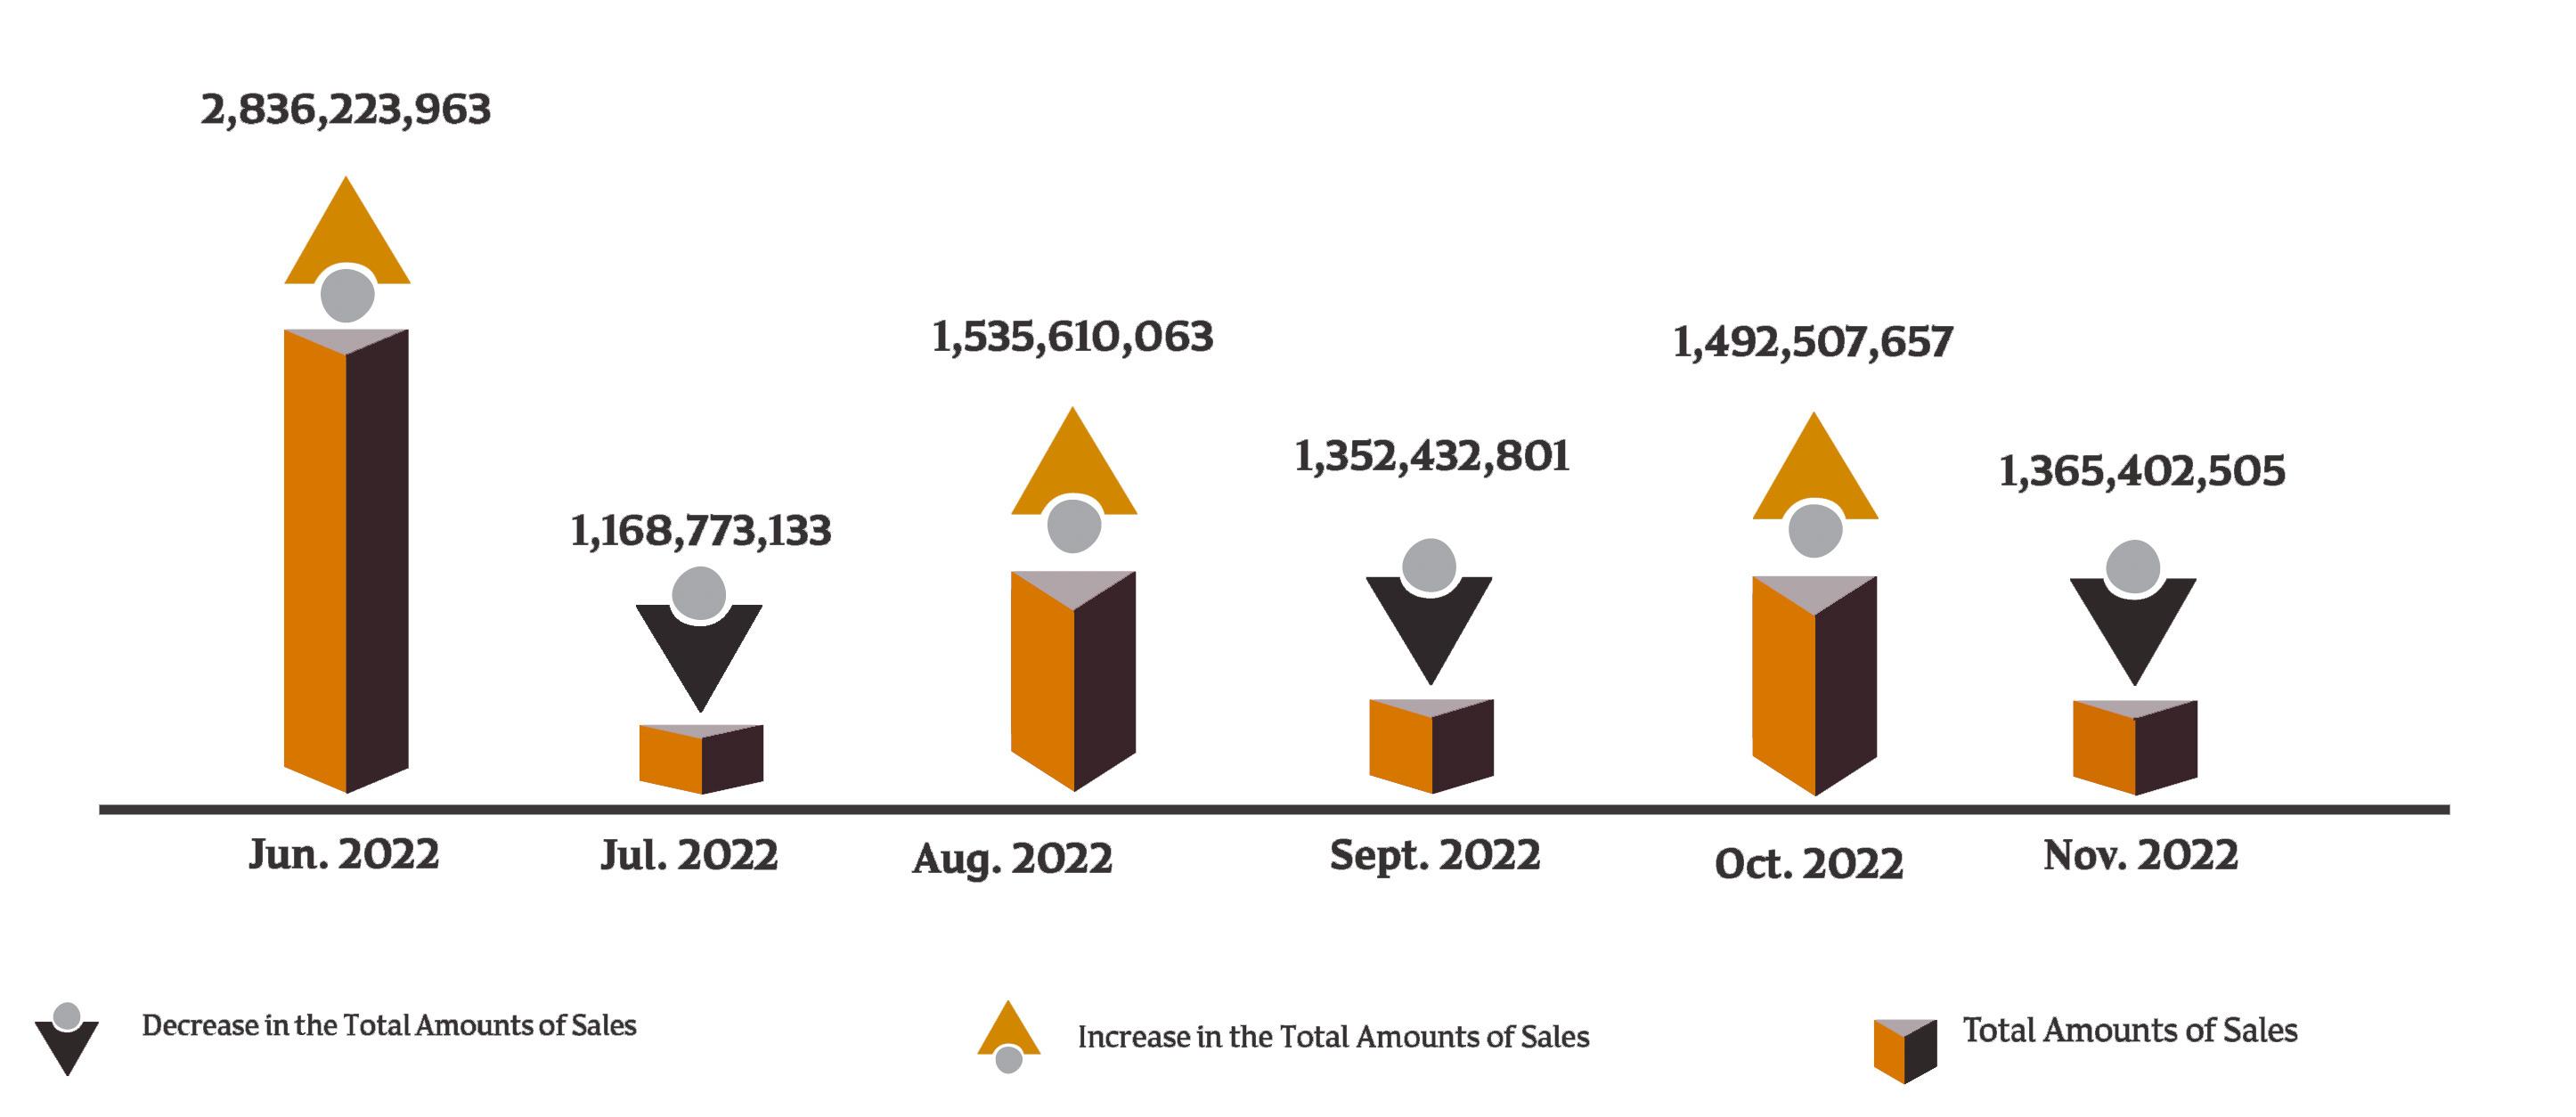
The Deals Financial Value Index for February 2023
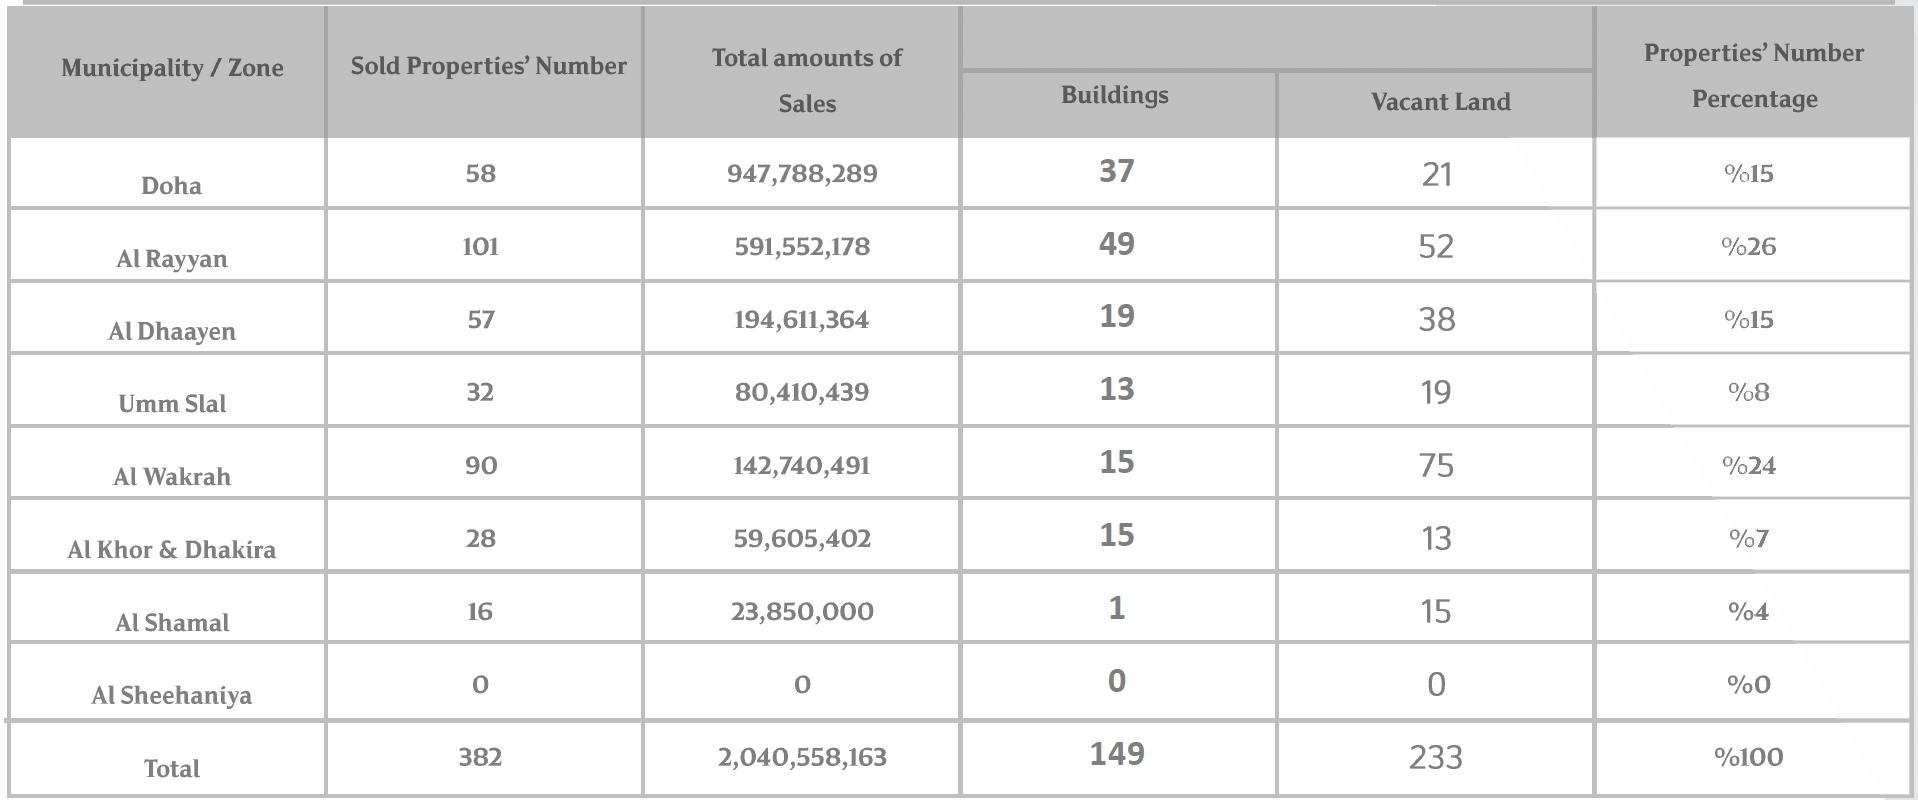
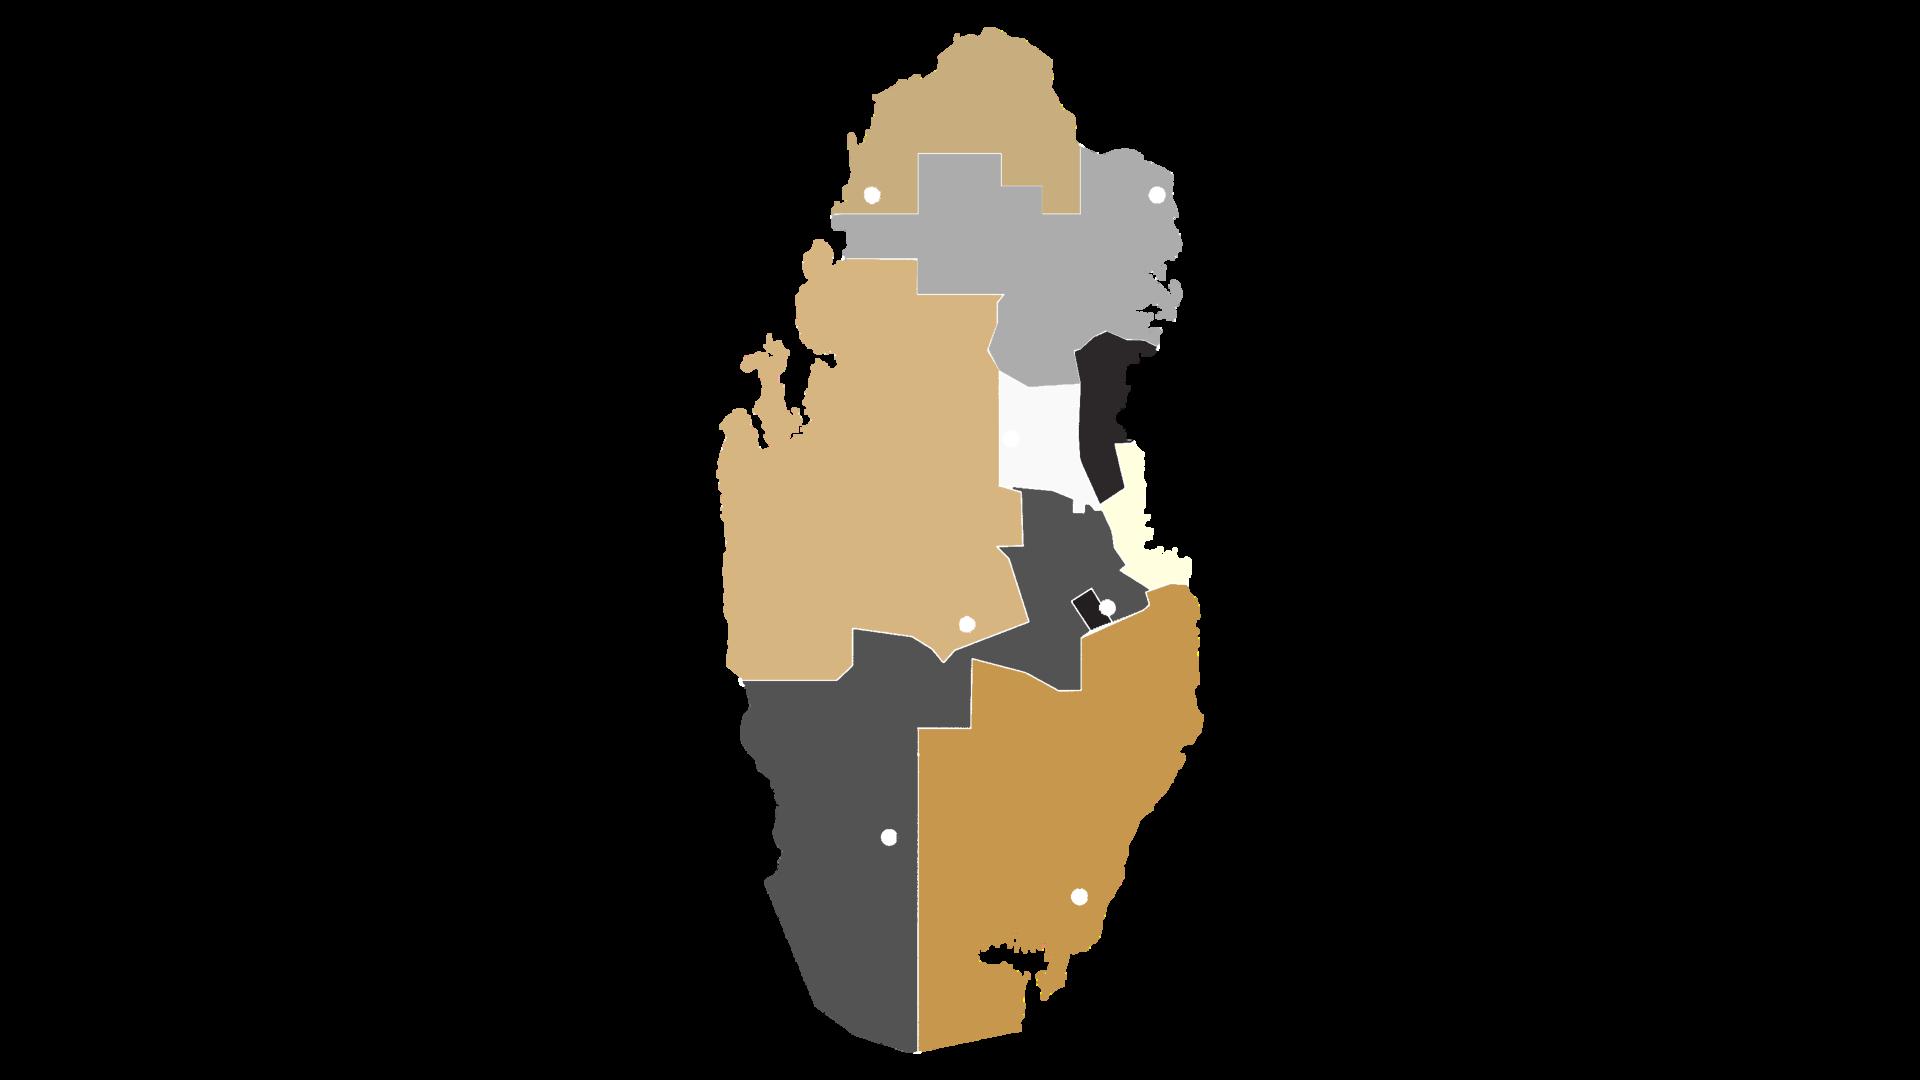
Doha Municipality, Al Rayyan and Al Dhaayen Municipality are the most active in terms of financial value, with Doha Municipality dealings reaching (947,788,289) QR, Al Rayyan Municipality ranking second with (591,552,178) QR, and Al Dhaayen Municipality ranking third with (194,611,364) QR
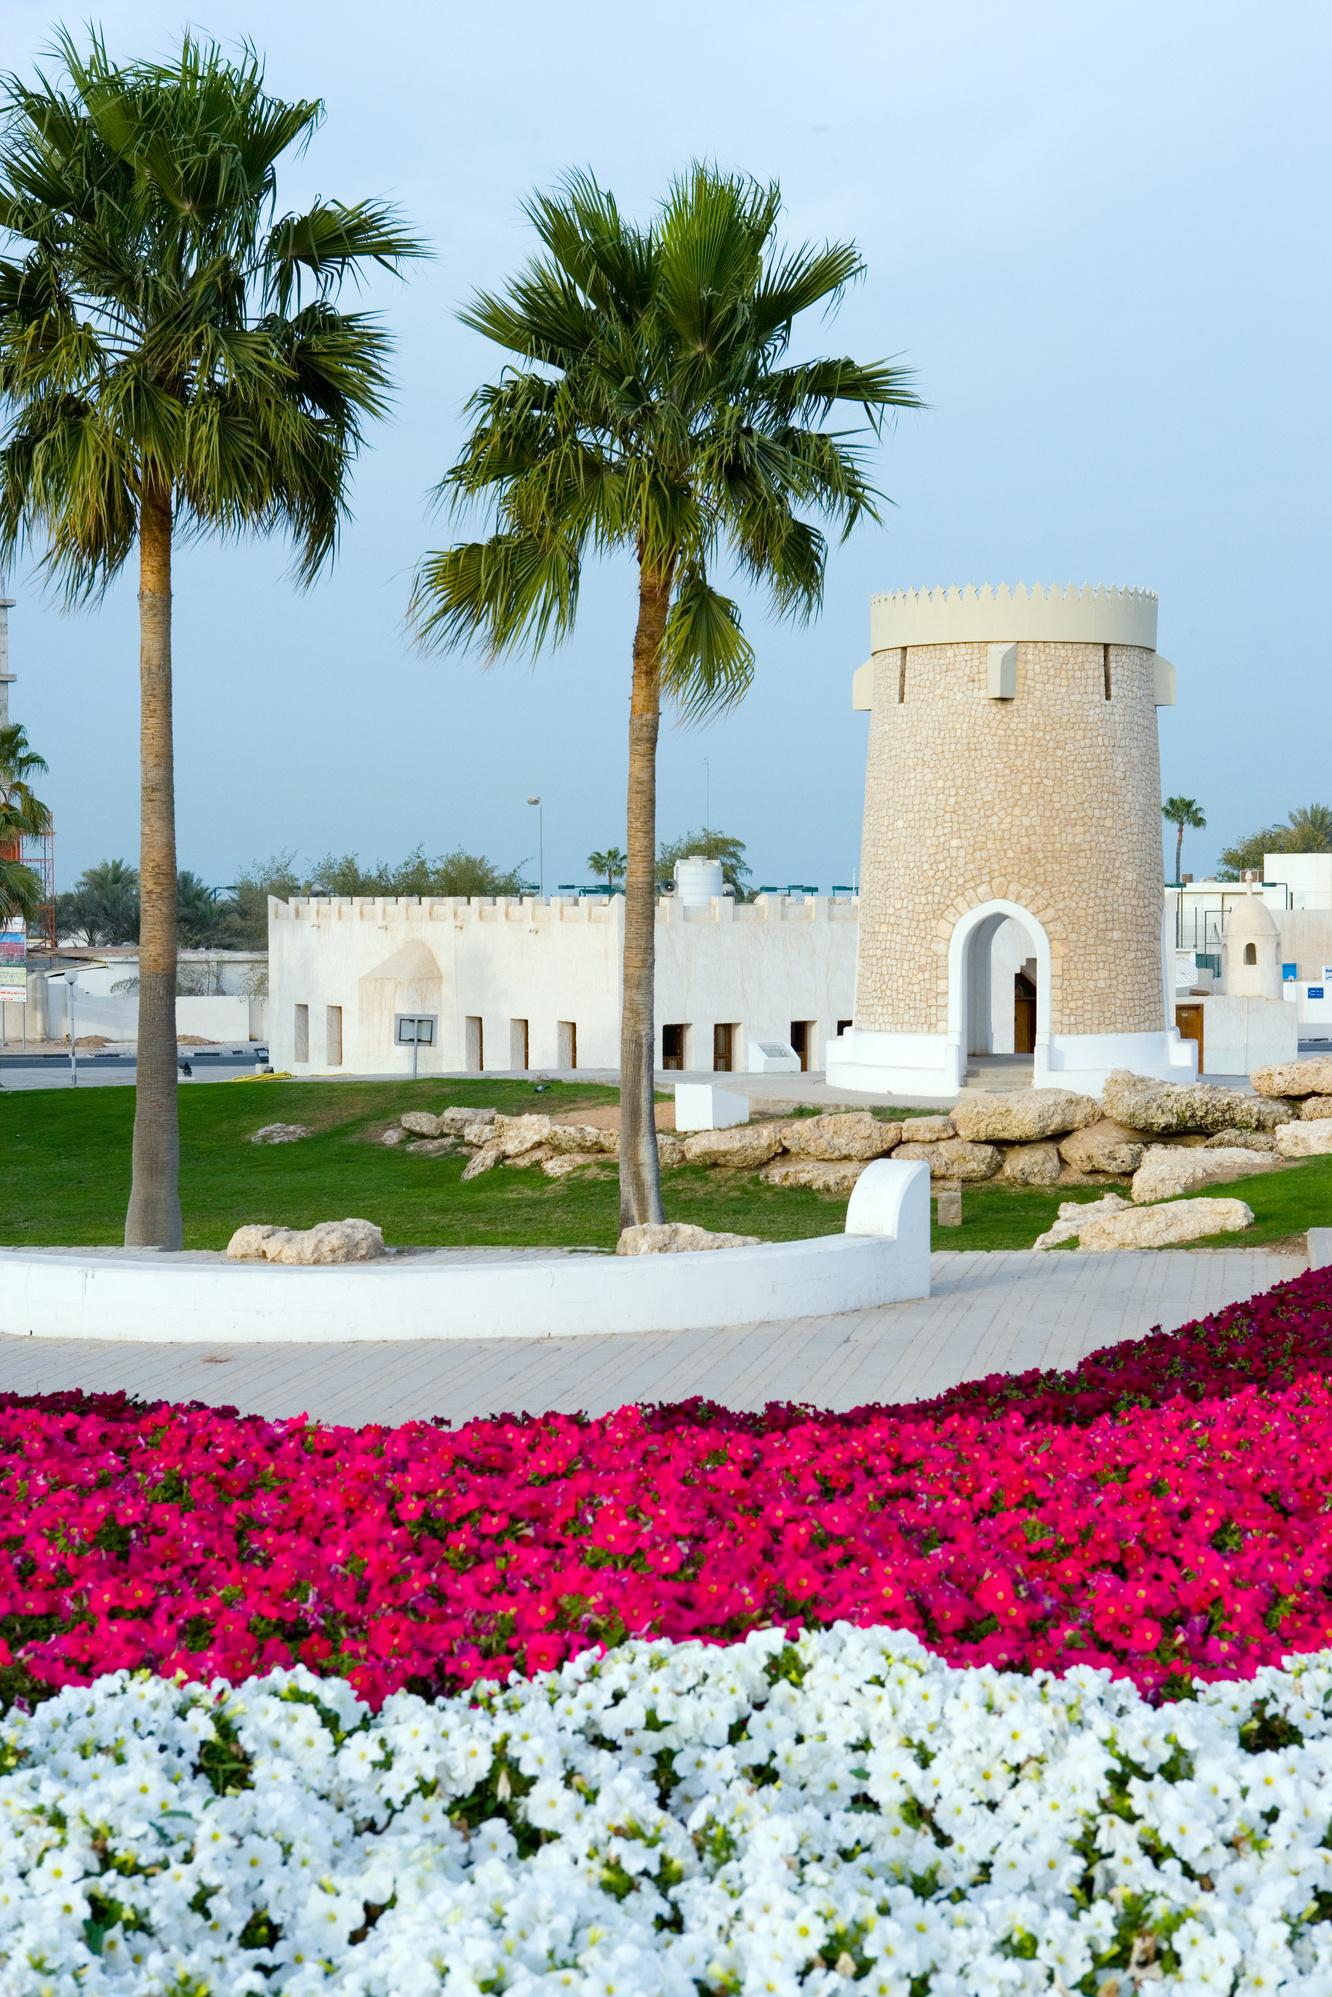
Doha
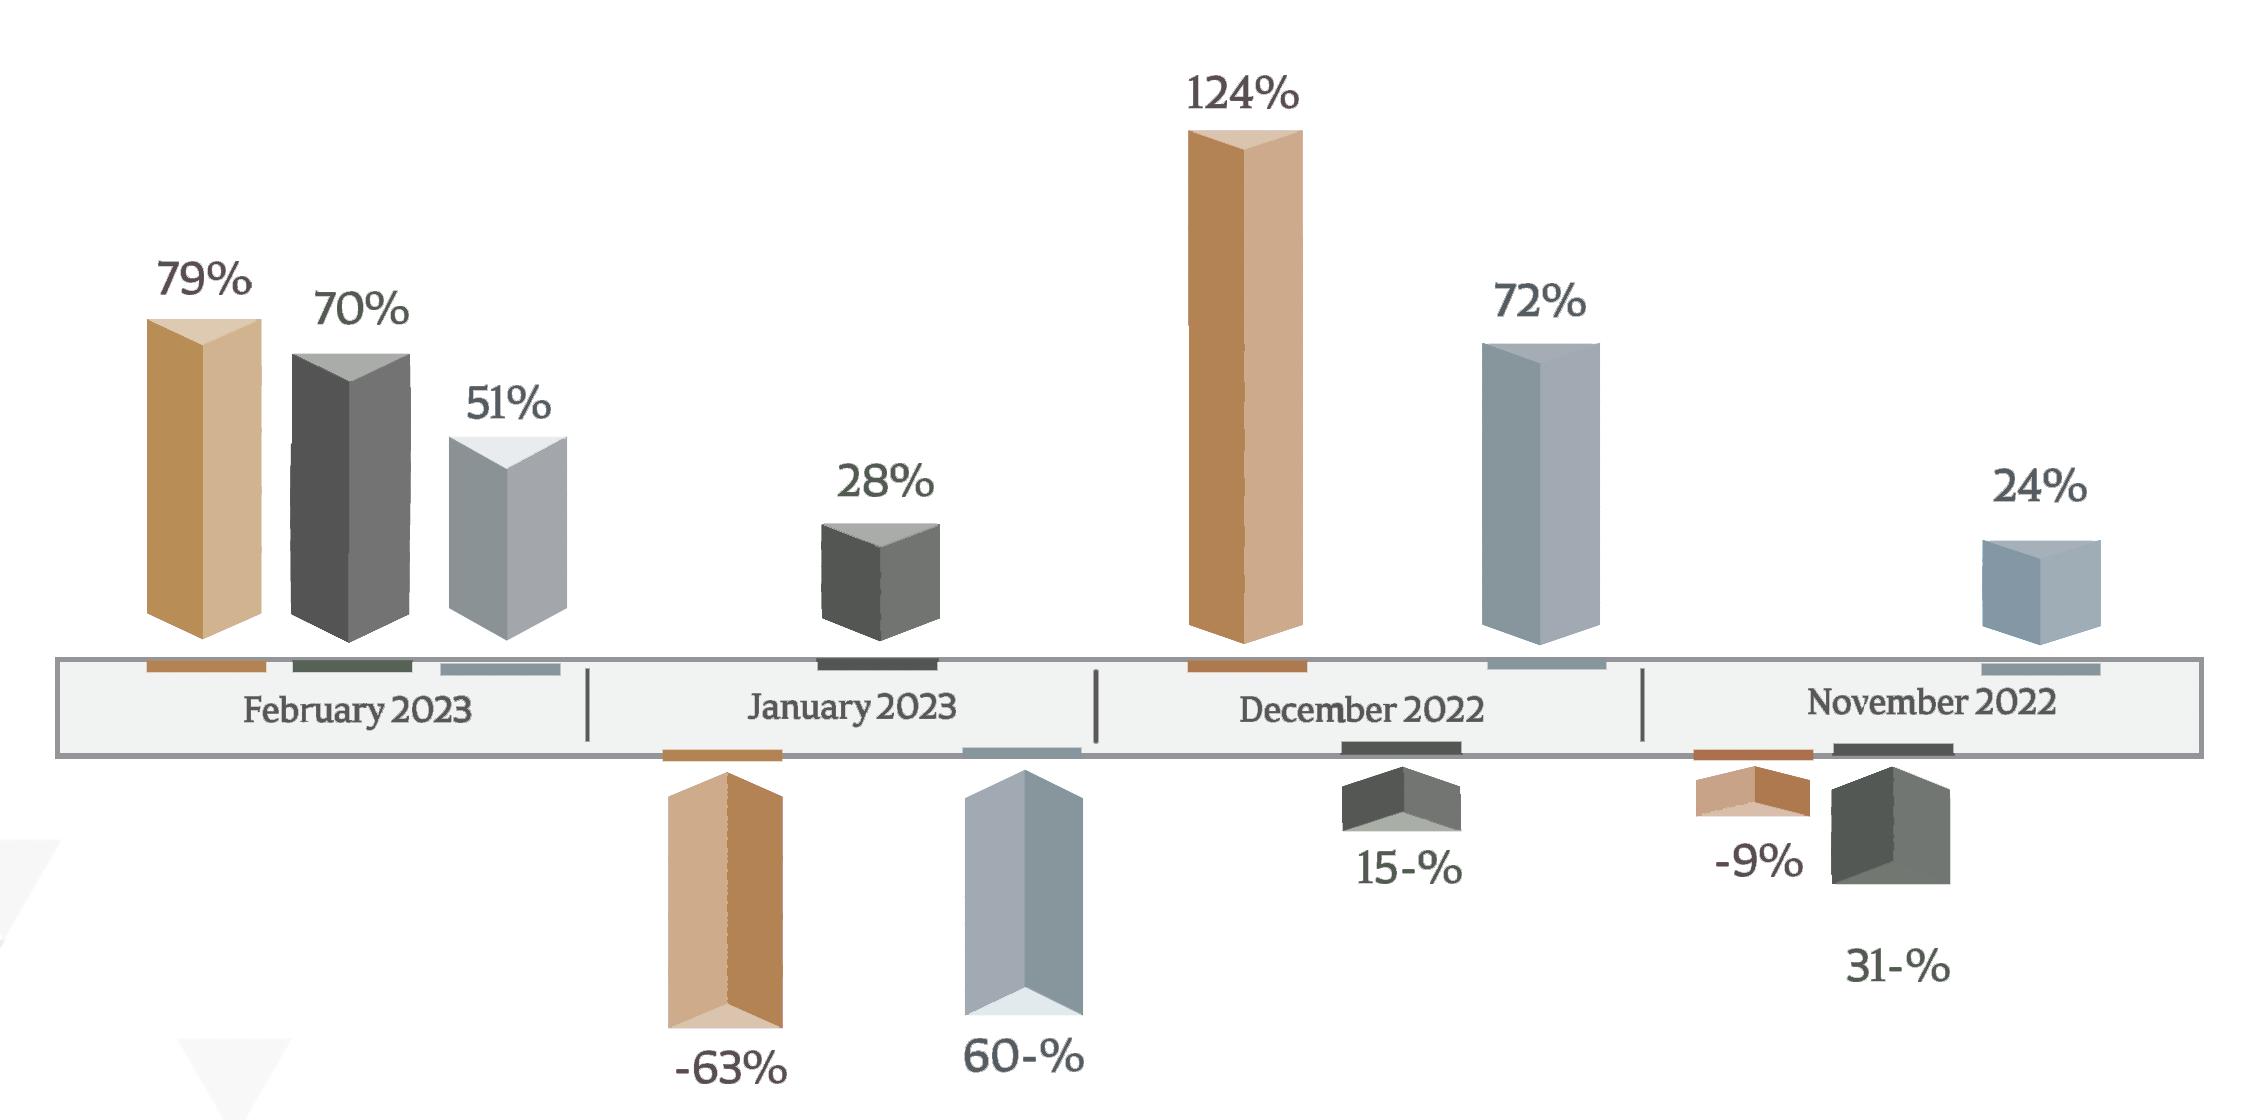
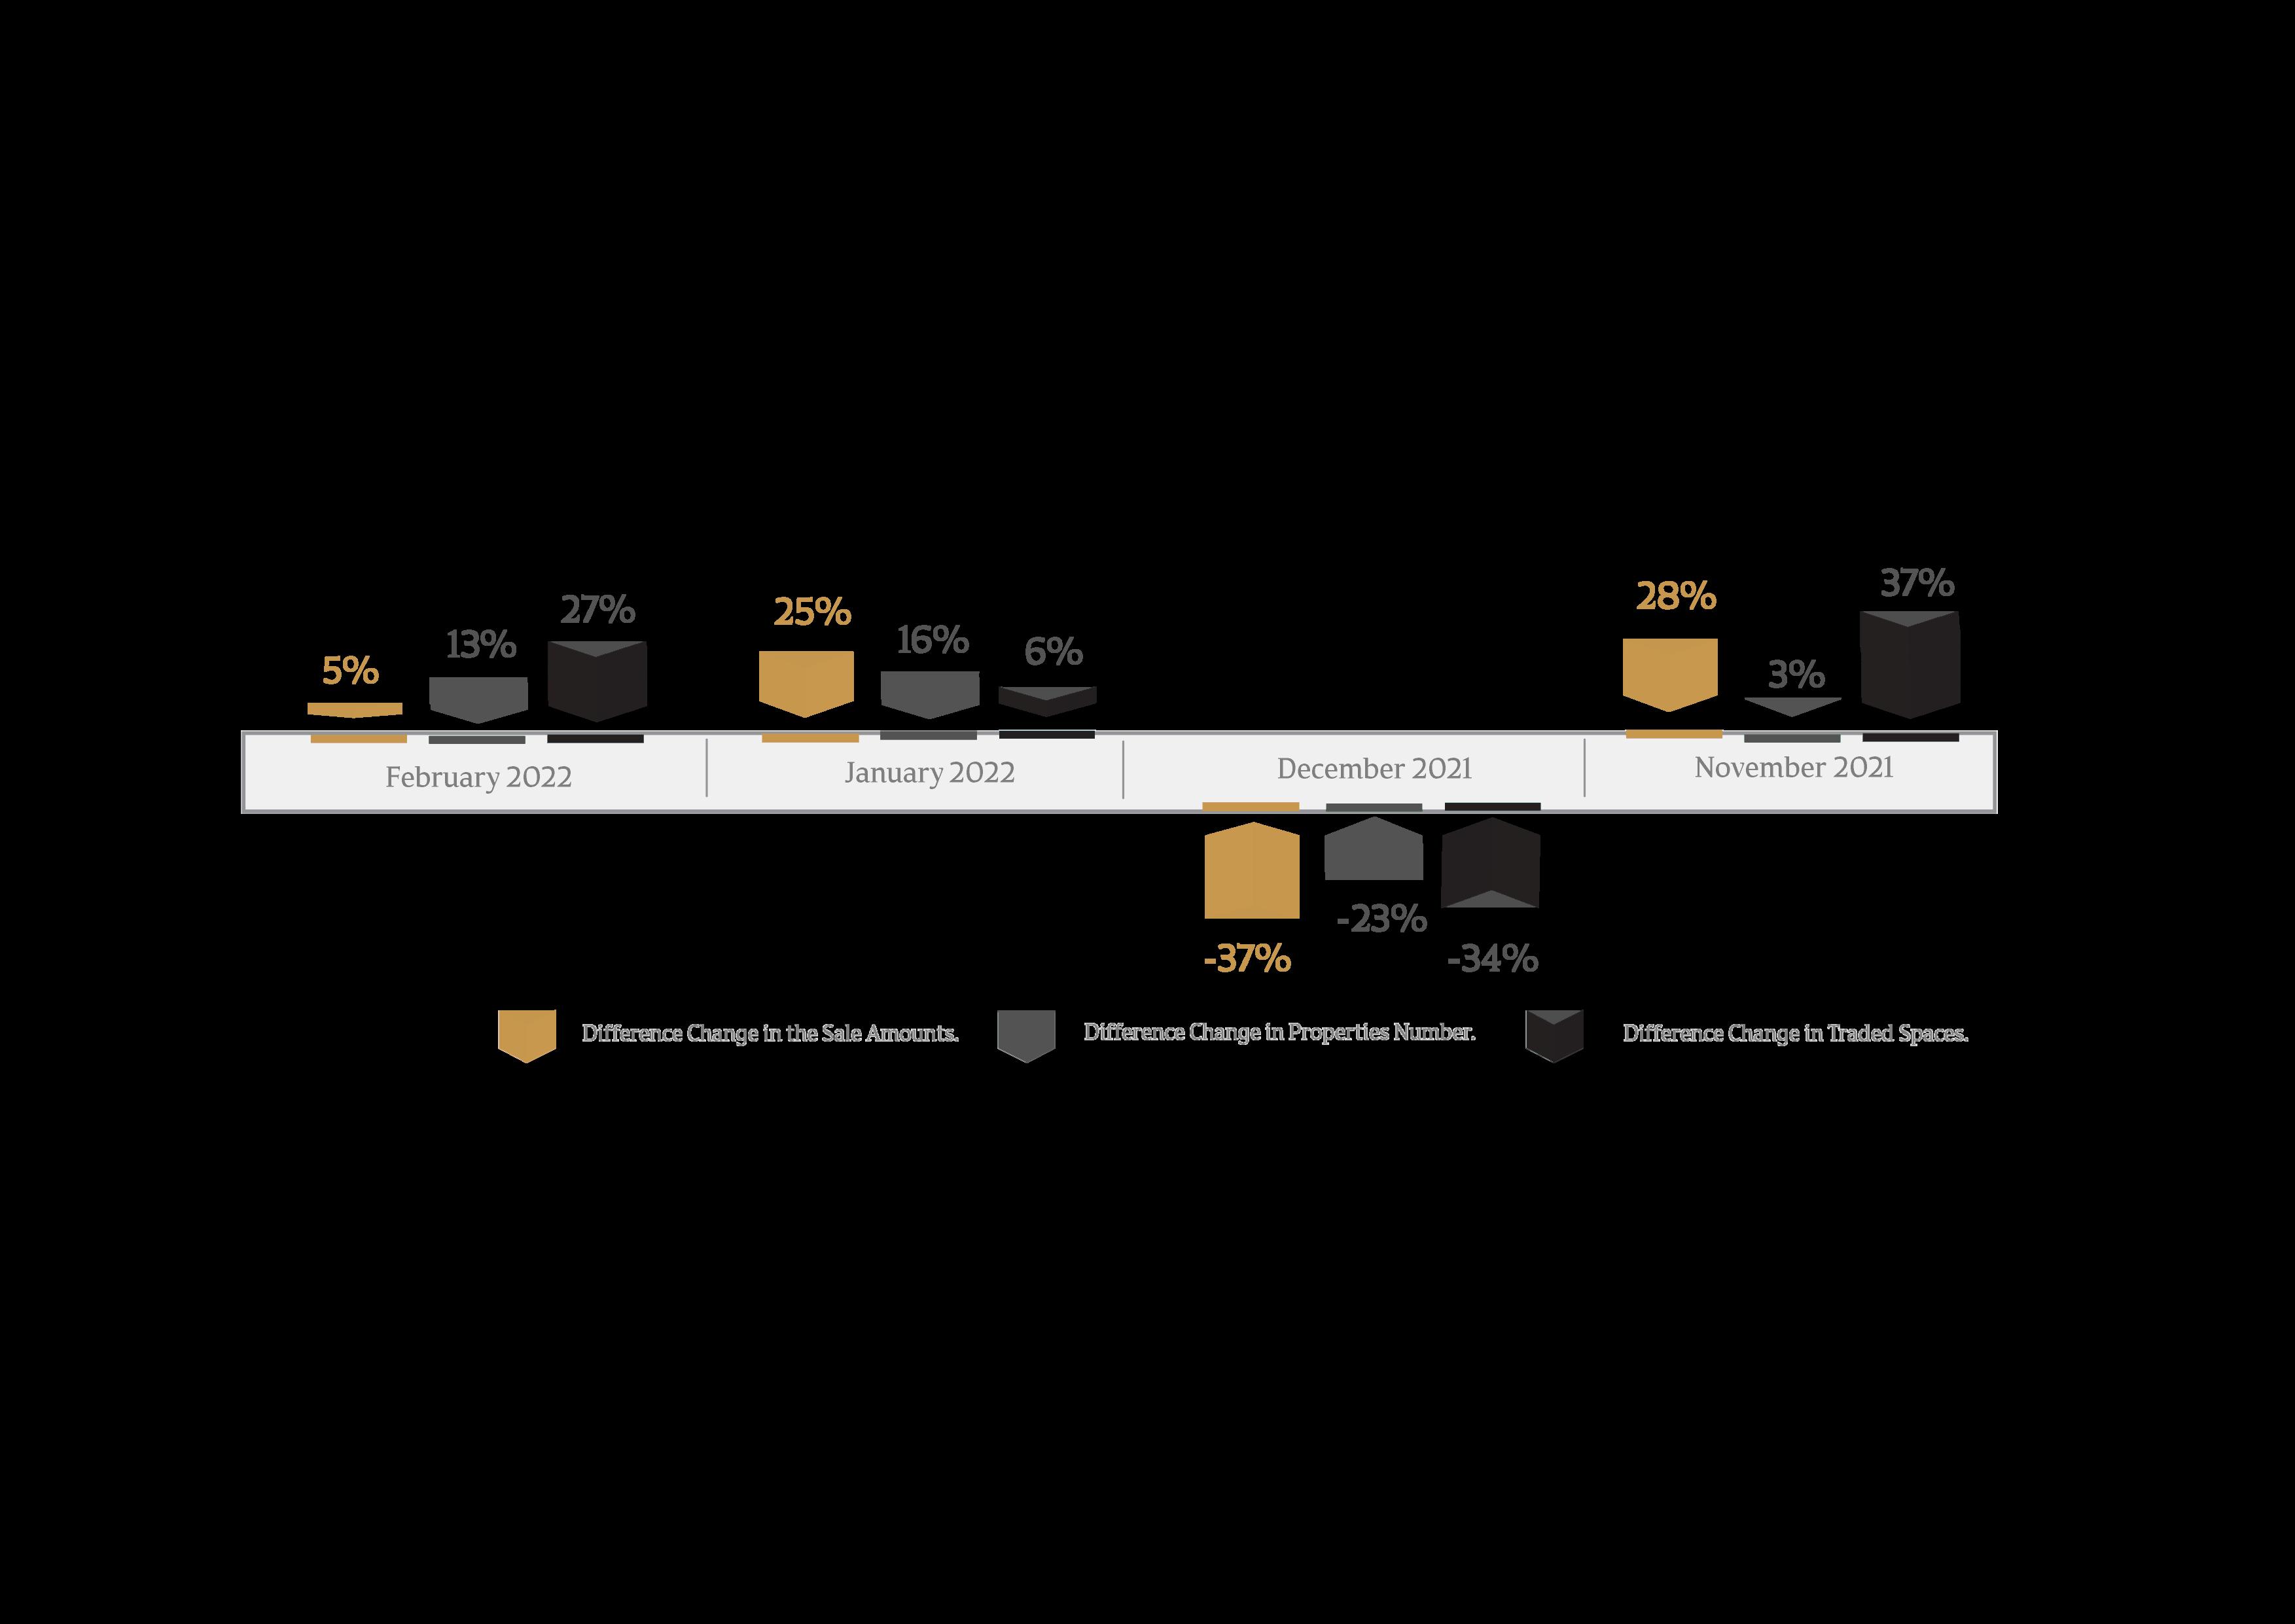
Difference in Performance Change Of the Real Estate Market
The Real Estate Bulletin I February 2023/ Ministry of Justice
Al-Rayyan Al Wakrah Al Shamal Umm Slal 947,788,289 591,552,178 194,611,364 142,740,491 80,410,439 23,850,000 Al Dhaayen Al Khor & Dhakira 59,605,402
The Real Estate Bulletin I February 2023/ Ministry of
Justice
Number of Traded Properties as per Municipalities
TradedSpaces
Percentage of Traded Spaces as per Municipalities Al Shamal 4%

Doha Municipality QR 947 788 289 Al Daayen Municipality QR 194,611,364 Al-Khor & Dhekra Municipality QR 59 605 402 Al Shamal Municipality QR 23,850,00 Umm Slal Municipality Al Sheehaniya Municipality QR 80,410,439 QR 0 Al Rayyan Municipality QR 591,552,178 Al Wakrah Municipality QR 142,740,491
16 32 0 101 90 58 57 28 AlRayyan 38% Doha 19% AlWakrah 17% AlDhaayen 11% UmmSlal 6% Al-Khor&DhekraMunicipality 5%
Al Rayyan Municipality has 38% of the total deals area, followed by Doha Municipality (17%) and Al Wakra Municipality (17%) The Real Estate Bulletin I February 2023/ Ministry of Justice The Real Estate Bulletin I February 2023/ Ministry of Justice
Al Rayyan Municipality sold the most real estate (27%), followed by Al Wakra (24%) and Doha and Al Dhaayen (15%)
Mortgage Trading Movement during February 2023
Al Rayyan and Doha Municipality recorded the highest number of mortgage transactions with (32) transactions, equivalent to (34.8%) of the total number of mortgaged real estate, followed by Umm Salal, Al Khor and AlThakhira Municipality with (11) transactions, equivalent to (12%) of the total number of mortgaged real estate

AlRayyan 27% AlWakrah 24% Doha 15% AlDhaayen 15% UmmSlal 8% AlKhorandAlDakhira 7%
The Real Estate Bulletin I February 2023/ Ministry of Justice TransactionsNumberIndicator The Real Estate Bulletin I February 2023/ Ministry of Justice Doha 348% AlRayyan 348% UmmSlal 12% AlKhorandDhekra 12% AlDhaayen 54% AlWakra 11%
Percentage of Number of Deals Traded as per Municipalities
Al shamal 4%
Al Sheehaniya Municipality has not registered any building sale transaction
Al Sheehaniya Municipality has not registered any sale transaction
AverageperSquareFootPricesforFebruary2023andJanuary2022 The Real Estate Bulletin I February 2023/ Ministry of Justice Doha Al Wakrah Umm Slal Al Dhaayen Al-Shamal Al Khor and Dakhira 1338 Al Rayyan 632 459 180 579 311 453 327 324 677 171 206 Doha Al Wakrah Umm Slal Al Dhaayen Al-Shamal Al Khor and Dakhira 942 Al Rayyan 492 546 200 499 385 420 407 247 438 293 152 273 February 2023
2023
January
Buildings Vacant Land Buildings Vacant Land 446 369 284 376 Al sheehaniya
Top Ten Properties
The Real Estate Bulletin I February 2023/ Ministry of Justice
List of the top (10) real estate in February 2023, including six (6) in Doha Municipality, four (4) in Al Rayyan Municipality
Al Waab Al Waab Al Waab 32,000,000 32,000,000 32,000,000 32,000,000 54,000,000 38,000,000 54,000,000 203,600,000 260,000,000 Al Rayyan Al Rayyan Al Rayyan Doha Doha Doha Doha Doha 33,800,000 Doha
The Ten Most Expensive Properties for February 2023
Al Waab Al Rayyan Al-Masila Riffa Al Sadd Al Sadd Al-Masila The
Pearl
Mortgage Trading Movement during February 2023

Doha Municipality had the most mortgages (3,631,400,183) QR, while Al Wakrah had the least (6,963,128 QR)
A study of the mortgage transaction movement index reveals that the percentage of mortgaged real estate is higher than the percentage of mortgage transaction amounts in all municipalities that recorded mortgage transactions, except for Doha
Percentage of the Number and Amounts of mortgage transactions as per Municipalities
3,631,400,183 403,582,290 156,177,889 59,970,000 Al Khor & Dhekra 55,565,661 6,963,128 Al Dhaayen Doha Al Wakrah The Real Estate Bulletin I February 2023/ Ministry of Justice
0 25 50 75 100 AlKhor&Dhekra UmmSlal AlWakrah AlDhaayen AlRayyan Doha 1 3% 1 1% 0 2% 3 6% 5 4% 94% 9 4% 34 8% 34 8% The Real Estate Bulletin I February 2023/ Ministry of Justice
The Mortgage Amounts Percentage The Properties Number Percentage Al Rayyan Umm Slal 1 4% 12% 84 2% 12%
Total of the top 10 mortgage Transactions
Total of Remaining Mortgage Transactions
Doha Municipality recorded 8 of the top 10 mortgaged properties in February 2023 The top ten real estate mortgage deals accounted for 83% of February's total value