Qatar Real Estate Market Report - April 2023

Page 1

The Real Estate Bulletin 4th Issue of April 2023

List of the Monthly Bulletin of the Properties Sold for April 2023

The Volume of the Real Estate Trading during April 2023

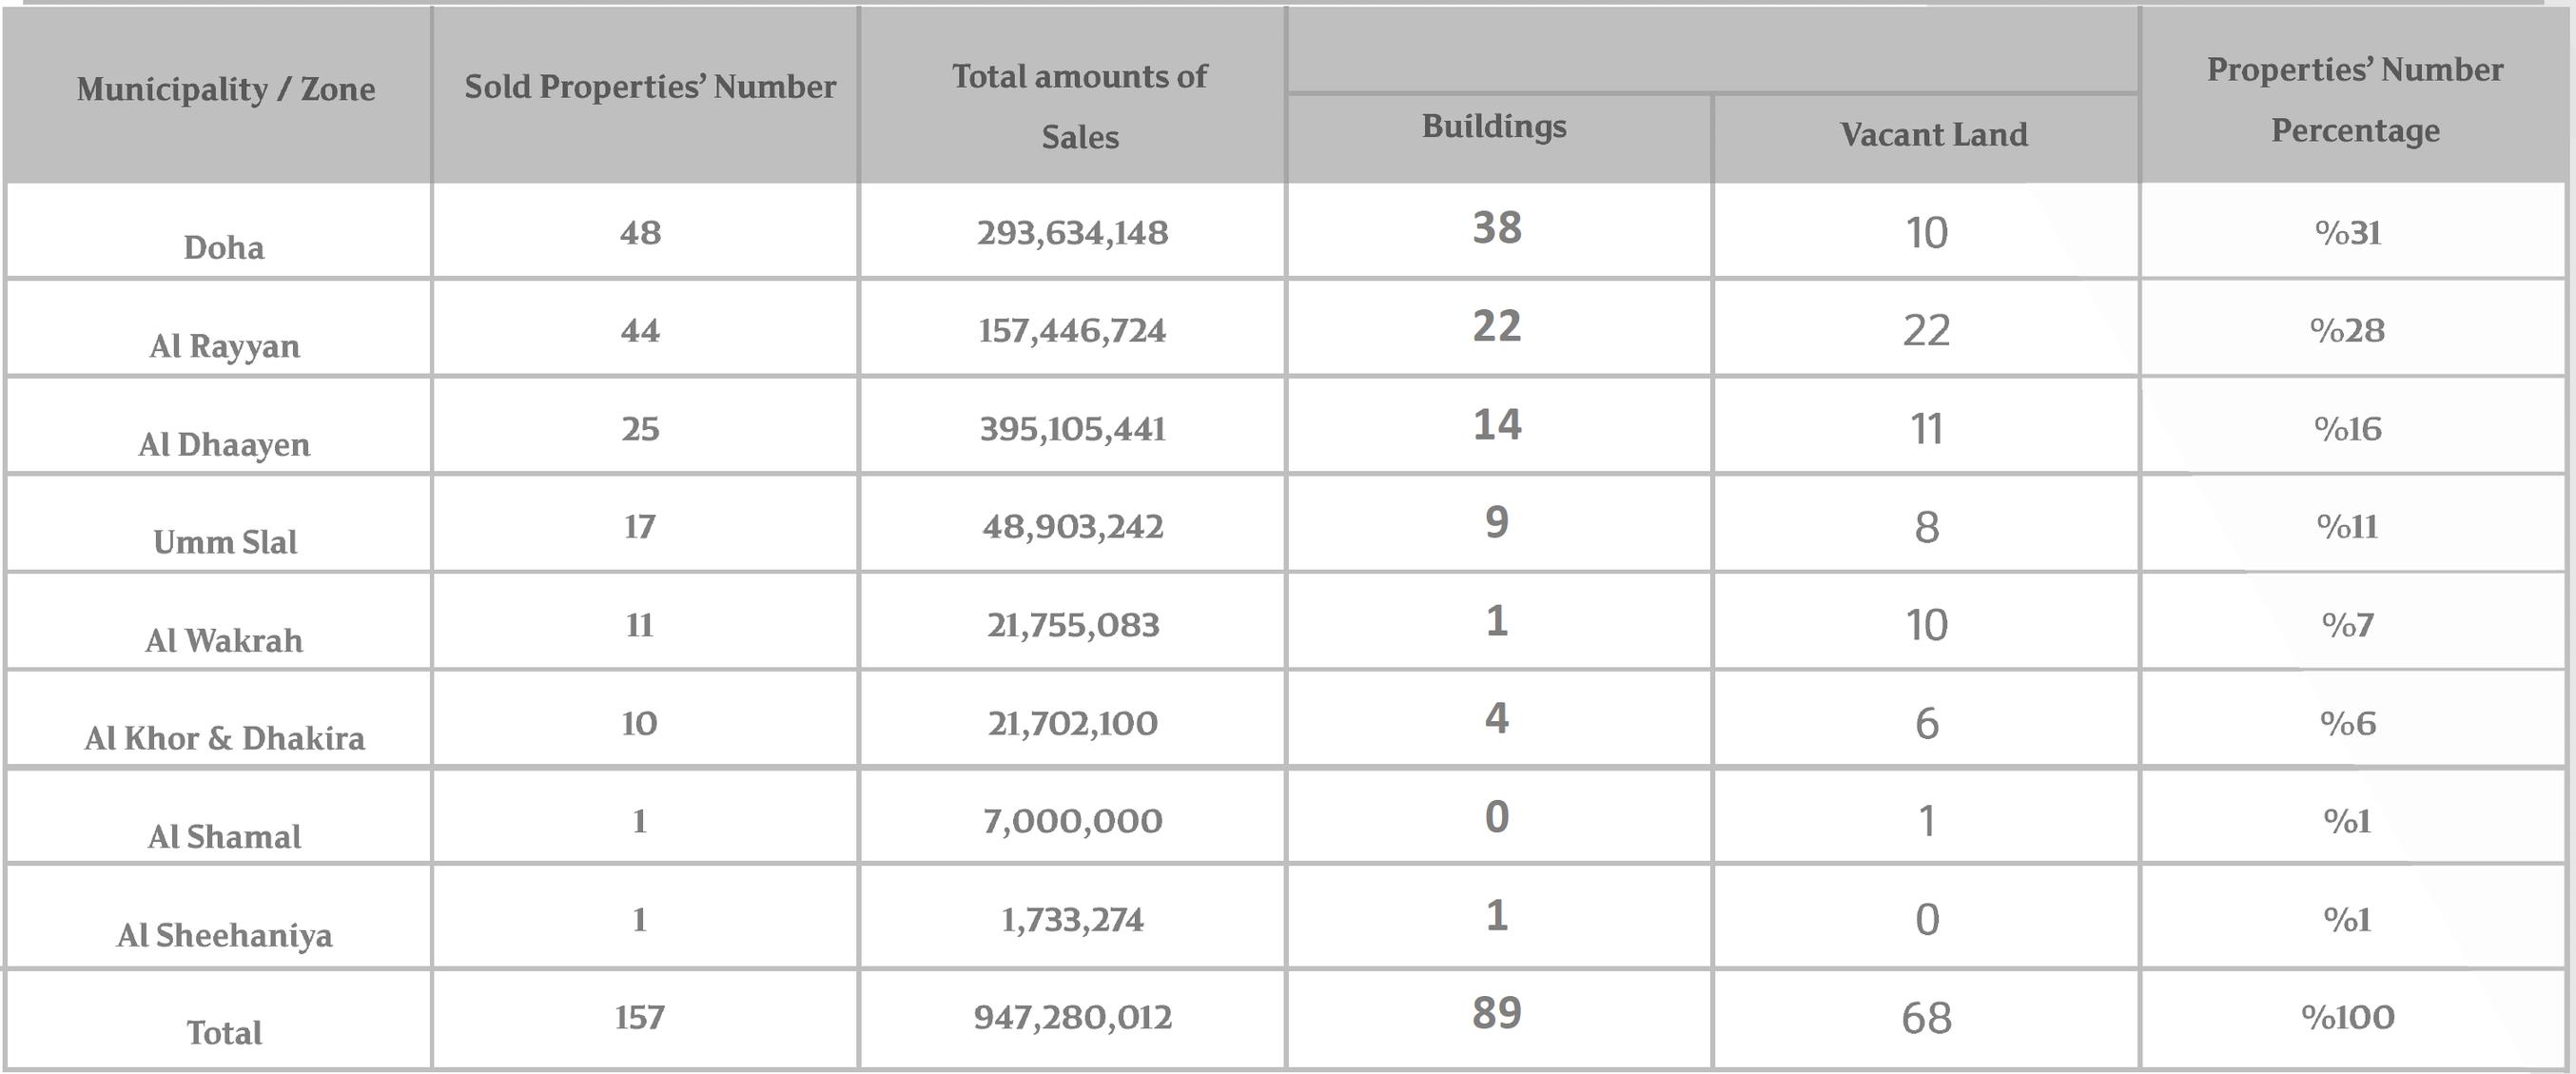
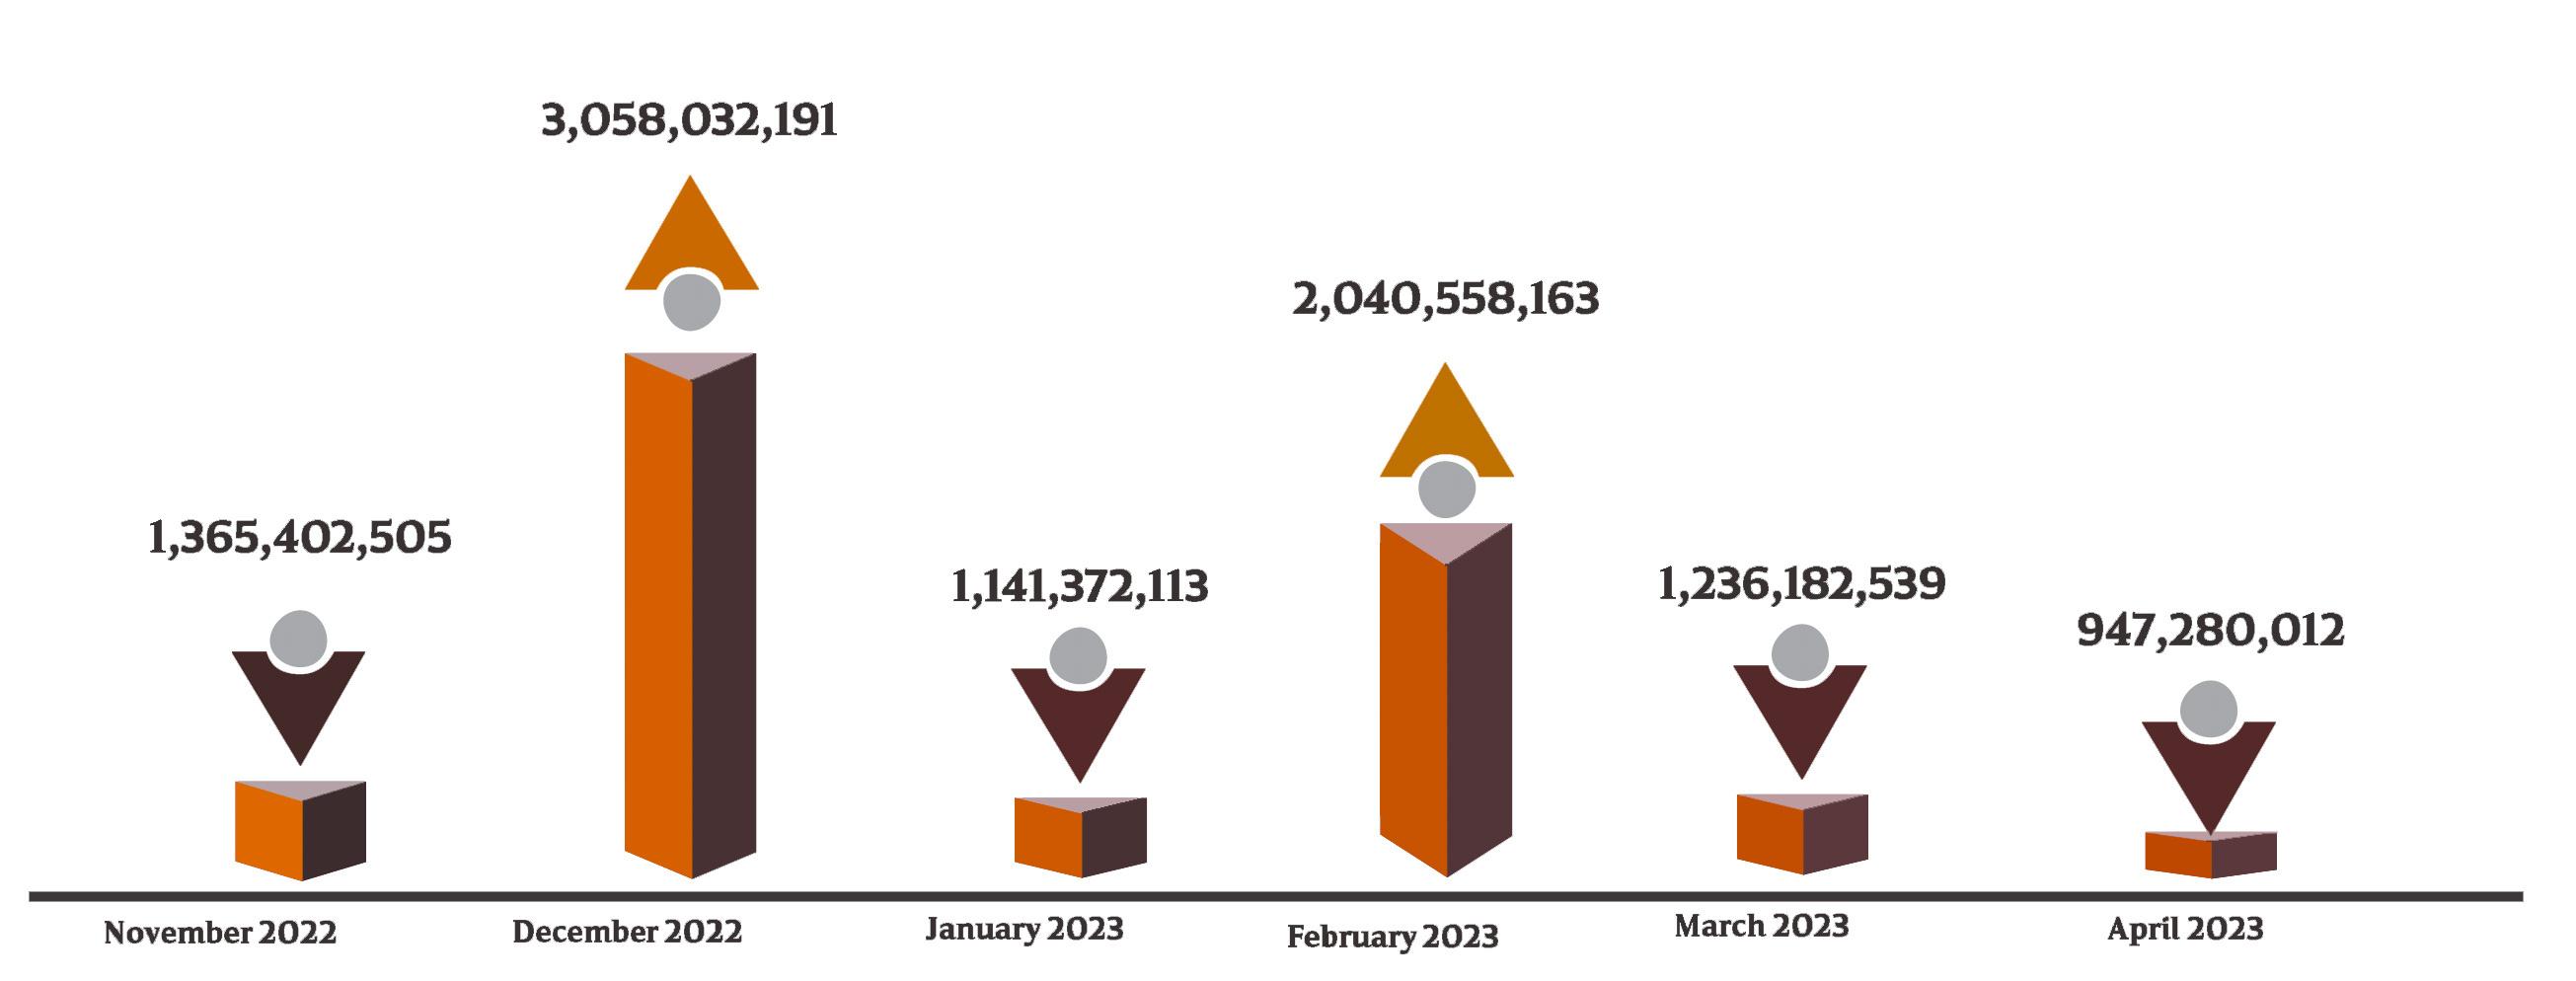
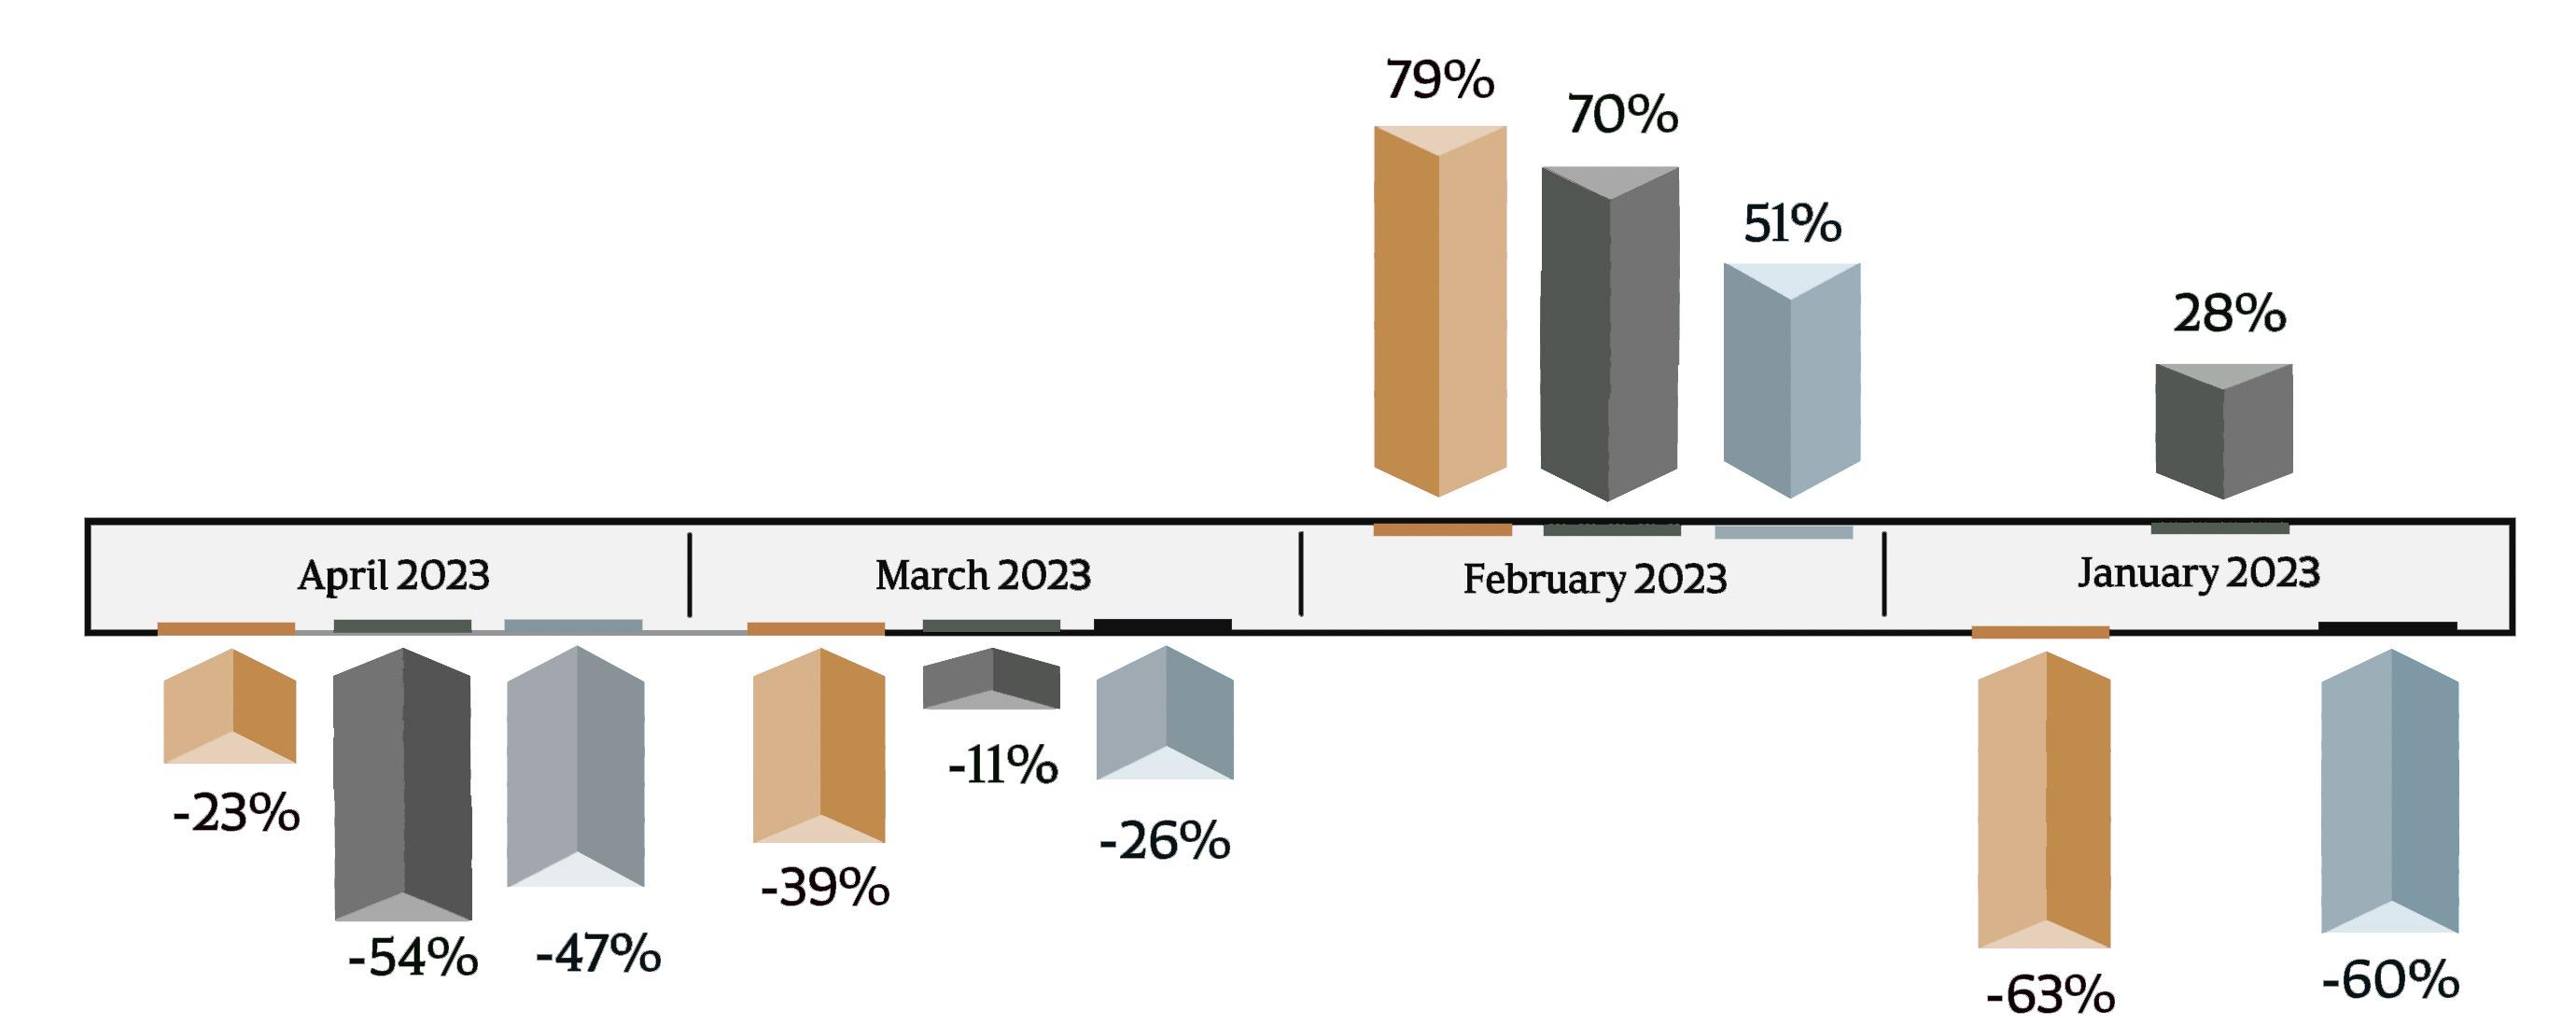
The real estate transactions index reached 947,280,012 QR for 157 transactions. In March 2023 the real estate index decreased by -54% While the traded areas index decreased by -47%.

The Real Estate Bulletin I April 2023/ Ministry of Justice

Real Estate Trading Volume During April 2023

The Deals Financial Value Index for April 2023

Al Dhaayen Municipality, Doha Municipality and then Al Rayyan Municipality are the most active in terms of financial value, with Al Dhaayen Municipality dealings reaching (395,105,441) QR, Doha Municipality ranking second with (293,634,148) QR, and Al Rayyan Municipality ranking third with (157,446,724) QR

Al Dhaayen
The Real
I April 2023/ Ministry of
Difference in Performance Change Of the Real Estate Market
Estate Bulletin
Justice
The
I April 2023/ Ministry of Justice Doha Umm Slal Al sheehaniya Al Wakrah 395,105,441 293,634,148 157,446,724 48,903,242 21,755,083 7,000,000 Al Rayyan Al Khor & Dhakira 21,702,100 Al Shamal 1,733,247
Real Estate Bulletin

TradedSpaces

Percentage of Traded Spaces as per Municipalities

Al Rayyan Municipality 30% of the trading movement, followed by Doha Municipality (25%) and Al Dhaayen Municipality with 21% of total transactions

Doha Municipality QR 293 634 148 Al Daayen Municipality QR 395,105,441 Al-Khor & Dhekra Municipality QR 21 702 100 Al Shamal Municipality QR 7,000,000 Umm Slal Municipality Al Sheehaniya Municipality QR 48,903, QR 1,733,274 Al Rayyan Municipality QR 157,446,724 Al Wakrah Municipality QR 21,755,083
1 17 1 44 11 48 25 10 AlRayyan 30% Doha 25% AlDhaayen 21% UmmSlal 11% AlWakrah 6% AlShamal 3%
Number of Traded Properties as per Municipalities
The Real Estate Bulletin I April 2023/ Ministry of Justice The Real Estate Bulletin I April 2023/ Ministry of Justice Al Khor & Dhakira 4%

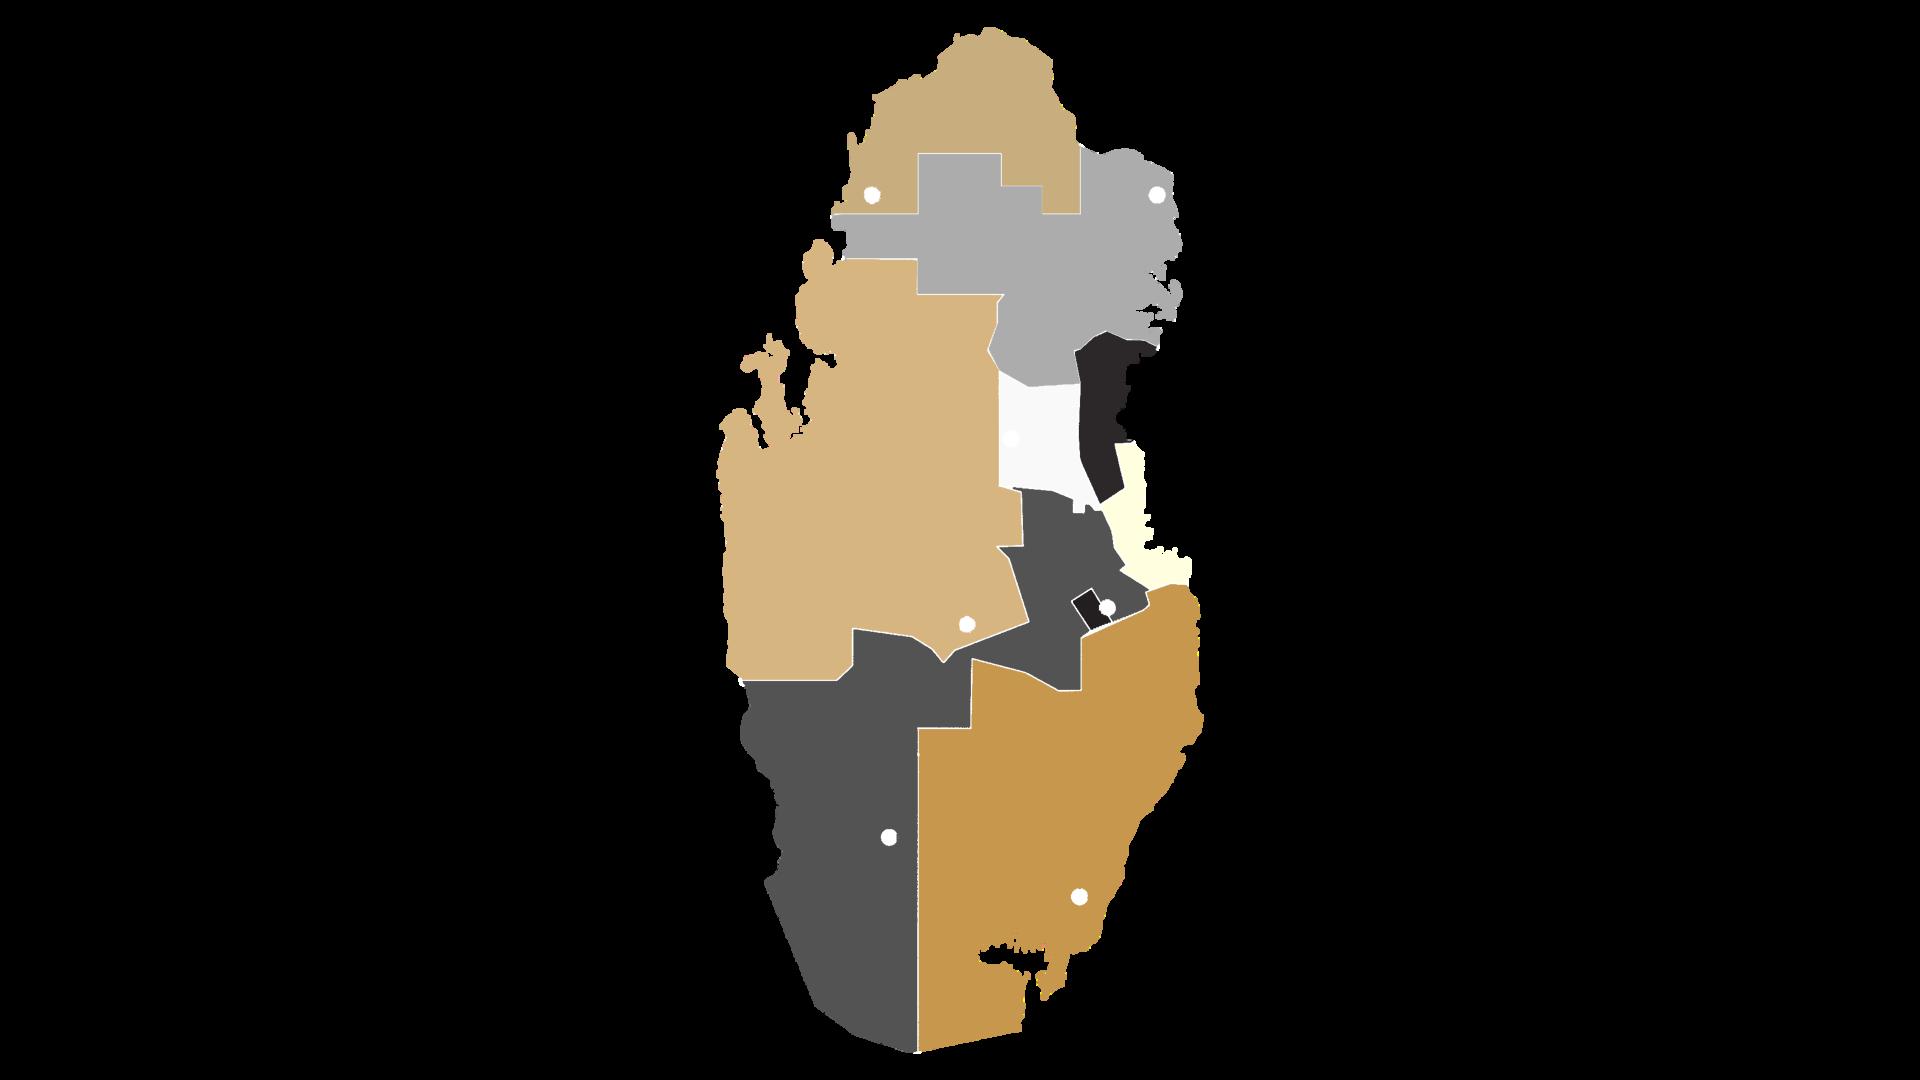
Doha Municipality sold the most real estate (30%), followed by Al Rayyan (28%) and Al Dhaayen Municipality by (16%)

Percentage of Number of Deals Traded as per Municipalities The Real Estate Bulletin I April 2023/ Ministry of Justice

Doha 30% AlRayyan 28% AlDhaayen 16% UmmSlal 11% AlWakrah 7% Al-Shamal 1%
TransactionsNumberIndicator Al Sheehaniya 1% Al Khor & Dhakira 6%

Al Shamal Municipality has not registered any building sale transaction

Al Sheehaniya Municipality has not registered any building sale transaction.

Al Sheehaniya Municipality has not registered any sale transaction

AverageperSquareFootPricesforApril2023andMarch2023 The Real Estate Bulletin I April 2023/ Ministry of Justice Doha Al Wakrah Umm Slal Al Dhaayen Al-Shamal Al Khor and Dakhira 864 Al Rayyan 487 331 274 403 335 473 252 297 716 171 217 Doha Al Wakrah Umm Slal Al Dhaayen Al-Shamal Al Khor and Dakhira 474 Al Rayyan 632 445 208 519 311 558 327 171 604 365 227 April 2023 March 2023
Buildings Vacant Land Buildings Vacant Land 212 324 Al sheehaniya 700 151 Al Sheehaniya 106 142 391 234 267 297 151

Top Ten Properties

List of the top (10) real estate in April 2023, including six (6) in Doha Municipality and (2) properties in Al Rayyan and Al Dhaayen Municipalities

Doha Al Rayyan Doha 10,900,000 12,000,000 12,350,000 16,133,926 20,000,000 18,500,000 22,299,779 36,000,000 312,305,812 Al Waab Freej Bin Omram Ain Khaled Freej Bin Omran Al Waab Riffa Al Mansoura Al Kharayej 18,000,000 Madinat Khalifa North
The Ten Most Expensive Properties for April 2023 The Real Estate Bulletin I April 2023/ Ministry of Justice
Doha Legtaifiya Doha Al Dhaayen Doha Al Rayyan Al Dhaayen

Mortgage Trading Movement during April 2023

Al Wakrah Municipality had the most mortgages (1,331,058,537) QR, while Al Khor & Dhakira had the least (2,822,306 QR)

A study of the mortgage transaction movement index reveals that the percentage of mortgaged real estate is higher than the percentage of mortgage transaction amounts in all municipalities that recorded mortgage transactions, except for Al Wakrah Municipality

Percentage of the Number and Amounts of mortgage transactions as per Municipalities

1,331,058,537 433,084,348 347,719,747 114,025,000 Al Rayyan 4,768,000 2,822,306 Al Dhaayen Al Wakrqh The Real Estate Bulletin I April 2023/ Ministry of Justice
0 20 40 60 AlKhor&Dhakira UmmSlal AlWakrah AlDhaayen AlRayyan Doha 0 2% 18 6% 59 6% 15 6% 19 4% 5 1% 20 9% 39 5% The Real Estate Bulletin I April 2023/ Ministry of Justice
The Mortgage Amounts Percentage The Properties Number Percentage Doha Umm Slal 0 1% 4 7% 2 3% Al Khor & Dhekra 14%

Total of the top 10 mortgage Transactions

Total of Remaining Mortgage Transactions

The total percentage of the Top Mortgage Transactions

The Real Estate Bulletin I April 2023/ Ministry of Justice

Doha Municipality recorded 5 of the top 10 mortgaged properties in April 2023 The top ten real estate mortgage deals accounted for 96% of April's total value

Real Estate Trading Movement - The Pearl and Al Kassar Area

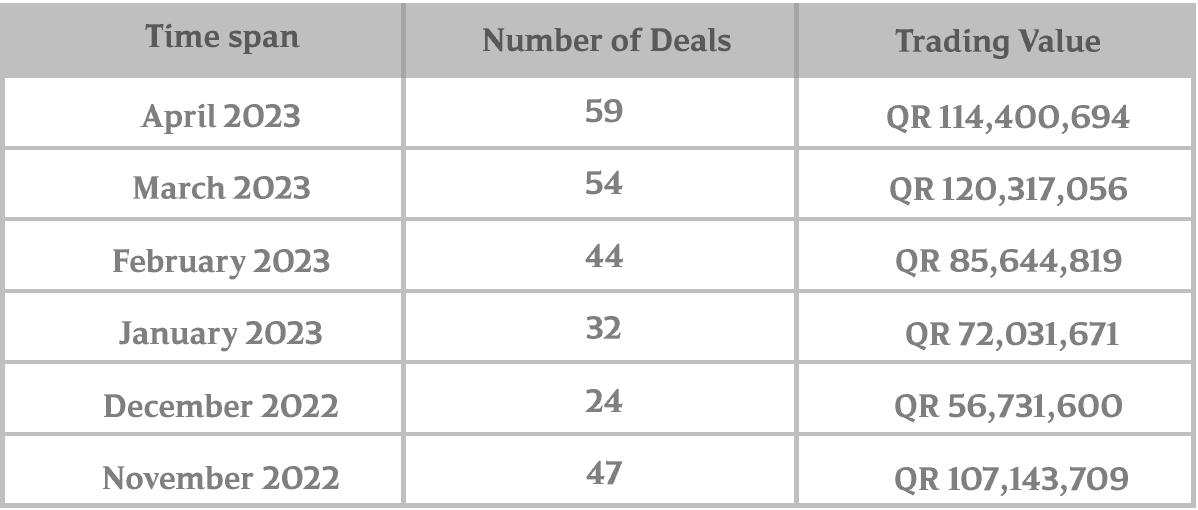
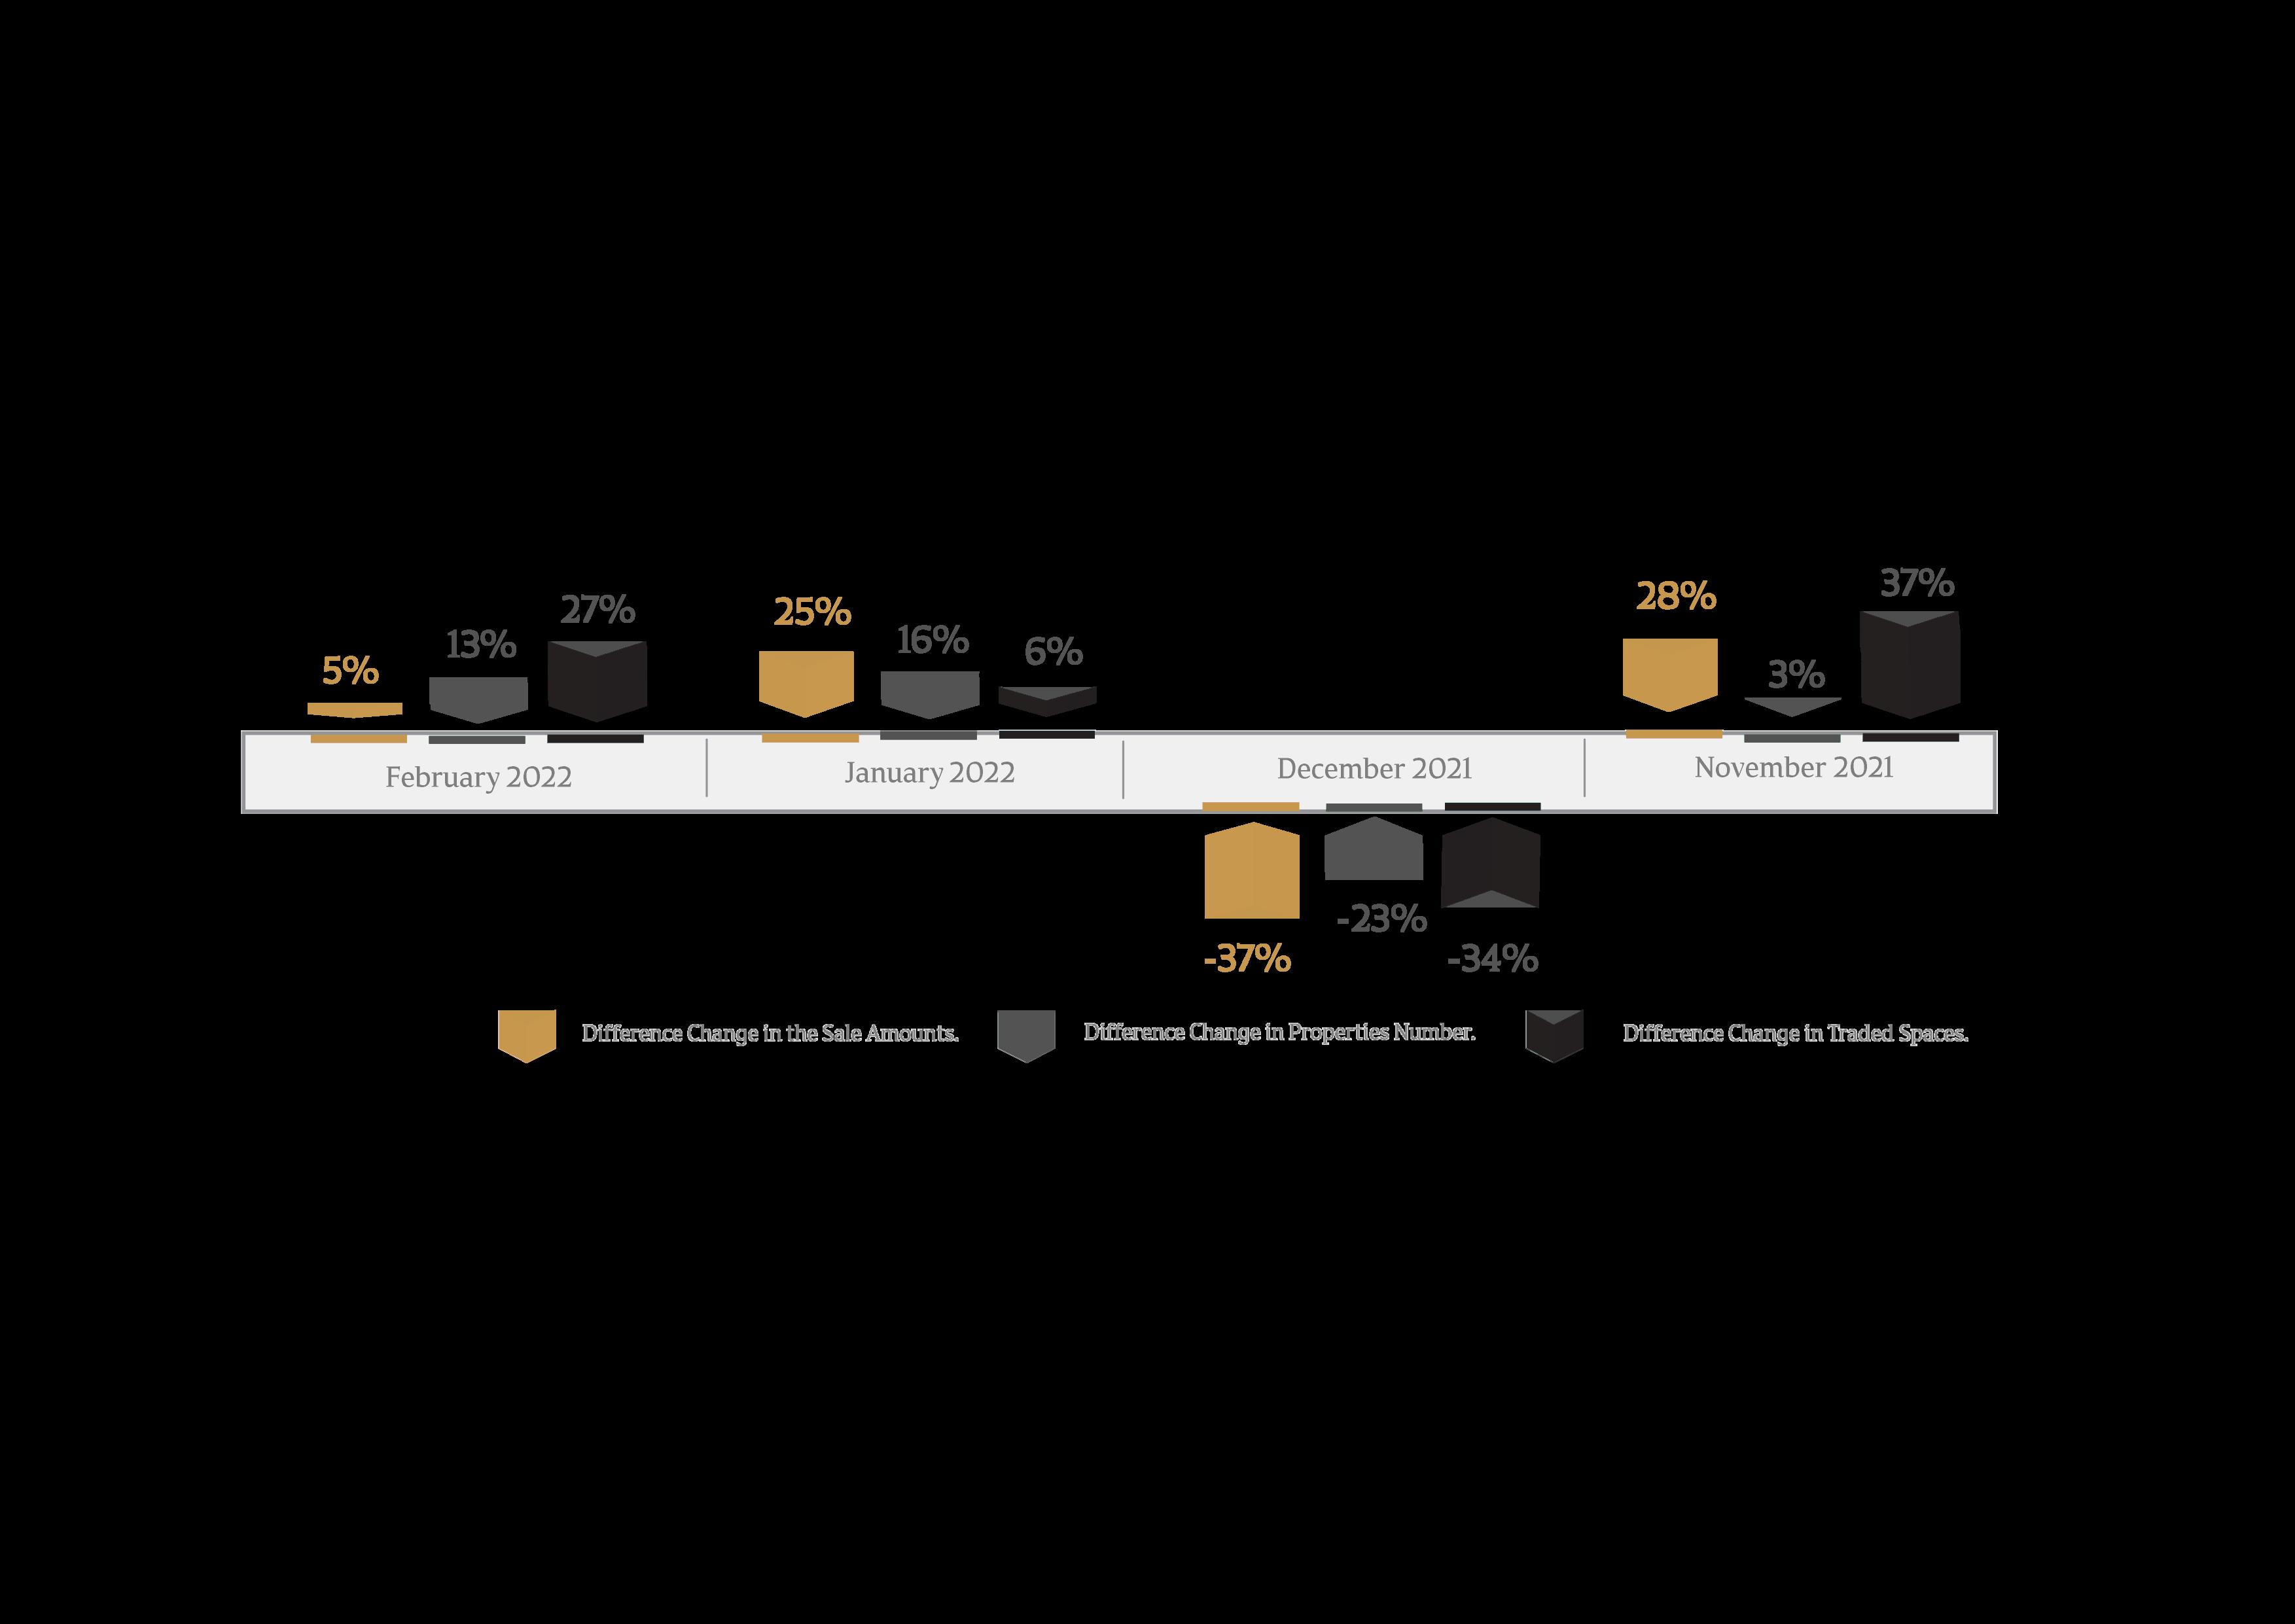
Comparison of Residential Units Trading Indicators April 2023 had a decrease in The Pearl and Al Kassar Area than March 2023 59 residential unit transactions totaled 114,400,694 QR

The Real Estate Bulletin I April 2023/ Ministry of Justice

MortgageTradingMovementduringApril2023
4% 96%
Email: contacts@thepearlgastes.com
Issuu converts static files into: digital portfolios, online yearbooks, online catalogs, digital photo albums and more. Sign up and create your flipbook.