

Bulletin
October
The Real Estate
10th Issue of
2022
List of the Monthly Bulletin of the Properties Sold for October 2022
The Real Estate Bulletin I October 2022/ Ministry of Justice
The Volume of the Real Estate Trading during October 2022
The Real Estate Bulletin I October 2022/ Ministry of Justice
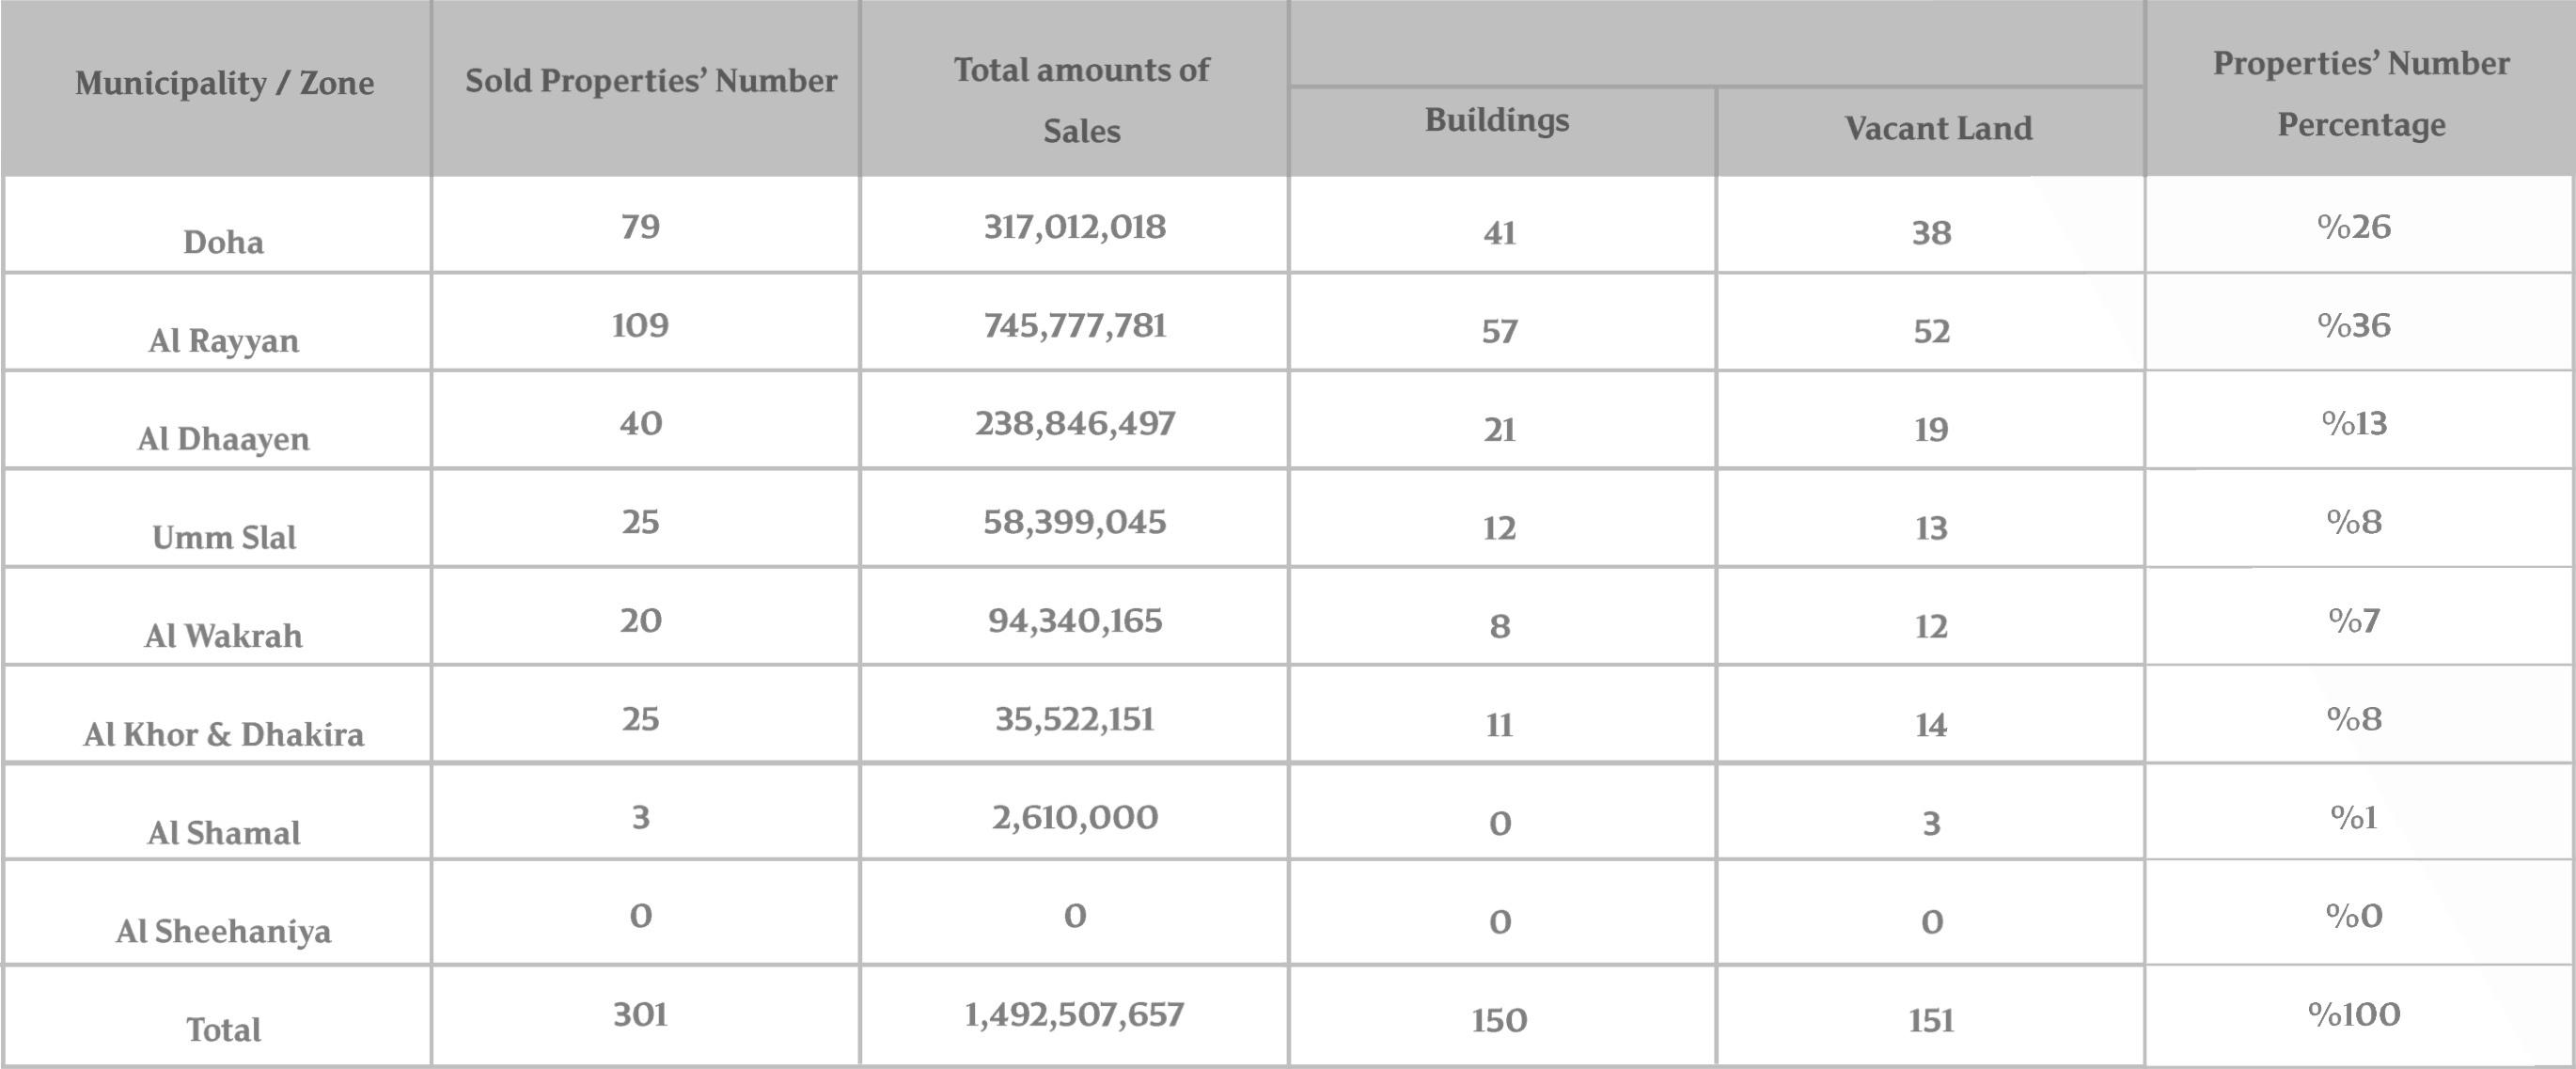
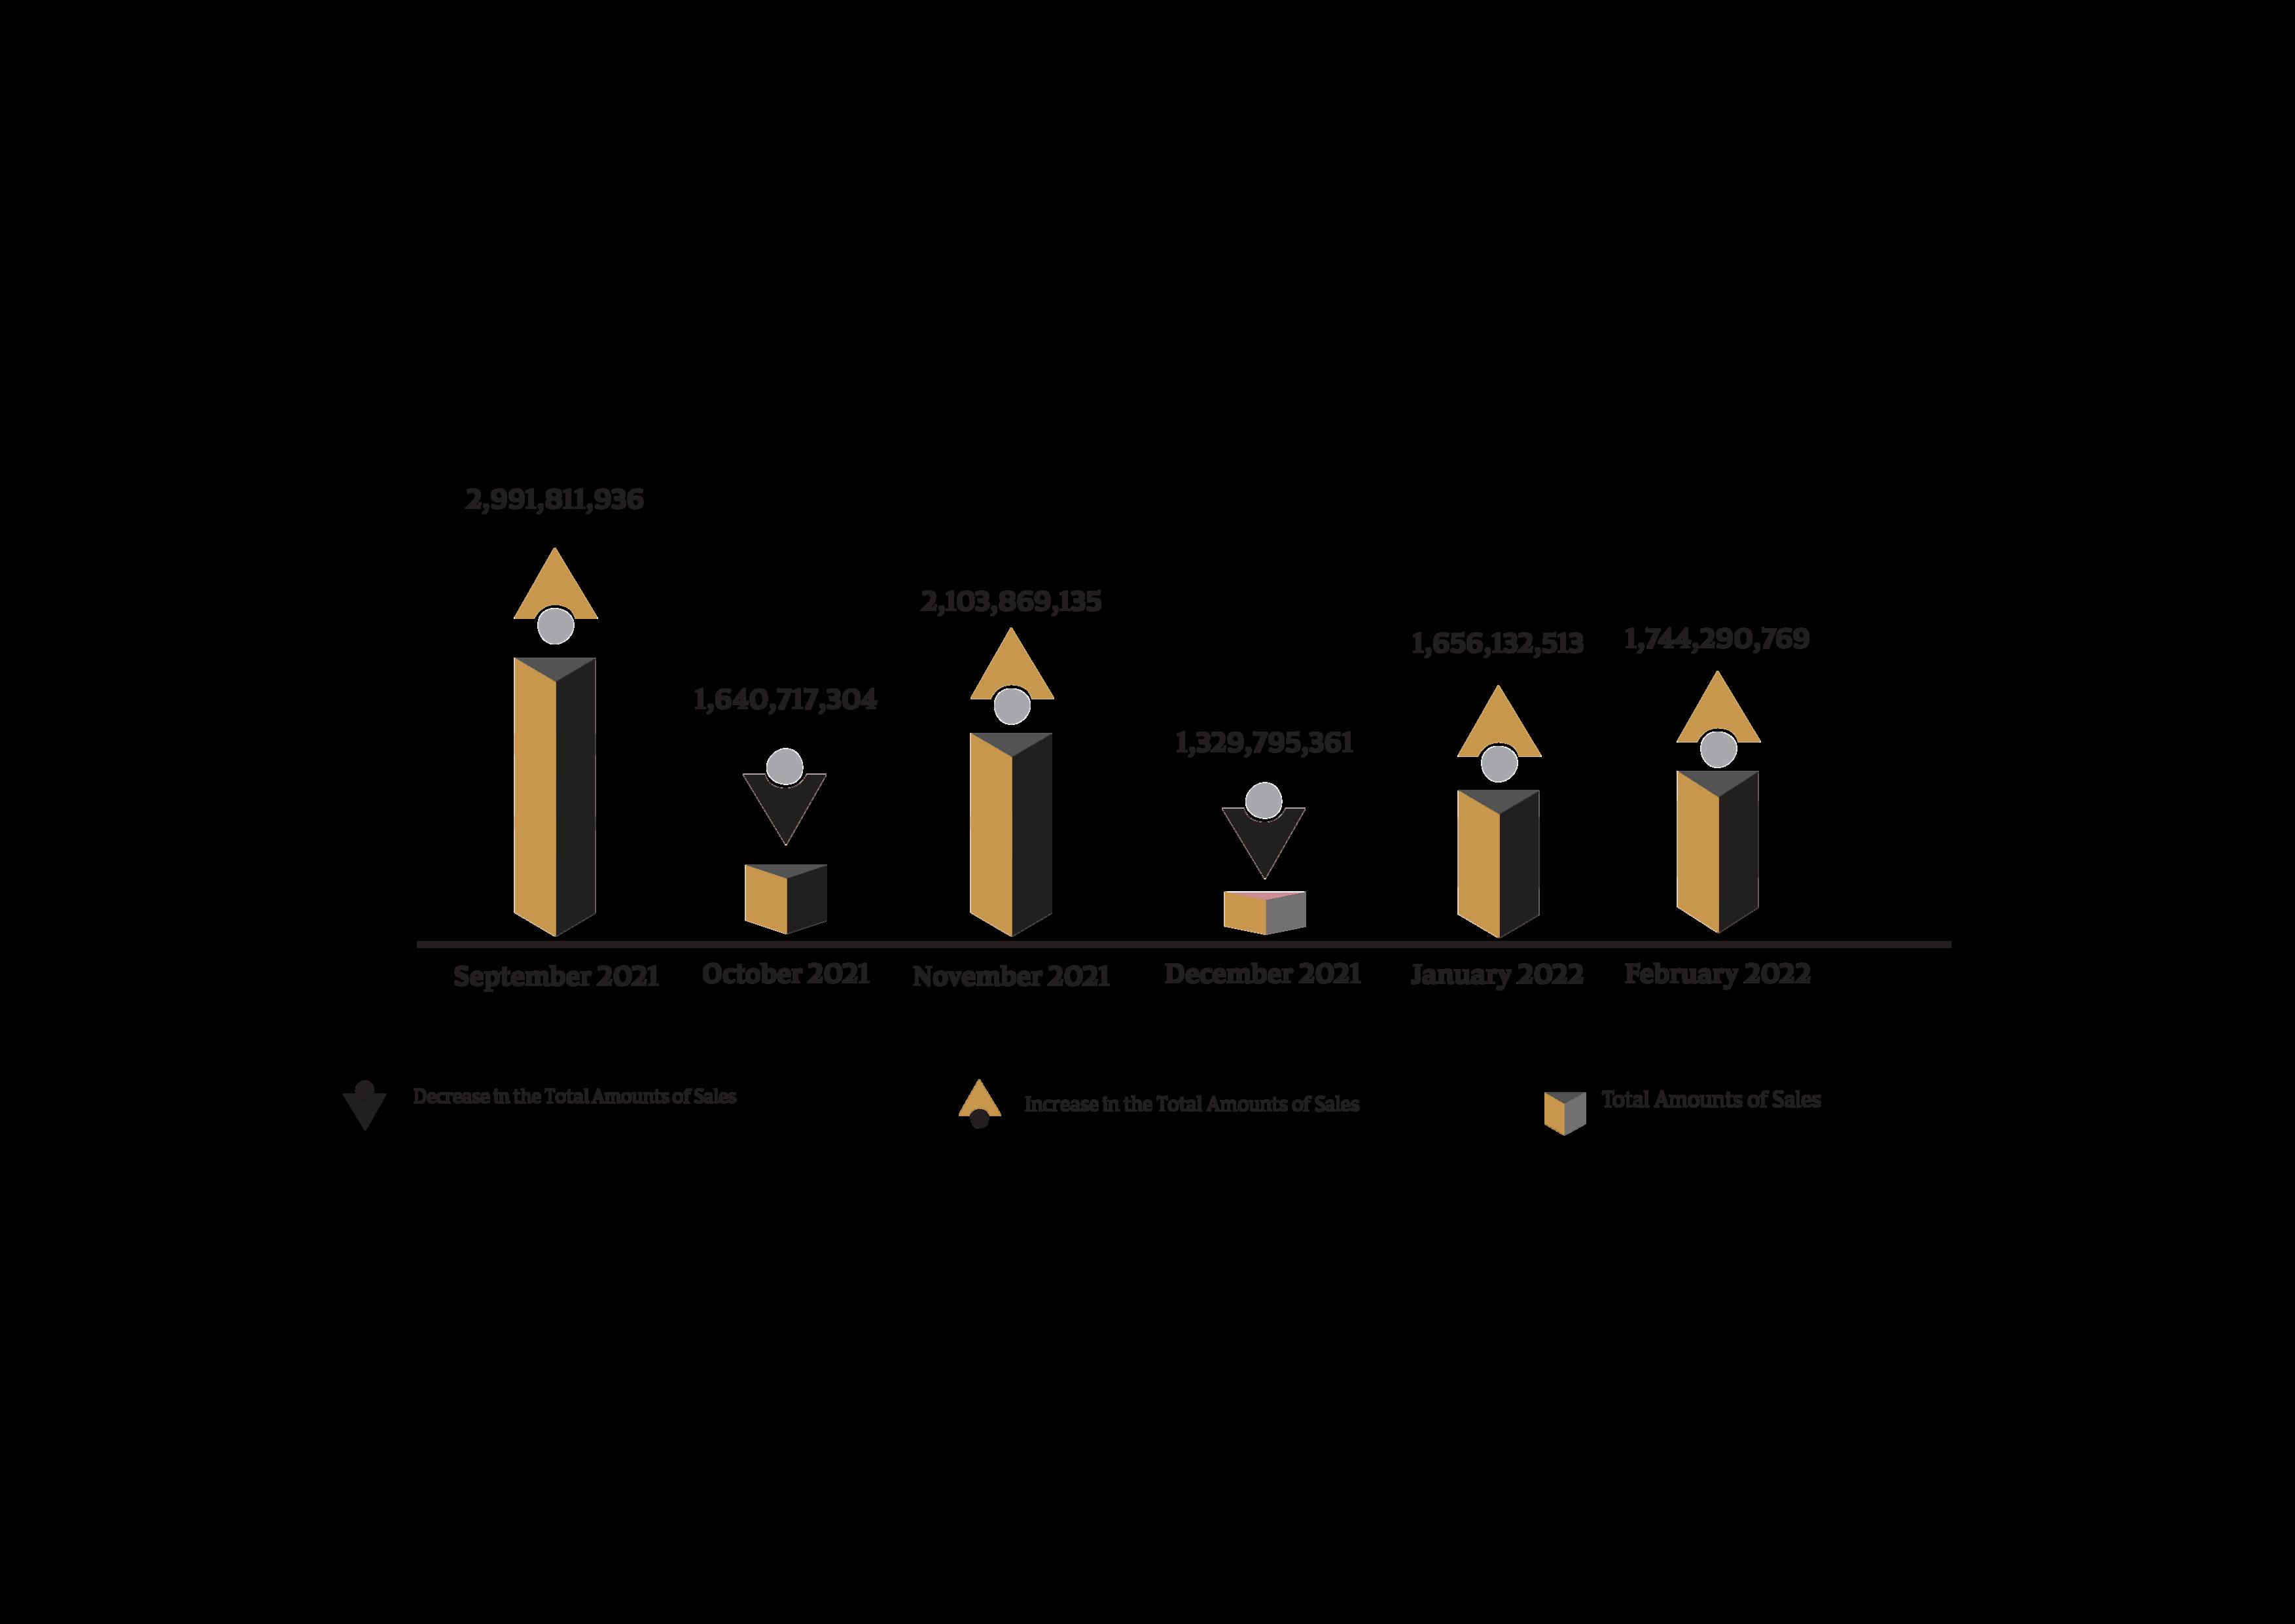
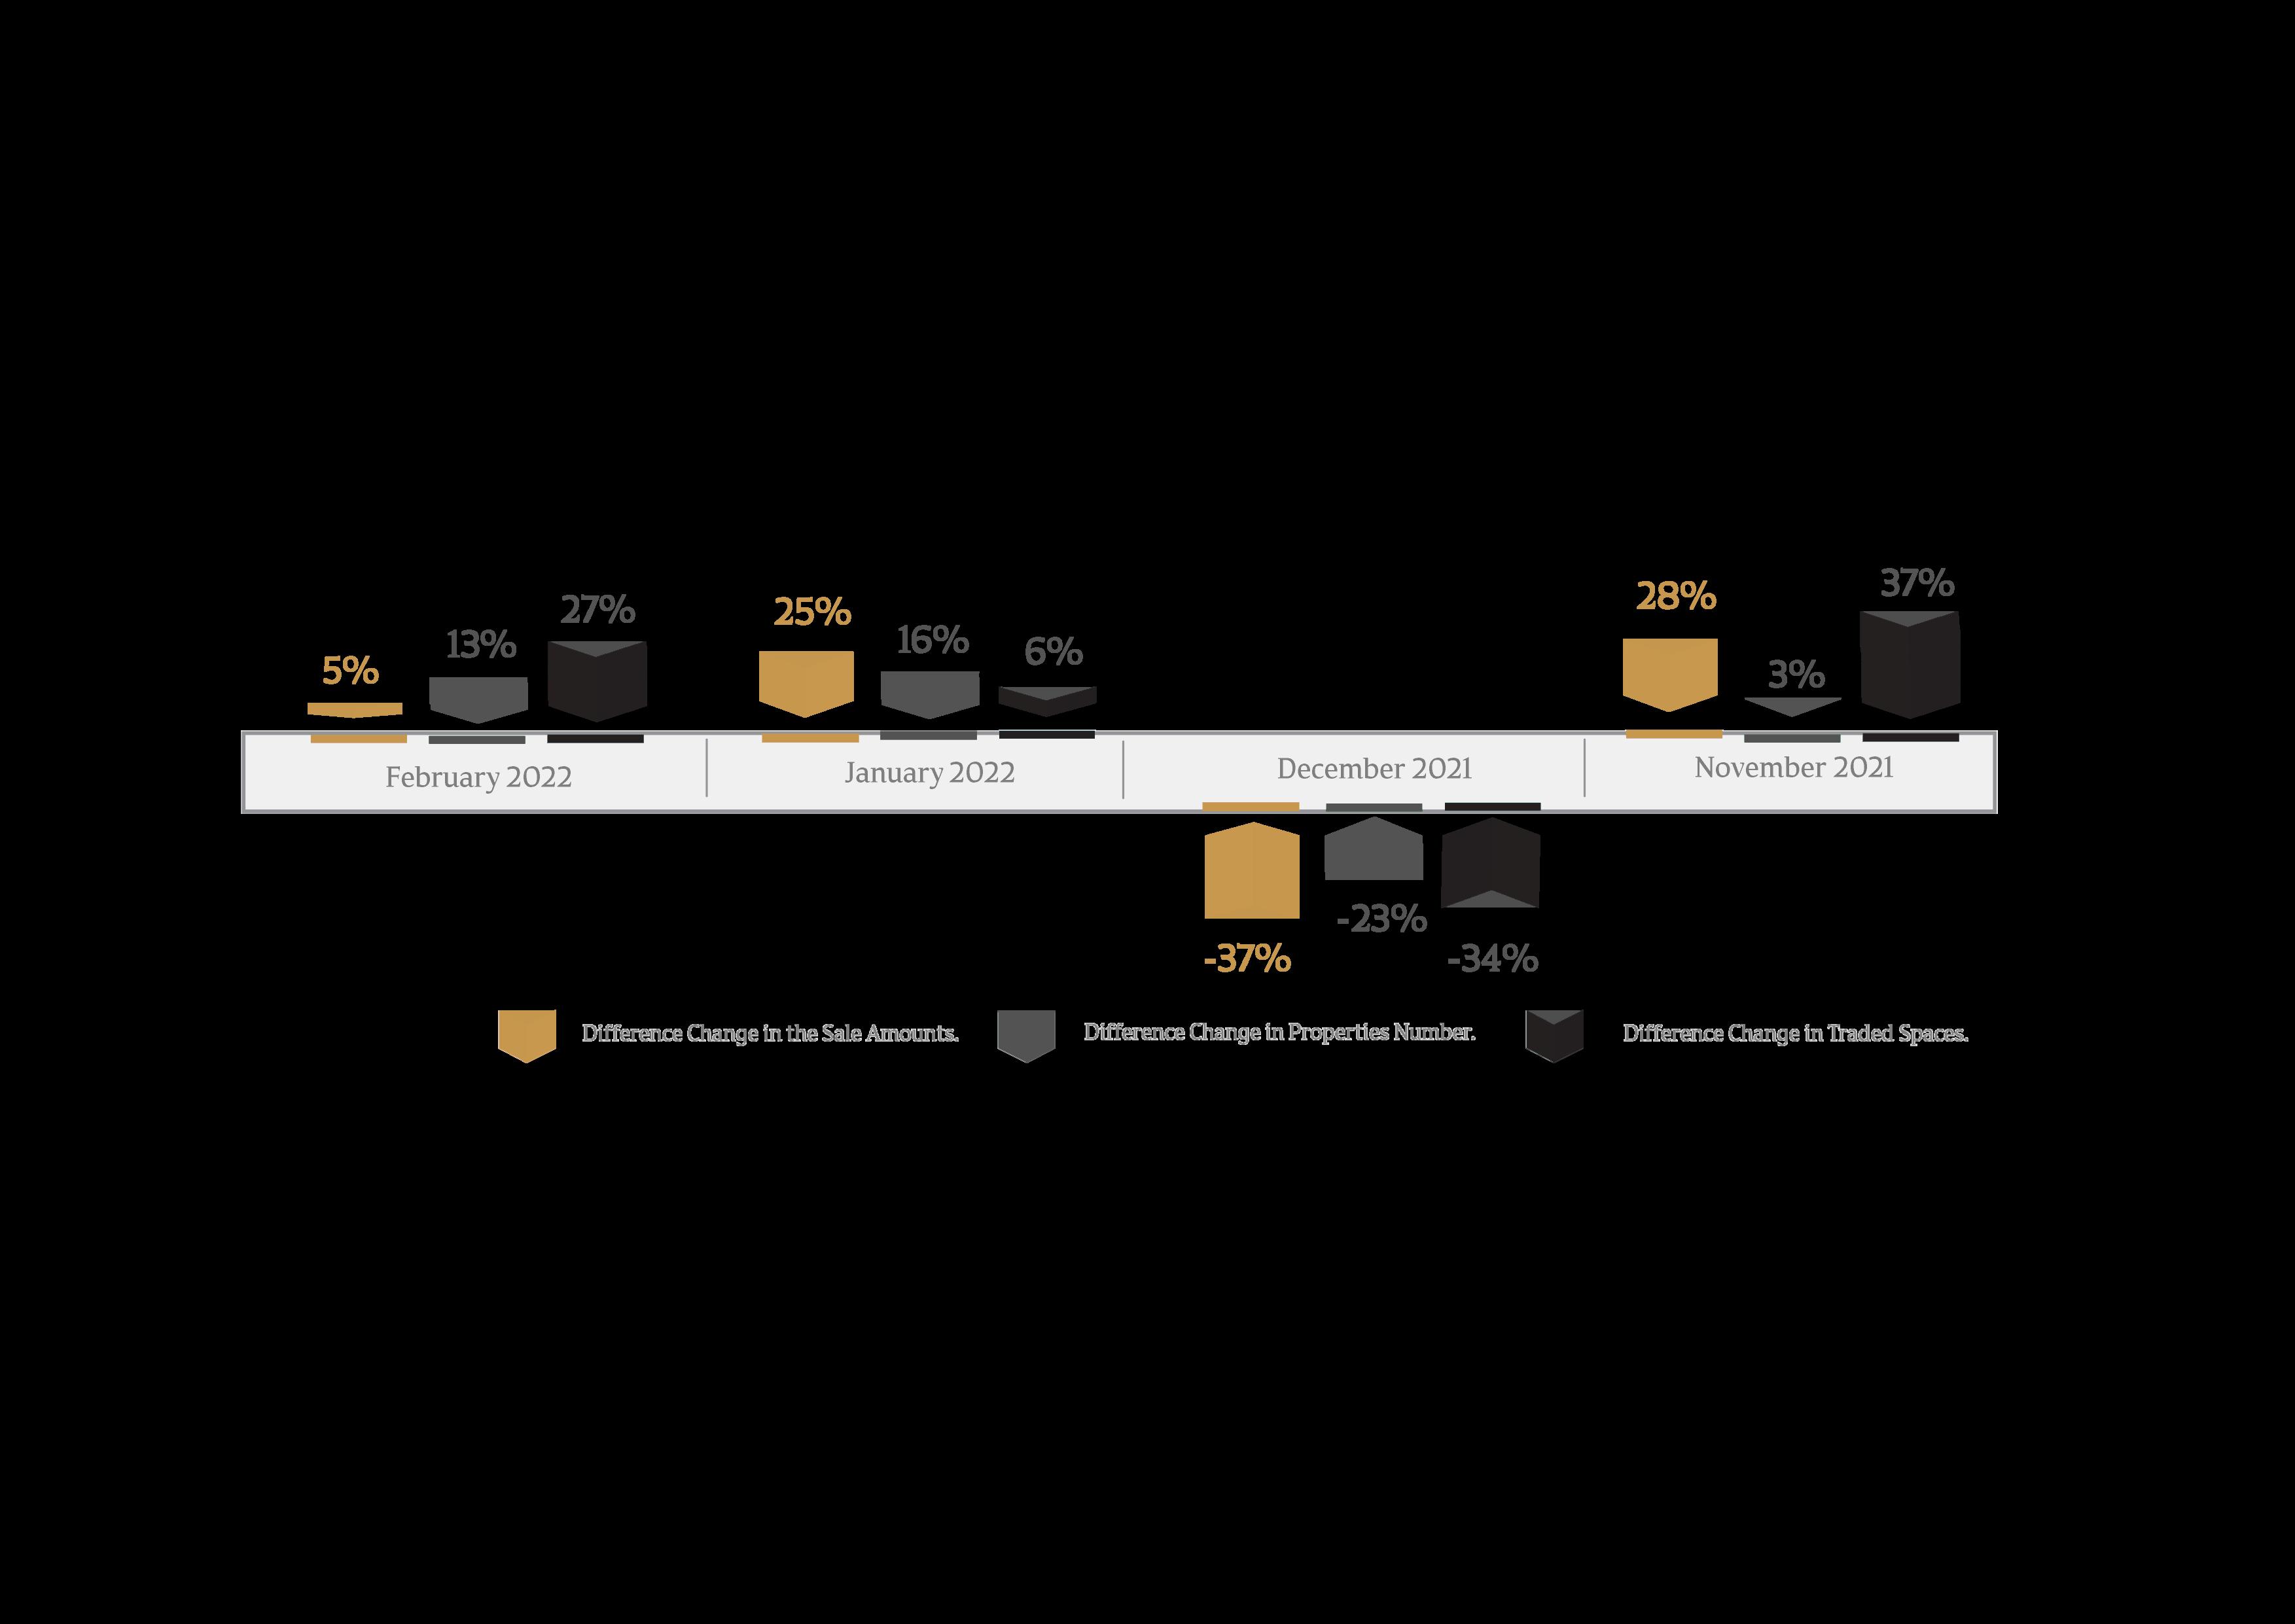
The real estate transactions index reached 1,492,507,657 QR for 301 transactions In October 2022 the real estate index decreased by 41% Real estate trading value index increased to 10%, while traded area index decreased by 20%

Real Estate Trading Volume During October 2022
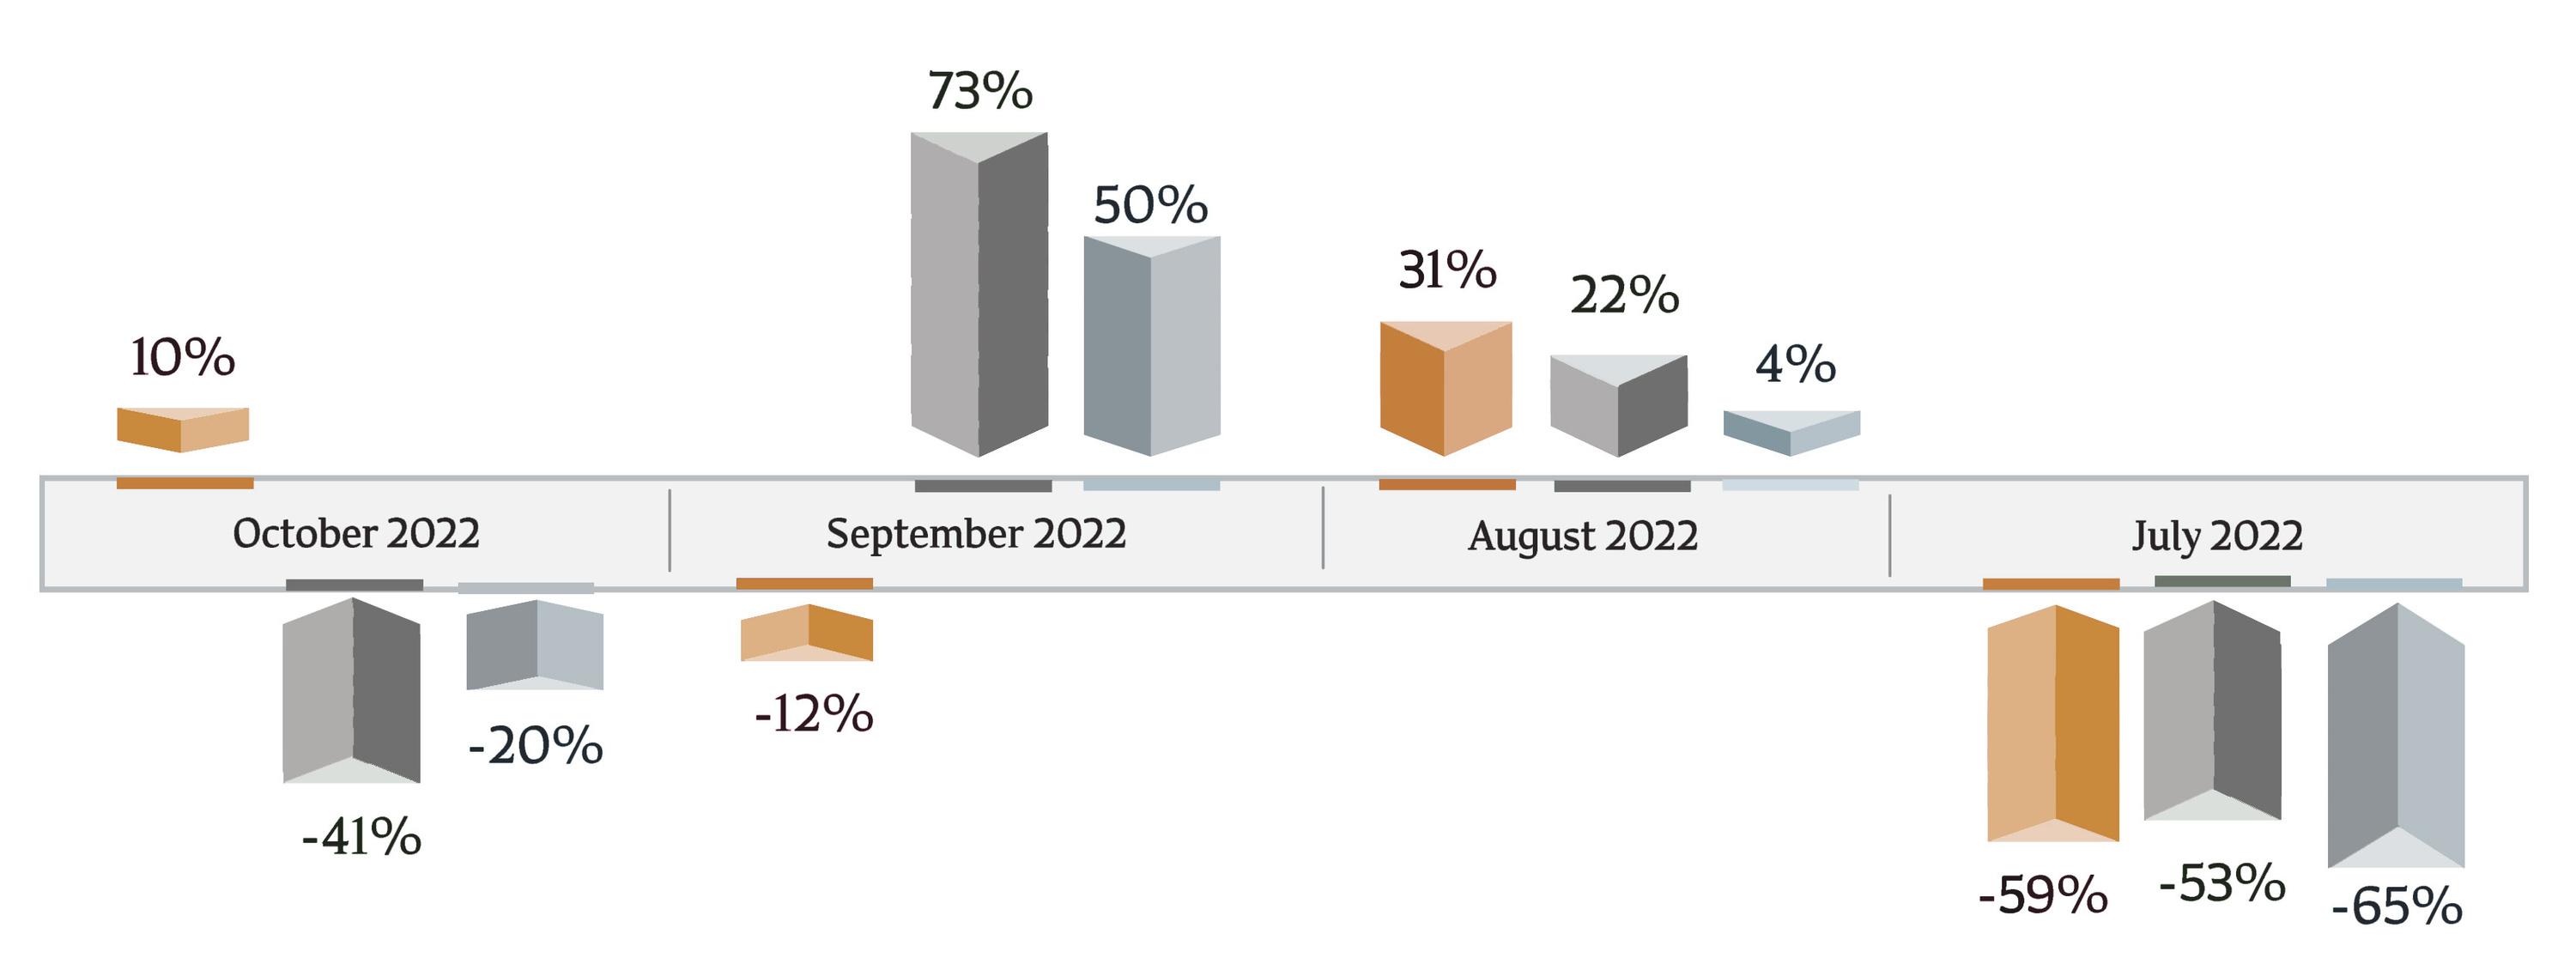
Difference in Performance Change Of the Real Estate Market
The Real Estate Bulletin I October 2022/ Ministry of Justice

The
Deals Financial Value Index for October 2022
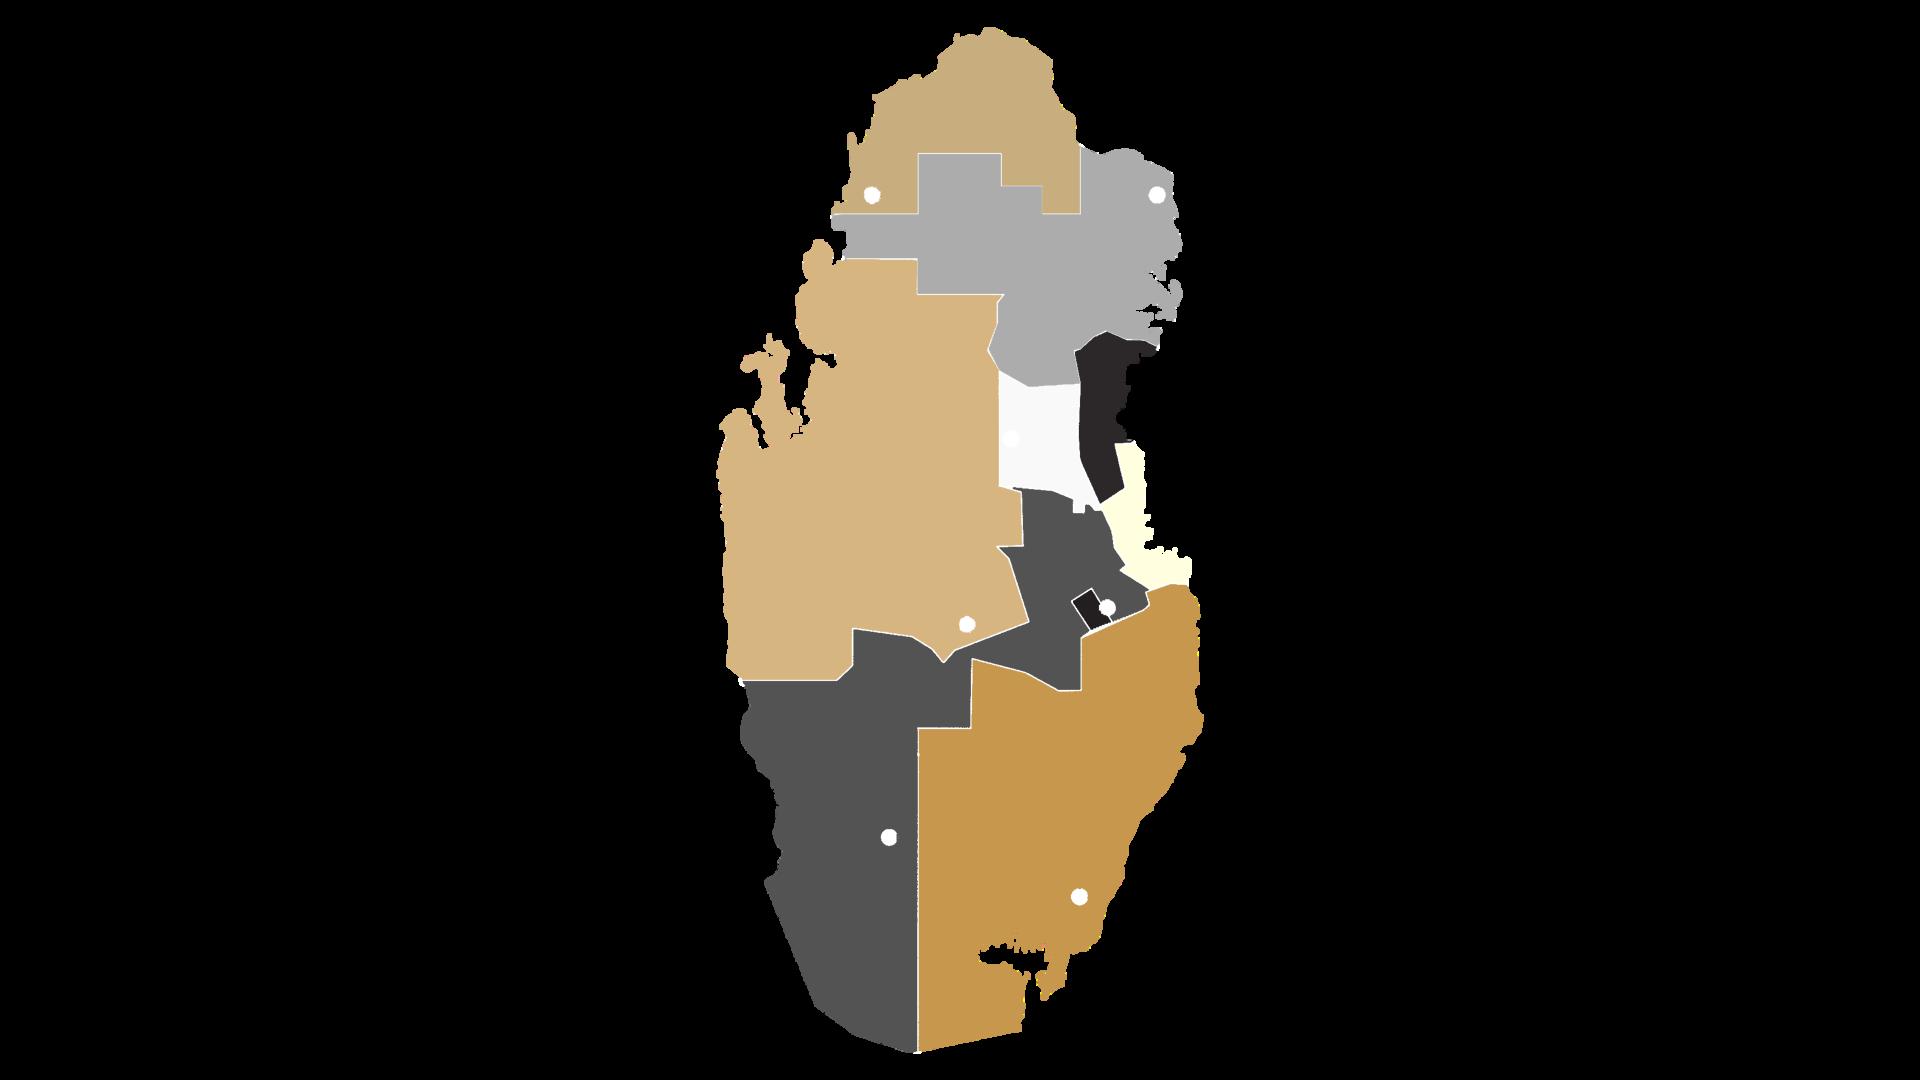
Al Rayyan, Doha Municipality, and Al Dhaayen Municipality are the most active in terms of financial value, with Al Rayyan Municipality's dealings reaching (745,777,781) QR, Doha Municipality ranking second with (317,012,018) QR, and Al Dhaayen Municipality ranking third with (238,846,497) QR
Al Rayyan
The Real Estate Bulletin I October 2022/ Ministry of Justice Doha Al Wakrah Umm Slal Al Shamal Al Khor and Dakhira 745,777,781 317,012,018 238,846,497 94,340,165 58,399,045 35,522,151 2,610,000 Al Dhaayen

Umm Slal Municipality Al Sheehaniya Municipality
QR 0 Al Rayyan Municipality QR
Number of Traded Properties as per Municipalities 3 25 0 109 20 79 40 25 AlRayyan 45% AlDhaayen 19% Doha 17% AlWakrah 7% UmmSlal 6% AlShamal 1% TradedSpaces Al Rayyan Municipality has 45% of the total deals area, followed by Al Daayen Municipality (19%) and Doha Municipality (17%) Percentage of Traded Spaces as per Municipalities The Real Estate Bulletin I September 2022/ Ministry of Justice The Real Estate Bulletin I October 2022/ Ministry of Justice Al Khor and Al Dakhira 5%
Doha Municipality QR 317,012,018 Al Dhaayen Municipality QR 238 846 497 Al Khor & Dhekra Municipality QR 35,522,151 Al Shamal Municipality QR 2 610 000
QR 58,399,045
745,777,781 Al Wakrah Municipality QR 94 340 165
TransactionsNumberIndicator

Mortgage Trading Movement during September 2022
Doha Municipality recorded the highest number of mortgage transactions with (60) transactions, equivalent to (49 6%) of the total number of mortgaged real estate, followed by Al Rayyan Municipality with (27) transactions, equivalent to (22.3%) of the total number of mortgaged real estate, then followed by Al Wakrah Municipality with (22) transactions equivalent to (18 2%)
AlRayyan 36% Doha 26% AlDaayen 13% UmmSlal 9% AlKhorandAlDakhira 8%
Al Rayyan Municipality sold the most real estate (36%), followed by Doha (26%) and Al Dhaayen (13%) Percentage of Number of deals Traded as per Municipalities The Real Estate Bulletin I October 2022/ Ministry of Justice
AlRayyan 223% AlDhaayen 66% UmmSlal 17% AlWakra 182% Doha 496%
The Real Estate Bulletin I October 2022/ Ministry of Justice
Al
Al
7% Al Shamal 1 7%
Shamal 1%
Wakrah

Al Shamal Municipality has not registered any building sale transaction, while the
sale transaction AverageperSquareFootPricesforOctoberandSeptember2022 The Real Estate Bulletin I October 2022/ Ministry of Justice Doha Al Wakrah Umm Slal Al Dhaayen Al Shamal Al Khor and Dakhira 873 Al Rayyan 347 609 342 414 624 414 243 260 472 278 205 152 Doha Al Wakrah Umm Slal Al Dhaayen Al Shamal Al Khor and Dakhira 856 Al Rayyan 344 440 290 387 302 461 262 290 581 308 281 143 237 October 2022 September 2022 Al Sheehaniya Municipality has not recorded any transaction Buildings Vacant Land Buildings Vacant Land
Al Sheehaniya has not registered any
Top Ten Properties
Al Daayen
Old Rayyan
Al Rayyan
Al Waab
Al Waab
Al Sadd
Al Wakrah
Al Wakrah
Al Waab
Al Rayyan Doha Al Rayyan Al Rayyan Al Rayyan Doha Al Dhaayen
Al Waab Baaya Pearl Al Khuraij
22,830,181
16,727,980 17,250,000 21,000,000 21,500,000 31,000,000
25,000,000 32,350,000 33,500,000 136,612,926
List of the top (10) real estate in October 2022, including six (6) in Al Rayyan Municipality, two (2) in Doha Municipality and one (1) in Al Daayen and Al Wakrah
The
Properties
August
The
Ten Most Expensive
for
2022
Real Estate Bulletin I January 2022/ Ministry of Justice
Mortgage Trading Movement during October 2022
Doha Municipality had the most mortgages (2,514,471,940) QR, while Umm Slal had the least (8,177,000 QR)
2,514,471,940 184,042,232 78,750,817 25,040,000 Al Dhaayen 11,130,000 8,177,000 Al Wakrah Doha Umm Slal
The Real Estate Bulletin I October 2022/ Ministry of Justice
A study of the mortgage transaction movement index reveals that the percentage of mortgaged real estate is higher than the percentage of mortgage transaction amounts in all municipalities that recorded mortgage transactions, except for Doha and Al Daayen

0
18
2 8% 0 9 % 6 6 %
6 5 % 22 3 % 49
0 4% 1 7%
0 25 50 75 100 AlShamal UmmSlal AlWakra AlDaayen AlRayyan Doha
3% 1 7%
2%
89 1%
6% The Real Estate Bulletin I October 2022/ Ministry of Justice Percentage of the Number and Amounts of mortgage transactions as per Municipalities The Mortgage Amounts Percentage The Properties Number Percentage Al Rayyan Al Shamal
MortgageTradingMovementduringOctober2022
36%
Total of the top 10 mortgage Transactions
Total of Remaining Mortgage Transactions
64%
The total percentage of the Top Mortgage Transactions
The Real Estate Bulletin I October 2022/ Ministry of Justice
Doha Municipality recorded 10 of the top 10 mortgaged properties in October 2022. The top ten real estate mortgage deals accounted for 64% of October's total value
Real Estate Trading Movement
- The Pearl and Al Kassar Area

Comparison of Residential Units Trading Indicators
The Real Estate Bulletin I October 2022/ Ministry of Justice
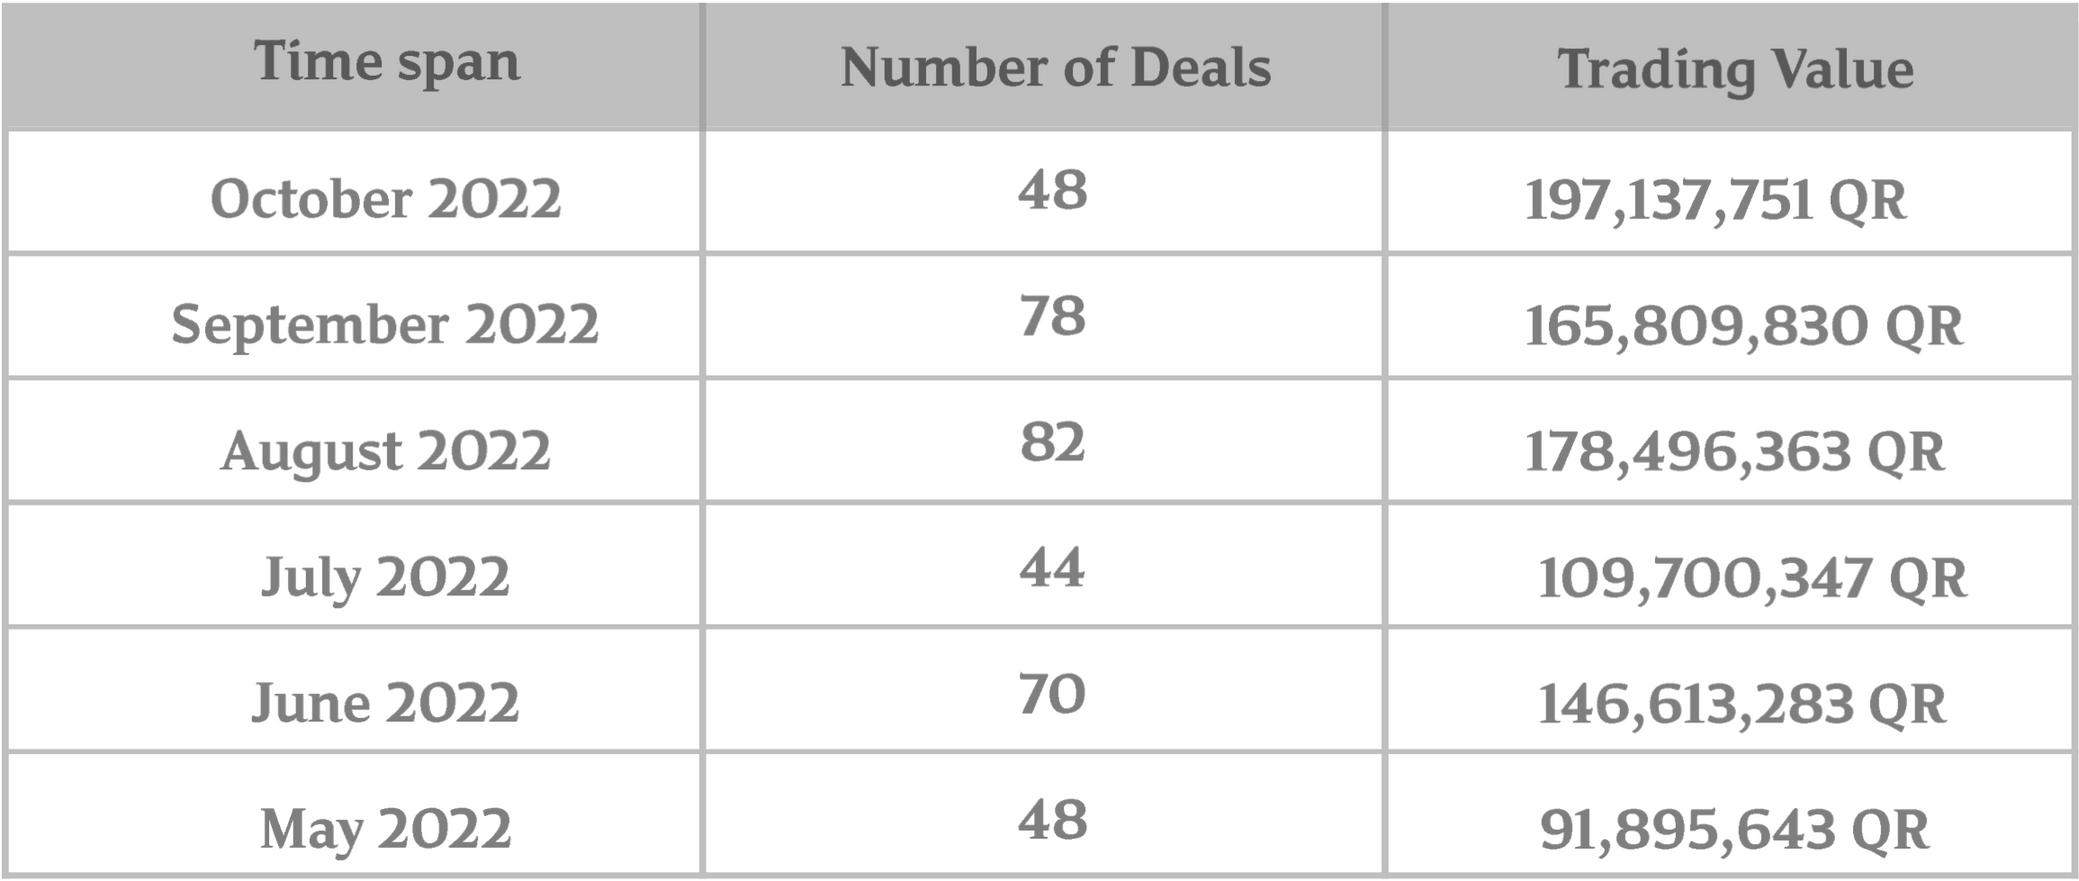
October 2022 had a increase in The Pearl and Al Kassar Area than September 2022. 86 residential unit transactions totaled 197,137,751 QR
