



The Real Estate Bulletin 1st Issue of January 2023
The Volume of the Real Estate Trading during November 2022
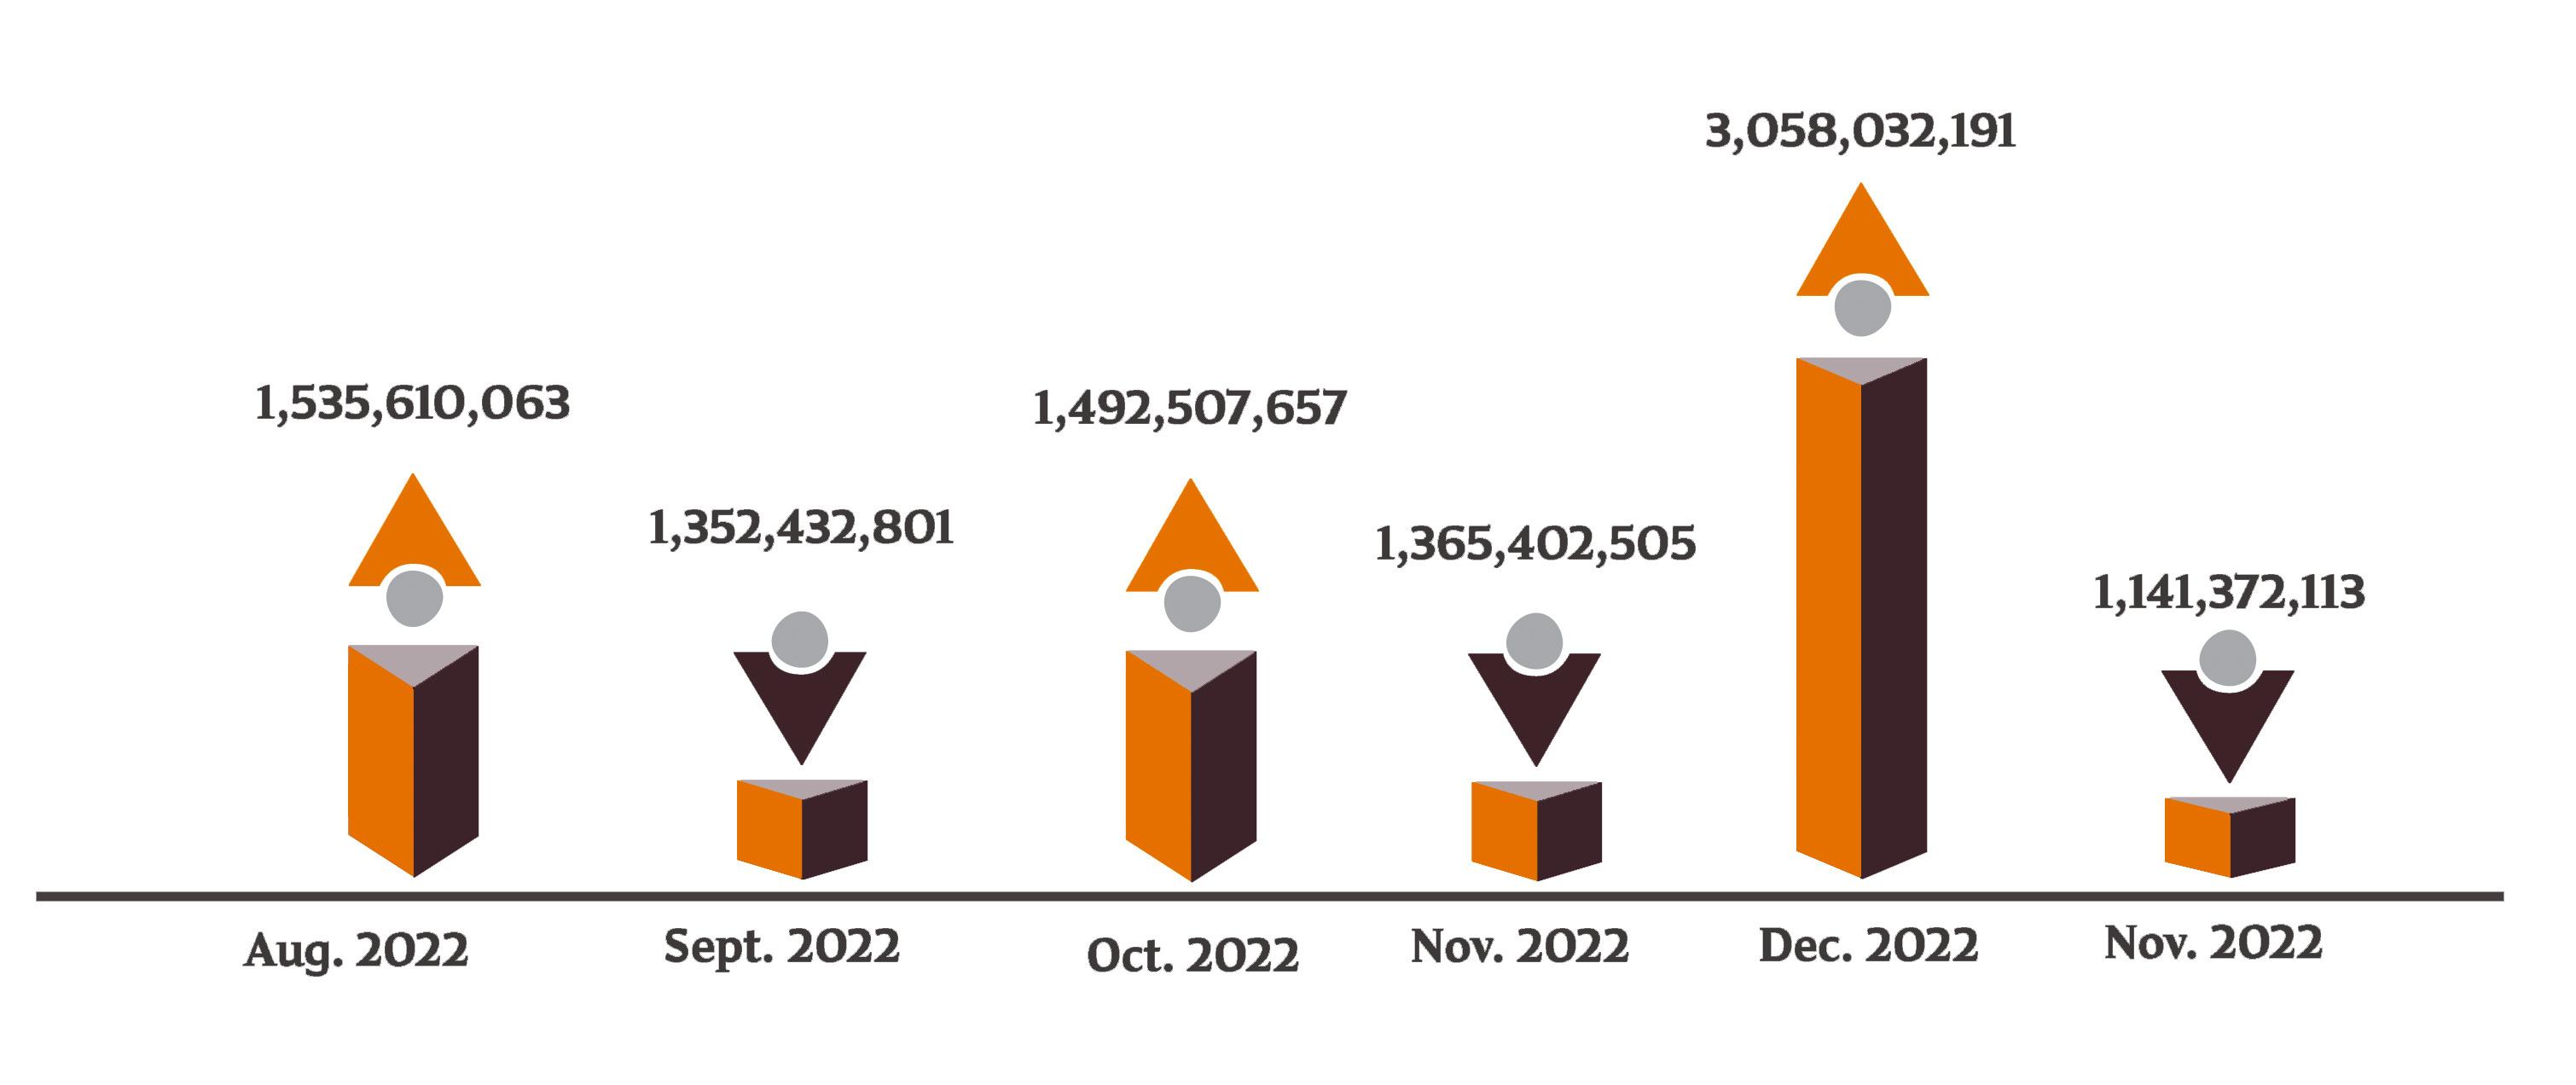


The real estate transactions index reached 1,141,372,113 QR for 225 transactions. In January 2023 the real estate index decreased by -63% While the traded areas index decreased by -60%.

The Real Estate Bulletin I January 2023/ Ministry of Justice
List of the Monthly Bulletin of the Properties Sold for January 2023
The Real Estate Bulletin I January 2023/ Ministry of Justice
Real Estate Trading Volume During January 2023
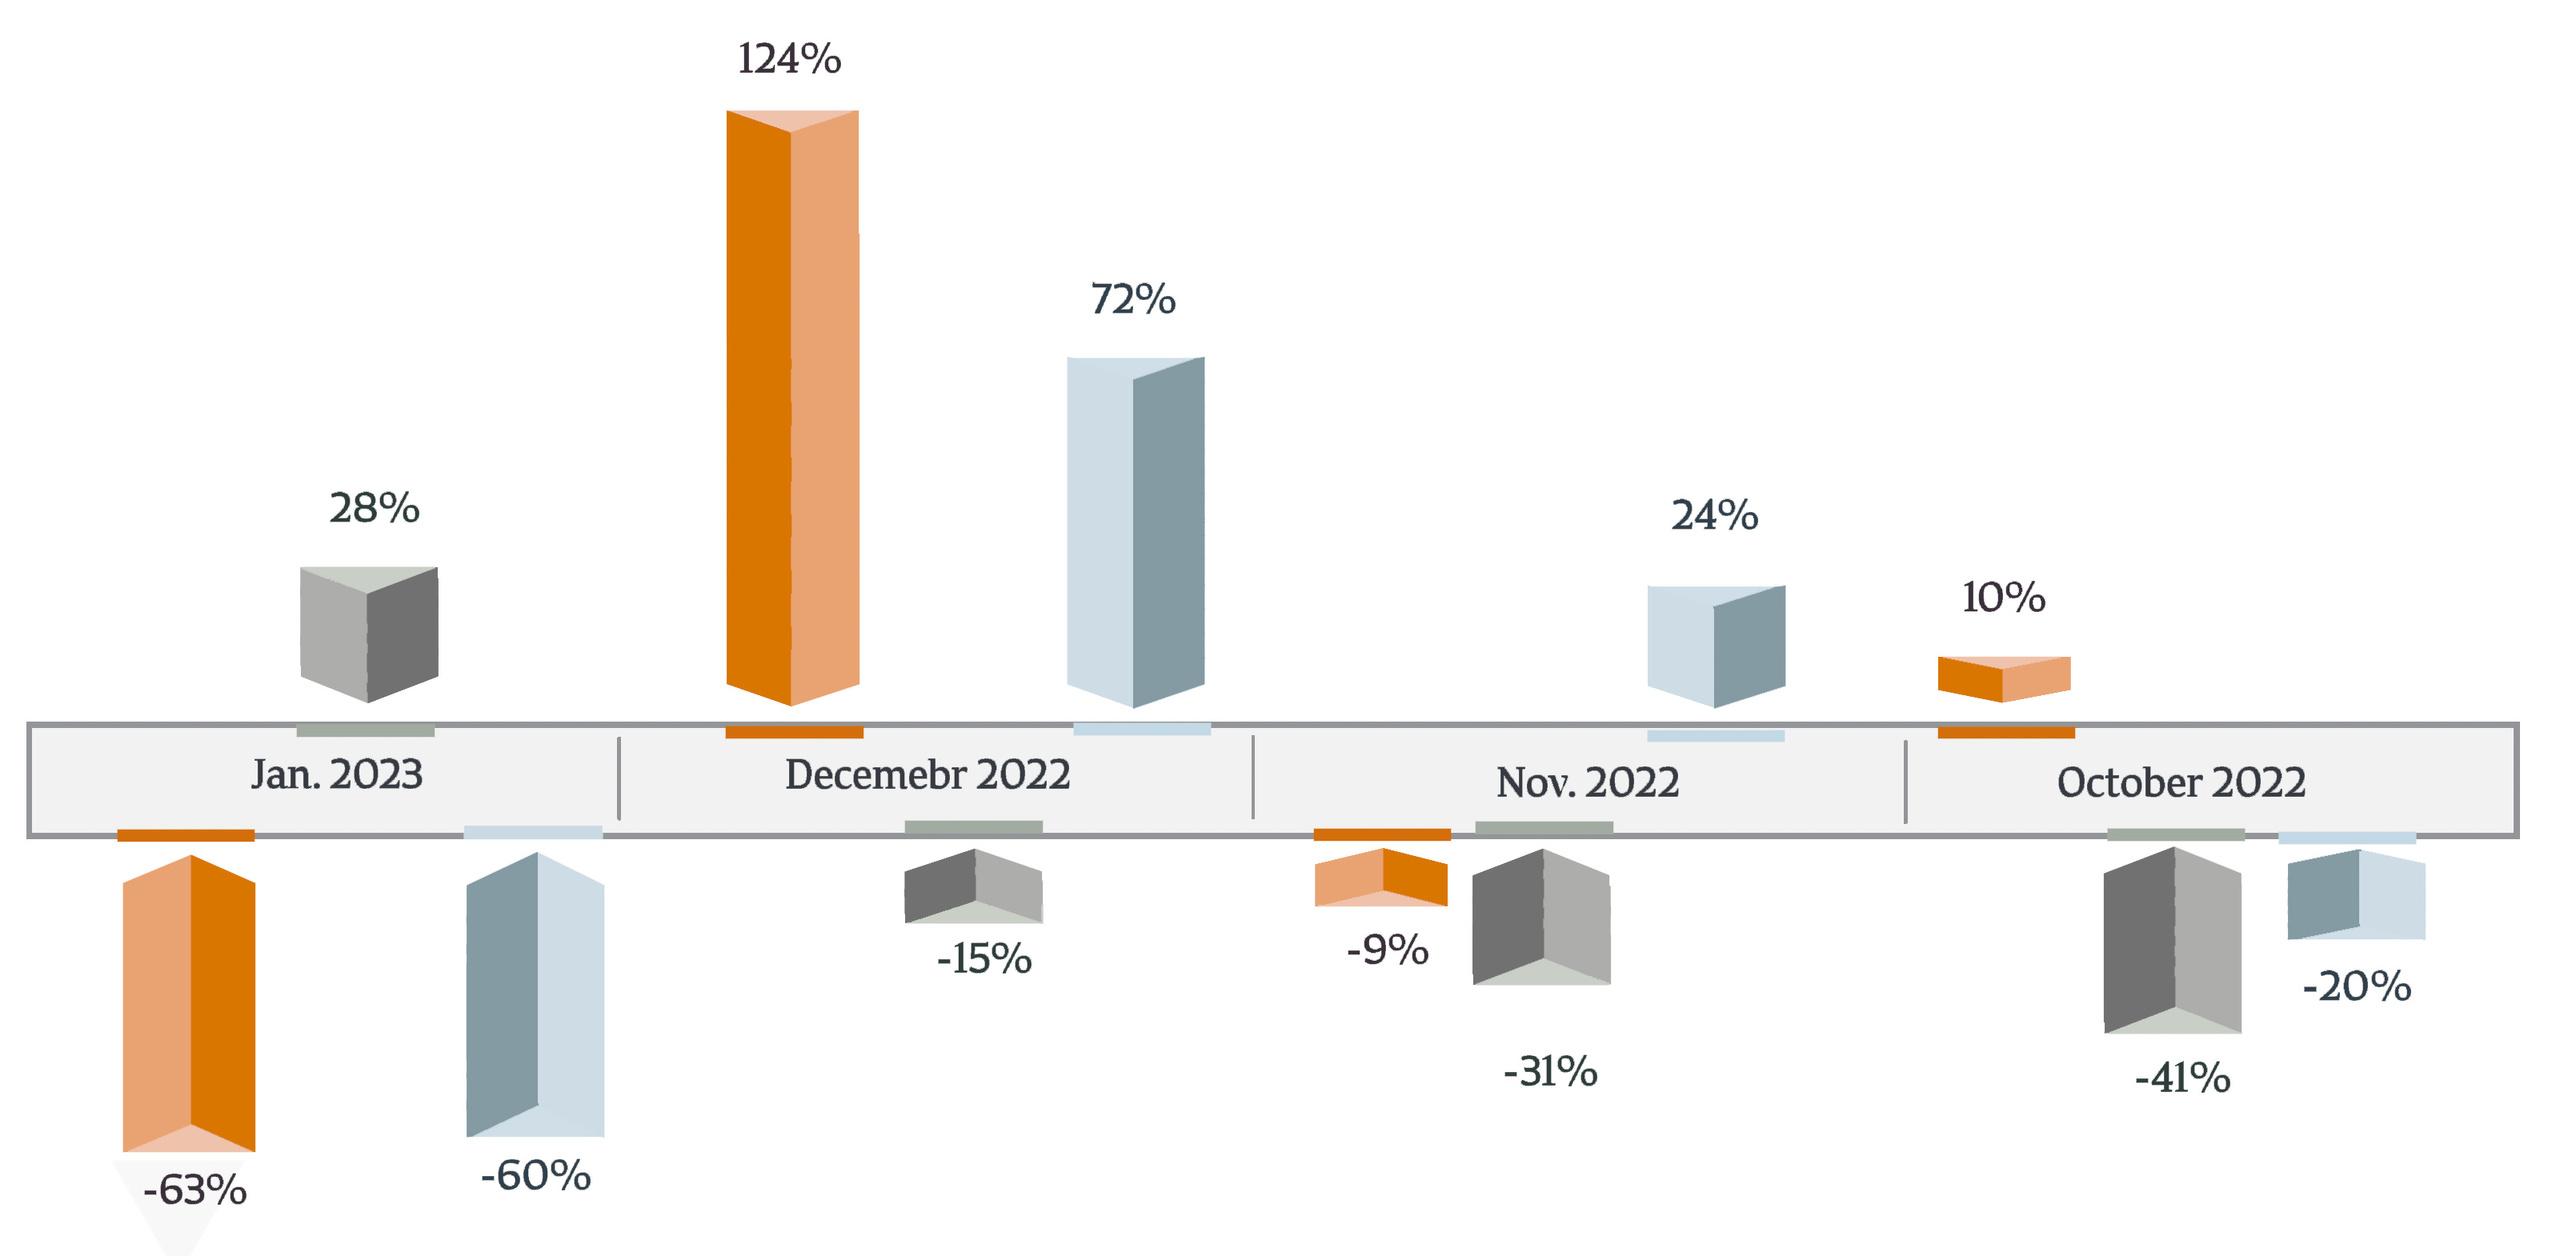


The Deals Financial Value Index for January 2023
Doha Municipality, Al Rayyan and Al Wakrah Municipality are the most active in terms of financial value, with Doha Municipality dealings reaching (439,209,695) QR, Al Rayyan Municipality ranking second with (311,013,282) QR, and Al Wakrah Municipality ranking third with (165,370,501) QR
Doha
Difference in Performance Change Of the Real Estate
The Real Estate Bulletin I January 2022/ Ministry of Justice
Market
Al-Rayyan Al
Al
439,209,695 311,013,282 165,370,501 93,829,621 88,632,532 32,482,030 1,760,000 Al Wakrah Al-Shamal 9,074,452
The Real Estate Bulletin I January 2023/ Ministry of
Justice
Dhaayen Umm Slal Al Sheehaniya
Khor and Dakhira
Number of Traded Properties as per Municipalities
TradedSpaces

Percentage of Traded Spaces as per Municipalities
Al Wakrah Municipality has 29% of the total deals area, followed by Al Rayyan Municipality (27%) and Doha Municipality (19%)

Doha Municipality QR 439 209 695 Al Daayen Municipality QR 93,829,621 Al-Khor & Dhekra Municipality QR 32 482 030 Al Shamal Municipality QR 9,074,452 Umm Slal Municipality Al Sheehaniya Municipality QR 88,632,532 QR 1,760,000 Al Rayyan Municipality QR 311,013,282 Al Wakrah Municipality QR 165,370,501
5 28 1 58 26 63 31 13 AlWakrah 29% AlRayyan 27% Doha 19% AlDhaayen 12% UmmSlal 8% Al-Khor&DhekraMunicipality 4%
The Real Estate Bulletin I January 2023/ Ministry of Justice The Real Estate Bulletin I January 2023/ Ministry of Justice Al Shamal 1%
Doha Municipality sold the most real estate (28%), followed by Al Rayyan (26%) and Al Dhaayen (14%)
Mortgage Trading Movement during January 2023
Al Rayyan Municipality recorded the highest number of mortgage transactions with (38) transactions, equivalent to (57.6%) of the total number of mortgaged real estate, followed by Doha Municipality with (11) transactions, equivalent to (16 7%) of the total number of mortgaged real estate, then followed by Umm Slal Municipality with (7) transactions equivalent to (10.6%)

Doha 28% AlRayyan 26% AlDhaayen 14% UmmSlal 12% AlWakrah 12% AlKhorandAlDakhira 6%
The Real Estate Bulletin I January 2023/ Ministry of Justice TransactionsNumberIndicator The Real Estate Bulletin I January 2023/ Ministry of Justice Doha 576% AlRayyan 167% UmmSlal 106% AlDhaayen 76% AlWakra 45% AlShamal 15%
Percentage of Number of Deals Traded as per Municipalities
mm Al Khor & Dhekra 1 5%
Al Sheehaniya Municipality has not registered any building sale transaction
Al Sheehaniya Municipality has not registered any sale transaction

AverageperSquareFootPricesforJanuary2023andDecember2022 The Real Estate Bulletin I January 2023/ Ministry of Justice Doha Al Wakrah Umm Slal Al Dhaayen Al-Shamal Al Khor and Dakhira 942 Al Rayyan 492 546 200 499 385 420 407 284 438 376 247 152 Doha Al Wakrah Umm Slal Al Dhaayen Al-Shamal Al Khor and Dakhira 1292 Al Rayyan 436 373 259 442 314 405 238 254 394 370 526 138 January
2023 December 2022
Buildings Vacant Land Buildings Vacant Land 293 273 Al Sheehaniya 224
Top Ten Properties
The Ten Most Expensive Properties for November 2022
The Real Estate Bulletin I January 2023/ Ministry of Justice
List of the top (10) real estate in January 2023, including three (5) in Al Rayyan Municipality, three (3) in Doha Municipality and two (2) in Al Wakrah municipality
Al Wakrah Al Waab Fereej Al Soudan 15,291,000 15,400,00 16,000,000 20,000,000 37,674,900 26,500,000 54,000,000 103,244,227 150,000,000 Al Wakrah Al Rayyan Al Rayyan Al Rayyan Al Rayyan Doha Al Wakrah Doha 26,500,000 Al Rayyan
Nuaija Doha Mesaimeer Mesaimeer Rawdat
Al
Al
Akdim
Sadd Al Wukair
Sadd
Mortgage Trading Movement during January 2023

Doha Municipality had the most mortgages (7,107,951,962) QR, while Al Shamal had the least (1,200,000 QR)
A study of the mortgage transaction movement index reveals that the percentage of mortgaged real estate is higher than the percentage of mortgage transaction amounts in all municipalities that recorded mortgage transactions, except for Doha
Percentage of the Number and Amounts of mortgage transactions as per Municipalities
7,107,951,962 210,254,212 100,283,000 83,000,000 Al Wakrah 52,832,000 3,120,000 Al Dhaayen Doha Al Khor & Dhekra
Real Estate
January 2023/ Ministry of Justice
The
Bulletin I
0 25 50 75 100 AlShamal AlKhor&Dhekra UmmSlal AlWakrah AlDhaayen AlRayyan Doha 1 5% 1 1% 10 6% 4 5% 1 3% 94% 7 6% 0 7% 57 6% The Real Estate Bulletin I January 2023/ Ministry of Justice
The Mortgage Amounts Percentage The Properties Number Percentage Umm Slal Al Rayyan 1 5% Al Shamal 1,200,000 2 8% 16 7%
Total of the top 10 mortgage Transactions
Total of Remaining Mortgage Transactions
The total percentage of the Top Mortgage Transactions
Real Estate Bulletin I January 2023/ Ministry of Justice
Doha Municipality recorded 9 of the top 10 mortgaged properties in January 2023 The top ten real estate mortgage deals accounted for 91% of January's total value

Real Estate Trading Movement - The Pearl and Al Kassar Area
Comparison of Residential Units Trading Indicators January 2023 had an increase in The Pearl and Al Kassar Area than December 2023 32 residential unit transactions totaled 72,031,671 QR
The Real Estate Bulletin I January 2023/ Ministry of Justice

MortgageTradingMovementduringJanuary2023
91%
9%
The
