Tumbarumba Market Update 2nd Half 2024

In the 1st half 2024,Tumbarumba* recorded a median house price of $375,000,and a median vacantland price of $245,000.This represents annual (1H 2023– 1H 2024)median price growth of 29.3%for houses and significant growth (more than double) for vacant land. Comparing H1 2023– 1H 2024, total house sales declined by-10.0%, to 18 sales in 1H 2024. The vacantland market remain small, at 6 sales in 1H 2024. This suggests that there is an undersupply for houses and high demand for land. Now is an ideal time for owners to capitalise on their investments, and with nonew housing stock planned; for buyers to enter the market.
CHANGE FROM LAST


Tumbarumba will see approximately $7.8Mofnewprojectscommencing constructionbetween2020and2024
HOUSE SALES
HOUSE MEDIAN PRICE
HOUSE RENTAL PRICE
LAND SALES
LAND MEDIAN PRICE
YEAR HALF YEAR


MEDIAN PRICE 1H 2024

$375K $245K
MEDIAN PRICE Q2 2024
AVERAGE DAYS ON MARKET 1H 2024
113
AVERAGE DAYS ON MARKET Q2 2024
Afocuson infrastructuredevelopmentwill improve liveability for residents,whilstalso creatingemploymentopportunitiesduring the constructionphase.Combinedwith commercialprojects,This canattract more people to live in Tumbarumba, which shouldhave apositive spill-over impacton the real estatemarket,in the form of higher demandfor housing.
The two commercial developments between 2020and 2024are the Costa Group Storage Shed ($2.0M) and MountTumbarumba Adventure Park Mountain Bike Facility ($2.0M).
The largest infrastructure project is the Tumbarumba to Rosewood Rail Trail Bridges ($1.3M). The other infrastructure developments are:
• Bago State Forest Bridges ($1.0M)
• Walteela Road Bridge ($888K)
• Coppabella Creek Suspension Bridge ($610K)
There is an absence of residential developments planned between 2020-2024.Thus, the undersupply of house and units will continue. This puts more pressure on analready tight market, pushing prices up further and making it harder for first home buyers toenter the market.

AVERAGE VENDOR DISCOUNT*
Average vendor discount reflects the average percentage difference between the first list price and final sold price. A lower percentage difference (closer to 0.0%) suggests that buyers are willing to purchase close to the first asking price of a property.


Average vendor discounts between 1H 2023and 1H2024 have remained relatively stable, at -3.6% for houses. This suggests that house market conditions in Tumbarumba* are still favouring buyers, as the final sale price is below the first list price. Compared to 6 months prior however, average house discount have tightened; it was at -5.9% in the 1H 2023. Thus now is an ideal time forbuyers to act.
The suburb of Tumbarumba has historically provided a more affordable house market than the wider Snowy Valley Local Government Area (LGA), and onpar for land. 2024# saw this trend continue for houses, however the land market in Tumbarumba* have become a premium compared to the Snowy Valley LGA.
The dominant proportion of homes sold in Tumbarumba* in 2024# were in the more affordable price point of below $349,999and between $350,000and $449,999(both at 30.8%), while vacantland recorded a dominant premium price point of above $250,000(40.0%). Thatsaid the upper and premium price points for houses is showing strength, with a combined 30.8%of sales being above $550,000. This suggests equal opportunity for buyers and owners.
MARKET COMPARISON
The market comparison graph provides a comparative trend for the median price of houses and unit over the past 5 years. The suburb chosen was based on their proximity to the main LGA analysed, which is Tumbarumba*.


PRICE BREAKDOWN 2024 #


Less than $99,999
$100,000 to $149,999
$150,000 to $199,999
$200,000 to $249,999
$250,000 and above
RENTAL GROWTH 2024€
House rental yields in Tumbarumba¥ was 3.8%in June 2024,which was higher than Sydney Metro (2.8%). This was paired with a 4.3%increase in median house rental price in the past 12months to Q22024, now at $382in Q2 2024. During this time the number of houses rented declined by -14.3%, to 6 house rentals in Q2 2024. There is a highly demanded house rental market, creating a more affordable investment option than Sydney
3 bedroom houses have provided investors with +1.9%rental growth annually, achieving a median rent of $385per week.
Tumbarumba¥ recorded a vacancy rate of 0.0% in June 2024,well below Sydney Metro’s 1.7% average. A 0.0% vacancy rate suggests that all available rentals are currently rented.
Vacancy rates in Tumbarumba¥ have fluctuated over the past 12 months, due to the small size of its rental market. That said the average vacancy rate is 0.7%, well below the Real Estate Institute of Australia’s ‘Healthy’ Benchmark of 3.0%. This suggests quicker occupancy of rental properties, thus a conducive investment opportunity in Tumbarumba¥
RENTAL VACANCY RATES 2024


Tumbarumba¥
PROJECT DEVELOPMENT MAP 2020
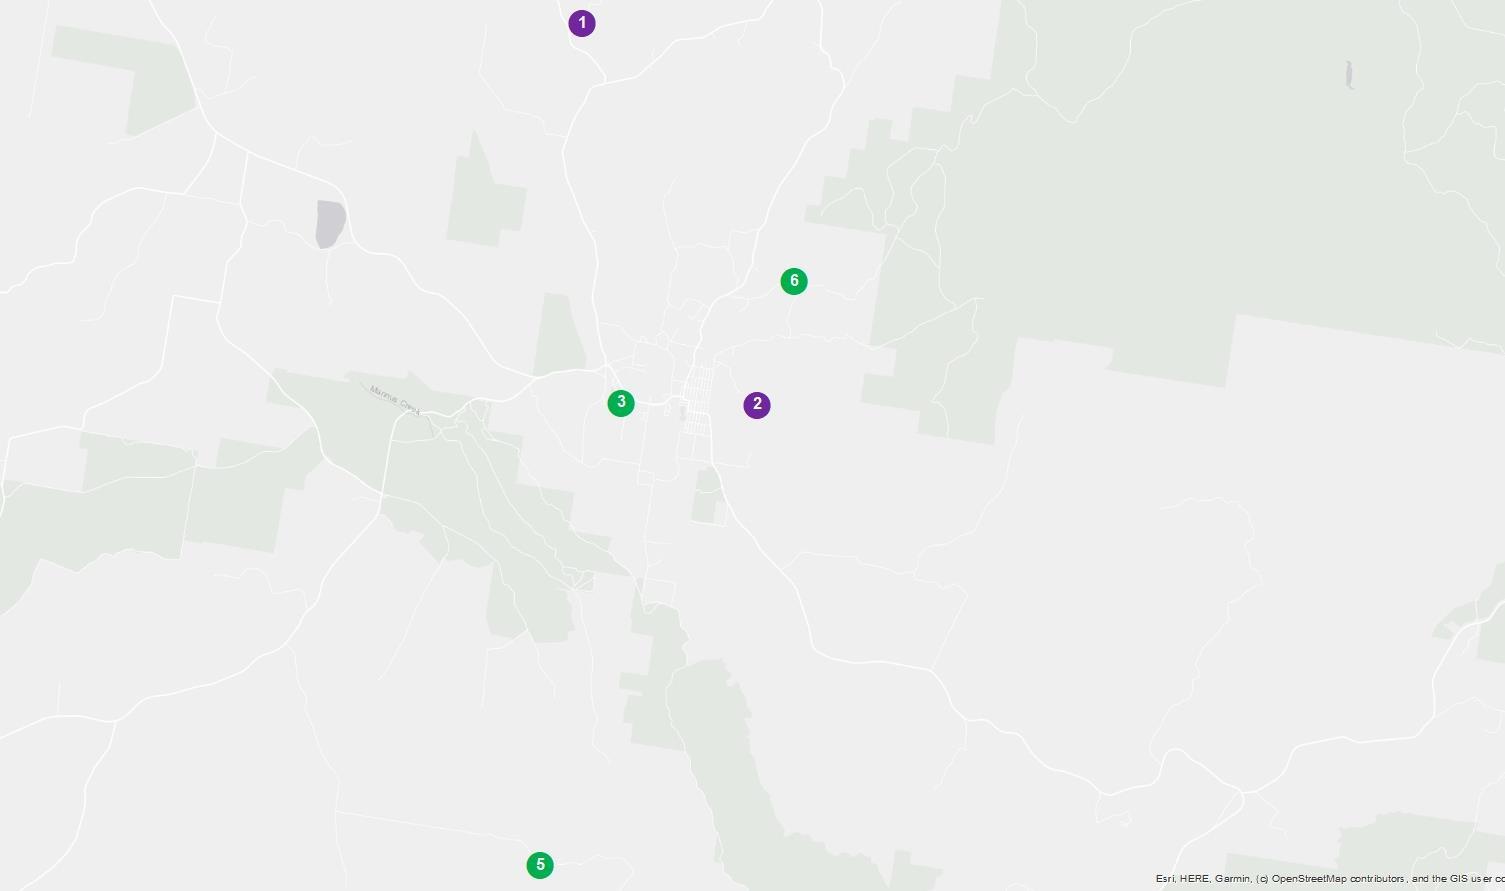
TUMBARUMBA


RESEARCH SERVICES
Our research services span over every suburb, LGA,and state within Australia; captured in a variety of standard and customised products, andinclude:
• Advisory and consultancy
• Market analysis including profiling and trends
• Primary qualitative and quantitative research
• Demographic and target market analysis
• Geographic information mapping
• Project analysis including product and pricing recommendations
• Rental and investment return analysis
OUR KNOWLEDGE
Access to accurate and objective research is the foundation of all good property decisions.
OUR PEOPLE
Our research team is made up of highly qualified researchers who focus solely on propertyanalysis.


REFERENCES
* Tumbarumba market data and key indicators encapsulates aggregate property market conditions within the postcode of 2653
** Estimated values are based on construction value provided by the relevant data authority and does not reflect commercial and/or re-sale value.
# 2024 encapsulates sales transactions for 1st Half 2024 (01/01/2024 – 30/06/2024) only, other years encapsulates sales transactions for the full year (i.e 01/01 to 31/12 of the relevant year).
€ Annual rental growth is a comparison between Q2 2023 (01/04/2023 – 30/06/2023)and Q2 2024 (01/04/2024 – 30/06/2024) house median rent figures.
¥ Tumbarumba market data encapsulates aggregate property conditions within the postcode of 2653.
§ Rental yields shown are as reported as of June 2024.
₳ Project development map showcases a sample of upcoming projects only, due to accuracy of addresses provided by the data provider for geocoding purposes.
£ Projects refers to the top developments within the postcode of 2653.
µ Estimated value is the value of construction costs provided by relevant data authority, it does not reflect the project’s sale/commercial value.
ψ Commencement date quoted for each project is an approximate only, as provided by the relevant data authority, PRD does not hold any liability to the exact date.
Source: APM Pricefinder, Cordell Connect database, SQM Research, Esri ArcGIS.
Disclaimer: PRD does not give any warranty in relation to the accuracy of the information contained in this report. If you intend to rely upon the information contained herein, you must take note that the information, figures and projections have been provided by various sources and have not been verified by us. We have no belief one way or the other in relation to the accuracy of such information, figures and projections. PRD will not be liable for any loss or damage resulting from any statement, figure, calculation or any other information that you rely upon that is contained in the material.
Prepared by PRD Research. © All medians and volumes are calculated by PRD Research. Use with written permission only. All other responsibilities disclaimed. © Copyright PRD 2024.