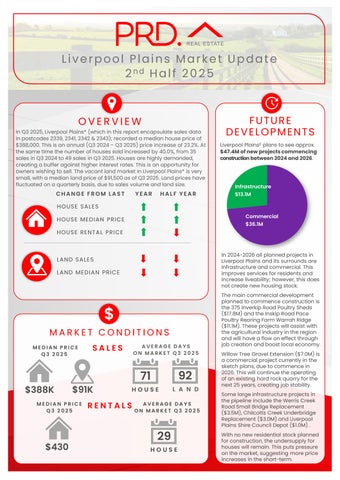

Liverpool Plains Market Update 2nd Half 2025

In Q3 2025, Liverpool Plains* (which in this report encapsulate sales data in postcodes 2339,2341,2342& 2343); recorded a median house price of $388,000.This is an annual (Q3 2024– Q3 2025)price increase of 23.2%. At the same time the number of houses sold increased by 40.0%, from 35 sales in Q3 2024to 49sales in Q3 2025. Houses are highly demanded, creating a buffer against higher interest rates. This is an opportunity for owners wishing to sell. The vacant land market in Liverpool Plains* is very small, with a median land price of $91,500as of Q3 2025 Land prices have fluctuated on a quarterly basis, due to sales volume and land size.
CHANGE FROM LAST


Liverpool Plains£ plans to see approx. $47.4Mofnewprojectscommencing constructionbetween2024and2026
YEAR HALF YEAR
HOUSE SALES
HOUSE MEDIAN PRICE
HOUSE RENTAL PRICE
LAND SALES
LAND MEDIAN PRICE

MEDIAN PRICE Q3 2025

$388K $91K
MEDIAN PRICE Q3 2025
AVERAGE DAYS ON MARKET Q3 2025
71
AVERAGE DAYS ON MARKET Q3 2025 92 HOUSE 29 $430

Commercial $36.1M Infrastructure $13.1M

In 2024-2026 all planned projects in Liverpool Plains and its surrounds are infrastructure and commercial. This improves services for residents and increase liveability; however, this does not create new housing stock.
The main commercial development planned to commence construction is the 375Inverkip Road Poultry Sheds ($17.8M)and the Inskip Road Pace Poultry Rearing Farm Warrah Ridge ($11.1M). These projects will assist with the agricultural industry in the region and will have a flow on effect through job creation and boost local economy.
Willow Tree Gravel Extension ($7.0M)is a commercial project currently in the sketch plans, due to commence in 2026. This will continue the operating of anexisting hard rock quarry forthe next 25years, creating job stability. Some large infrastructure projects in the pipeline include the Werris Creek Road Small Bridge Replacement ($3.5M), Chilcotts Creek Underbridge Replacement ($3.0M)and Liverpool Plains Shire Council Depot ($1.0M).
With no new residential stock planned for construction, the undersupply for houses will remain. This puts pressure on the market, suggesting more price increases in the short-term.

AVERAGE VENDOR DISCOUNT*
Average vendor discount reflects the average percentage difference between the first list price and final sold price. A lower percentage difference (closer to 0.0%) suggests that buyers are willing to purchase close to the first asking price of a property.


Average house vendor discounts between Q3 2024and Q3 2025have widened to a slightly higher discount of -6.6%. The Liverpool Plains* house market still favourbuyers, as sellers remain willing to accept below the first listed price. This creates an opportunity for buyers. With no new readyto-sell housing stock however, buyers must actfast.
The Liverpool Plains area have historically offered a more affordable house and vacant land market than Tamworth Local Government Area (LGA) in the past 5 years. This has continued to be the case in 2025# for both property types. The median house price gap between Liverpool Plains and Tamworth LGA continues to widen in 2025#.Meanwhile, the gap for vacantland median prices is moving closer.
Most of the homes sold in Liverpool Plains* in 2025#were priced in the most affordable price point of less than $299,999(34.9%). Vacant land also recorded a dominant most affordable price point, of less than $99,999(40.0%), Thatsaid, the premium market is strong, with 19.8% of houses sold above $600,000and 33.3%of land sold above $250,000.This benefits sellers wishing to sell. Overall, there is a home forevery budget in Liverpool Plains*.
MARKET COMPARISON
Liverpool Plains House Tamworth LGA House
Liverpool Plains Vacant Land Tamworth LGA Vacant Land
The market comparison graph provides a comparative trend for median price of houses and units over the past 5 years. The main LGA chosen was based on their proximity to the main suburb analysed, which is Liverpool Plains.


Less than $99,999
$100,000 to $149,999
$150,000 to $199,999
$200,000 to $249,999 $250,000 and above
RENTAL GROWTH 2025€
House rental yields in Liverpool Plains¥ was 5.1% as of September 2025,which is well above the Tamworth LGA (4.4%) and Sydney Metro (2.7%) yields. Median house rental price increased, by 3.6%in the past 12months to Q3 2025,at $430per week. The number of houses rented also increased by 3.8%, from 26 rentals in Q3 2024to 27rentals in Q3 2025.Despite its smaller size, the rental market in Liverpool Plains¥ is highly demanded. Further, with a higher rental yield and a more affordable entry price, Liverpool Plains¥ is a highly attractive option to Sydney Metro.
4+ bedroom houses have provided investors with +6.3%rental growth annually, achieving a median rent of $505per week.
Liverpool Plains¥ recorded a vacancy rate of 0.8%in September 2025,below the Tamworth LGA average of 1.0% and Sydney Metro’s 1.3%. Vacancy rates in Liverpool Plains¥ have fluctuated in the past 3 years, due to the small size of the rental market. That said, 0.8% vacancy rate is well below the Real Estate Institution of Australia’s healthy benchmark of 3.0%, suggesting quicker occupancy of rental homes in the area This creates a conducive environment for investors.
RENTAL VACANCY RATES 2025


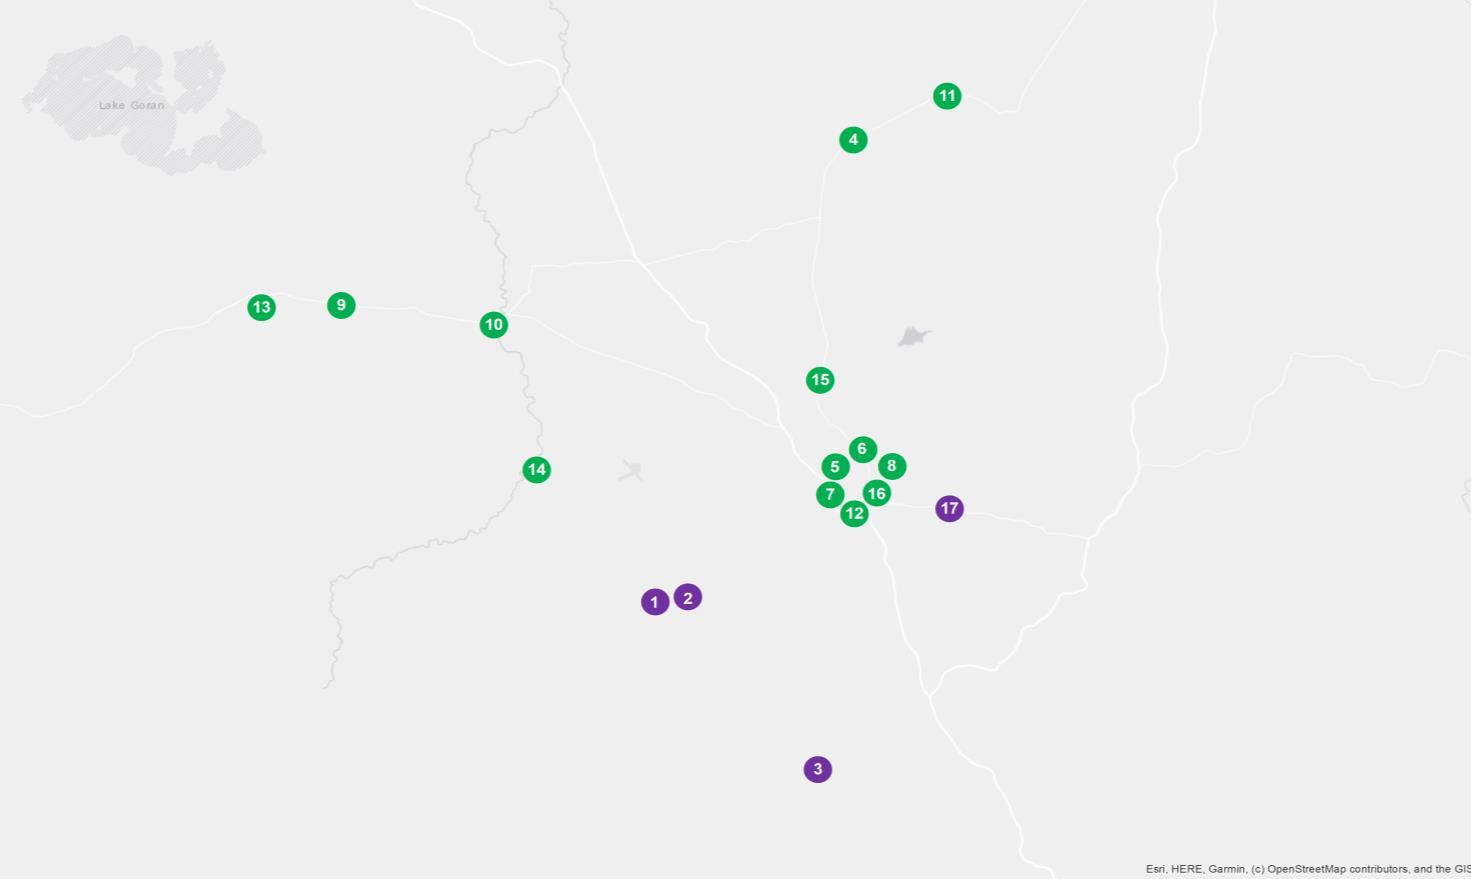
PROJECT DEVELOPMENT MAP 2024-2026 ₳
LIVERPOOL PLAINS


RESEARCH SERVICES
Our research services span over every suburb, LGA,and state within Australia; captured in a variety of standard and customised products, andinclude:
• Advisory and consultancy
• Market analysis including profiling and trends
• Primary qualitative and quantitative research
• Demographic and target market analysis
• Geographic information mapping
• Project analysis including product and pricing recommendations
• Rental and investment return analysis
OUR KNOWLEDGE
Access to accurate and objective research is the foundation of all good property decisions.
OUR PEOPLE
Our research team is made up of highly qualified researchers who focus solely on propertyanalysis.


REFERENCES
* Liverpool Plains market data and key indicators encapsulate aggregate property market conditions within the postcodes of 2339, 2341, 2342 & 2343.
** Estimated values are based on construction value provided by the relevant data authority and does not reflect commercial and/or re-sale value.
# 2025 encapsulates sales transactions for Q1 – Q3 2025 (01/01/2025 – 30/09/2025) only, other years encapsulates sales transactions for the full year (i.e 01/01 to 31/12 of the relevant year).
€ Annual rental growth is a comparison between Q3 2024 (01/07/2024 – 30/09/2024)and Q3 2025 (01/07/2025 – 30/09/2025) house median rent figures.
¥ Liverpool Plains rental market data encapsulates aggregate property conditions within the postcodes of 2339, 2341, 2342 & 2343.
§ Rental yields shown are as reported as of September 2025.
₳ Project development map showcases a sample of upcoming projects only, due to accuracy of addresses provided by the data provider for geocoding purposes.
£ Projects refers to the top developments within the postcodes of 2339, 2341, 2432 & 2343.
µ Estimated value is the value of construction costs provided by relevant data authority, it does not reflect the project’s sale/commercial value.
ψ Commencement date quoted for each project is an approximate only, as provided by the relevant data authority, PRD does not hold any liability to the exact date.
Source: APM Pricefinder, Cordell Connect database, SQM Research, Esri ArcGIS.
Disclaimer: PRD does not give any warranty in relation to the accuracy of the information contained in this report. If you intend to rely upon the information contained herein, you must take note that the information, figures and projections have been provided by various sources and have not been verified by us. We have no belief one way or the other in relation to the accuracy of such information, figures and projections. PRD will not be liable for any loss or damage resulting from any statement, figure, calculation or any other information that you rely upon that is contained in the material.
Prepared by PRD Research. © All medians and volumes are calculated by PRD Research. Use with written permission only. All other responsibilities disclaimed. © Copyright PRD 2025.