
Nagambie Market Update 2nd Half 2025


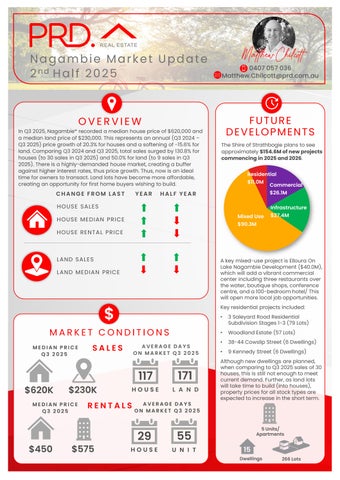
In Q3 2025, Nagambie* recorded a median house price of $620,000and a median land price of $230,000.This represents an annual (Q3 2024 –Q3 2025)price growth of 20.3%for houses and a softening of -15.6% for land. Comparing Q3 2024and Q3 2025,total sales surged by 130.8% for houses (to 30 sales inQ3 2025) and 50.0% forland (to 9 sales in Q3 2025). There is a highly-demanded house market, creating a buffer against higher interest rates, thus price growth. Thus, now is an ideal time forowners to transact. Land lots have become more affordable, creating an opportunity for first home buyers wishing tobuild.


The Shire of Strathbogie plans tosee approximately$154.6Mofnewprojects commencingin2025and2026
HOUSE SALES
FROM LAST HOUSE MEDIAN PRICE
HOUSE RENTAL PRICE
LAND SALES
LAND MEDIAN PRICE

MEDIAN PRICE Q3 2025

MEDIAN PRICE Q3 2025
HALF


DAYS ON MARKET Q3 2025


A key mixed-use project is Elloura On Lake Nagambie Development ($40.0M), which will add a vibrant commercial center including three restaurants over the water, boutique shops, conference centre, and a 100-bedroom hotel/ This will open more local job opportunities. Key residential projects included:
• 3 Saleyard Road Residential Subdivision Stages 1-3 (79 Lots)
• Woodland Estate (57 Lots)
• 38-44 Cowslip Street (6 Dwellings)
• 9 Kennedy Street (6 Dwellings)
Although new dwellings are planned, when comparing to Q3 2025sales of 30 houses, this is still not enough to meet current demand. Further, as land lots will take time to build (into houses), property prices for all stock types are expected to increase in the short term.


AVERAGE VENDOR DISCOUNT*
Average vendor discount reflects the average percentage difference between the first list price and final sold price. A lower percentage difference (closer to 0.0%) suggests that buyers are willing to purchase close to the first asking price of a property.


Average vendor discounts between Q3 2024and Q3 2025 have tightened toa smaller discount of -5.1% for houses, and the peak discount had passed in Q3 2024. The Nagambie* market still favours buyers, as sellers willing to accept below first listed prices. That said, with very little among of dwellings planned over the next two years, buyers need to act quickly.
The suburb ofNagambie has historically outperformed the wider Strathbogie Shire forhouses while remaining on par in median vacant land price. 2025# saw a similar pattern, with prices in the suburb and LGA trending the same direction.
The dominant proportion of homes sold in Nagambie* in 2025#were evenly split between the most affordable price bracket of less than$449,999(26.2%) and the middle-range price bracket of $550,000to $649,999(26.2%), in good news for first home buyers. The premium market continued to perform strongly, with 20.0% houses sold above $750,000. This creates an opportunity for owners to transact and capitalize on their investments. Similarly, most of the vacant land were sold in the premium price bracket of above $275,000(27.3%), which is beneficial toowners. Overall, there is a home forevery budget in Nagambie*.
MARKET COMPARISON
Nagambie (3608) House
Nagambie (3608) Vacant Land
Strathbogie Shire House
Strathbogie Shire Vacant Land
The market comparison graph provides a comparative trend for median price of houses and units over the past 5 years. The main LGA chosen was based on their proximity to the main suburb analysed, which is Nagambie.


PRICE BREAKDOWN 2025#


RENTAL GROWTH 2025€
House rental yield in Nagambie¥ was 4.3%as of September 2025, higher than Northern Victoria (3.0%) and Melbourne Metro (3.1%). This is paired with a 2.3%growth in the median house rental price in the past 12 months to Q3 2025,at $450per week, and a -6.7% decline in the number of houses rented (to 14 rentals in Q3 2025). This confirms an undersupplied house rental market in Nagambie¥, offering an attractive and more affordable investment option to Melbourne Metro.
4- bedroom houses have provided investors with +6.9% rental growth annually, achieving a median rent of $572per week.
Nagambie¥ recorded a vacancy rate of 1.2%in September 2025, below the Northern Victoria average of 1.4% and Sydney Metro’s 1.8%. Vacancy rates have decreased over the past 12 months, indicating an even tighter rental market. Furthermore, a 1.0%vacancy rate is below the Real Estate Institute of Australia’s healthy benchmark of 3.0%, suggesting quicker occupancyof rental homes in Nagambie¥ This confirms a conducive environment for investors, even with a more expensive median house sale price (thus entry price) in the past 12 months to Q3 2025.
RENTAL VACANCY RATES 2025


Nagambie (3608)¥


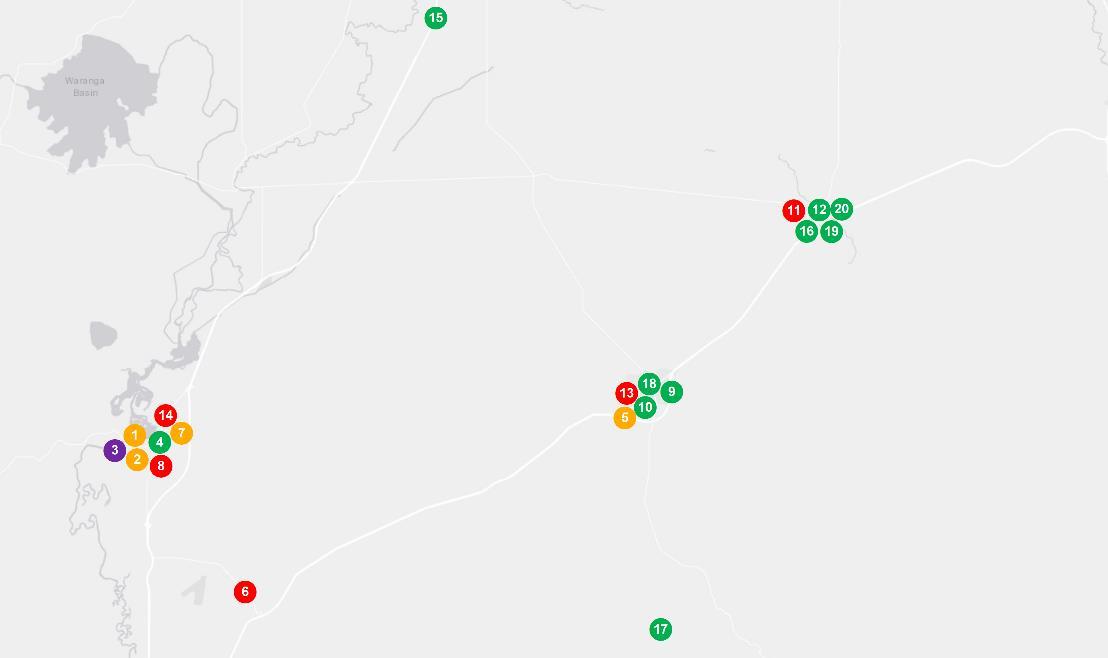
PROJECT DEVELOPMENT MAP 2025-26 ₳

NAGAMBIE

RESEARCH SERVICES
Our research services span over every suburb, LGA,and state within Australia; captured in a variety of standard and customised products, andinclude:
• Advisory and consultancy
• Market analysis including profiling and trends
• Primary qualitative and quantitative research
• Demographic and target market analysis
• Geographic information mapping
• Project analysis including product and pricing recommendations
• Rental and investment return analysis
OUR KNOWLEDGE
Access to accurate and objective research is the foundation of all good property decisions.
OUR PEOPLE
Our research team is made up of highly qualified researchers who focus solely on propertyanalysis.


REFERENCES
* Nagambie sales market data and key indicators encapsulates aggregate property market conditions within the suburbs of Nagambie, Avenel, Murchison, Kirwans Bridge.
** Estimated values are based on construction value provided by the relevant data authority and does not reflect commercial and/or re-sale value.
# 2025 encapsulates sales transactions for Q1 – Q3 (01/01/2025 – 30/09/2025) only, other years encapsulates sales transactions for the full year (i.e 01/01 to 31/12 of the relevant year).
€ Annual rental growth is a comparison between Q3 2024 (01/07/2024 – 30/09/2024)and Q3 2025 (01/07/2025 – 30/09/2025) house median rent figures.
¥ Nagambie rental market data encapsulates aggregate property conditions within the postcode of 3608.
§ Rental yields shown are as reported as of September 2025.
₳ Project development map showcases a sample of upcoming projects only, due to accuracy of addresses provided by the data provider for geocoding purposes.
£ Projects refers to the top developments within the Shire of Strathbogie.
µ Estimated value is the value of construction costs provided by relevant data authority; it does not reflect the project’s sale/commercial value.
ψ Commencement date quoted for each project is an approximate only, as provided by the relevant data authority, PRD does not hold any liability to the exact date.
Source: APM Pricefinder, Cordell Connect database, SQM Research, Esri ArcGIS.
Disclaimer: PRD does not give any warranty in relation to the accuracy of the information contained in this report. If you intend to rely upon the information contained herein, you must take note that the information, figures and projections have been provided by various sources and have not been verified by us. We have no belief one way or the other in relation to the accuracy of such information, figures and projections. PRD will not be liable for any loss or damage resulting from any statement, figure, calculation or any other information that you rely upon that is contained in the material.
Prepared by PRD Research. © All medians and volumes are calculated by PRD Research. Use with written permission only. All other responsibilities disclaimed. © Copyright PRD 2025.