
Mildura Market Update 2nd Half 2025

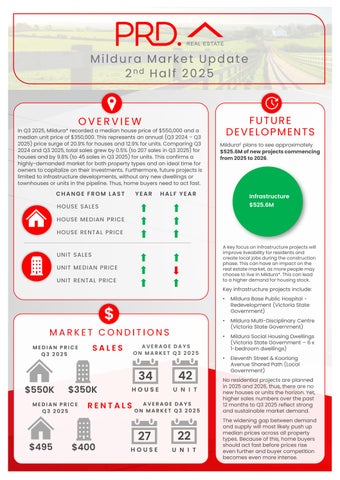
In Q3 2025, Mildura* recorded a median house price of $550,000 and a median unit price of $350,000.This represents anannual (Q3 2024 – Q3 2025)price surge of 20.9%for houses and 12.9%for units. Comparing Q3 2024and Q3 2025,total sales grew by 0.5% (to 207sales in Q3 2025)for houses and by 9.8%(to 45sales in Q3 2025)for units. This confirms a highly-demanded market for both property types and an ideal time for owners tocapitalize ontheir investments. Furthermore, future projects is limited to infrastructure developments, without any new dwellings or townhouses or units in the pipeline. Thus, home buyers need to actfast.
YEAR HALF YEAR CHANGE FROM LAST

HOUSE SALES
HOUSE MEDIAN PRICE
HOUSE RENTAL PRICE UNIT SALES UNIT MEDIAN PRICE
RENTAL PRICE

MEDIAN PRICE Q3 2025


Mildura£ plans to see approximately $525.6Mofnewprojectscommencing from2025to2026

Infrastructure
AVERAGE DAYS ON MARKET Q3 2025
34
$550K $350K
MEDIAN PRICE Q3 2025
Akey focuson infrastructureprojectswill improve liveability forresidentsand createlocal jobsduringthe construction phase.This can have an impacton the real estatemarket,as morepeople may chooseto live in Mildura*.This canlead to a higherdemandfor housingstock.
Key infrastructure projects include:
• Mildura Base Public HospitalRedevelopment (Victoria State Government)
• Mildura Multi-Disciplinary Centre (Victoria State Government)
• Mildura Social Housing Dwellings (Victoria State Government – 6 x 1-bedroom dwellings)
• Eleventh Street & Koorlong Avenue Shared Path (Local Government)
42 $400 HOUSE UNIT
AVERAGE DAYS ON MARKET Q3 2025
27 22 $495
No residential projects are planned in 2025and 2026, thus, there are no new houses or units the horizon. Yet, higher sales numbers over the past 12months to Q32025reflect strong and sustainable market demand.
The widening gap between demand and supply will most likely push up median prices across all property types. Because of this, home buyers should act fast before prices rise even further and buyer competition becomes even more intense.

AVERAGE VENDOR DISCOUNT*
Average vendor discount reflects the average percentage difference between the first list price and final sold price. A lower percentage difference (closer to 0.0%) suggests that buyers are willing to purchase close to the first asking price of a property.


Average vendor discounts between Q3 2024and Q3 2025 have swung from a discount toa premium of 0.8%for houses, and tightened to a smaller discount of -1.0% for units. Housing market conditions in Mildura* have shifted to favor sellers, with buyers having to offer above the first listed price to secure a home. Although the unit market still favourbuyers in Q3 2025,the overall trend is a shift towards sellers. Thus, buyers need to act fast.
The suburb of Mildura has historically preformed relatively on par with the Mildura local Government Area (LGA) in both house and unit prices for the past 5 years. 2025# saw house prices in the suburb becoming a premium, whilst unit remain on par; providing anopportunity forbuyers.
Most of the homes sold in Mildura* in 2025#were in the more affordable price bracket of $400,000to $499,999for houses (27.5%)and in the mid-range price bracket of $300,000to $399,999 forunits (32.2%). This is good news for first home buyers, especially as property prices have increased. The premium price brackets still performed well, with 7.5%houses sold above $700,000and 9.9% units sold above $500,000;which benefits owners.
MARKET COMPARISON
The market comparison graph provides a comparative trend for median price of houses and units over the past 5 years. The main LGA chosen was based on their proximity to the main suburb analysed, which is Mildura.


PRICE BREAKDOWN 2025 #


to $299,999
to $399,999 $400,000 to $499,999 $500,000 and above
RENTAL GROWTH 2025€
House rental yield in Mildura¥ was 4.7% as of September 2025,higher than Mildura LGA’s 4.5% and Melbourne Metro’s 3.1%. This was paired with a 3.6% growth in median house rental price in the past 12 months to Q3 2025,at $495per week; together with a 44.7%surge in the number of house rented (to 259rentals in Q3 2025). The same pattern can be seen in the unit market. This confirms a highly-demanded rental market for both property types. With a more affordable entry price than Melbourne Metro, Mildura¥ is anideal investment alternative for investors.
3+ bedroom houses have provided investors with +7.0%rental growth annually, achieving a median rent of $490per week.
Mildura¥ recorded a vacancy rate of 1.3% in September 2025, below Mildura LGA average’s 1.5% and Melbourne Metro’s 1.8%. Vacancy rates have increased in the past 12months, as investors re-entered to the market. However, a 1.3% vacancyrate is still well below the Real Estate Institution of Australia’s healthy benchmark of 3.0%, indicating quicker occupancy of rental properties in Mildura¥. This creates a conducive and sustainable environment for investors.
RENTAL VACANCY RATES 2025


Mildura¥
Mildura (3500) Mildura LGA Melbourne Metro REIA 'Healthy' Benchmark
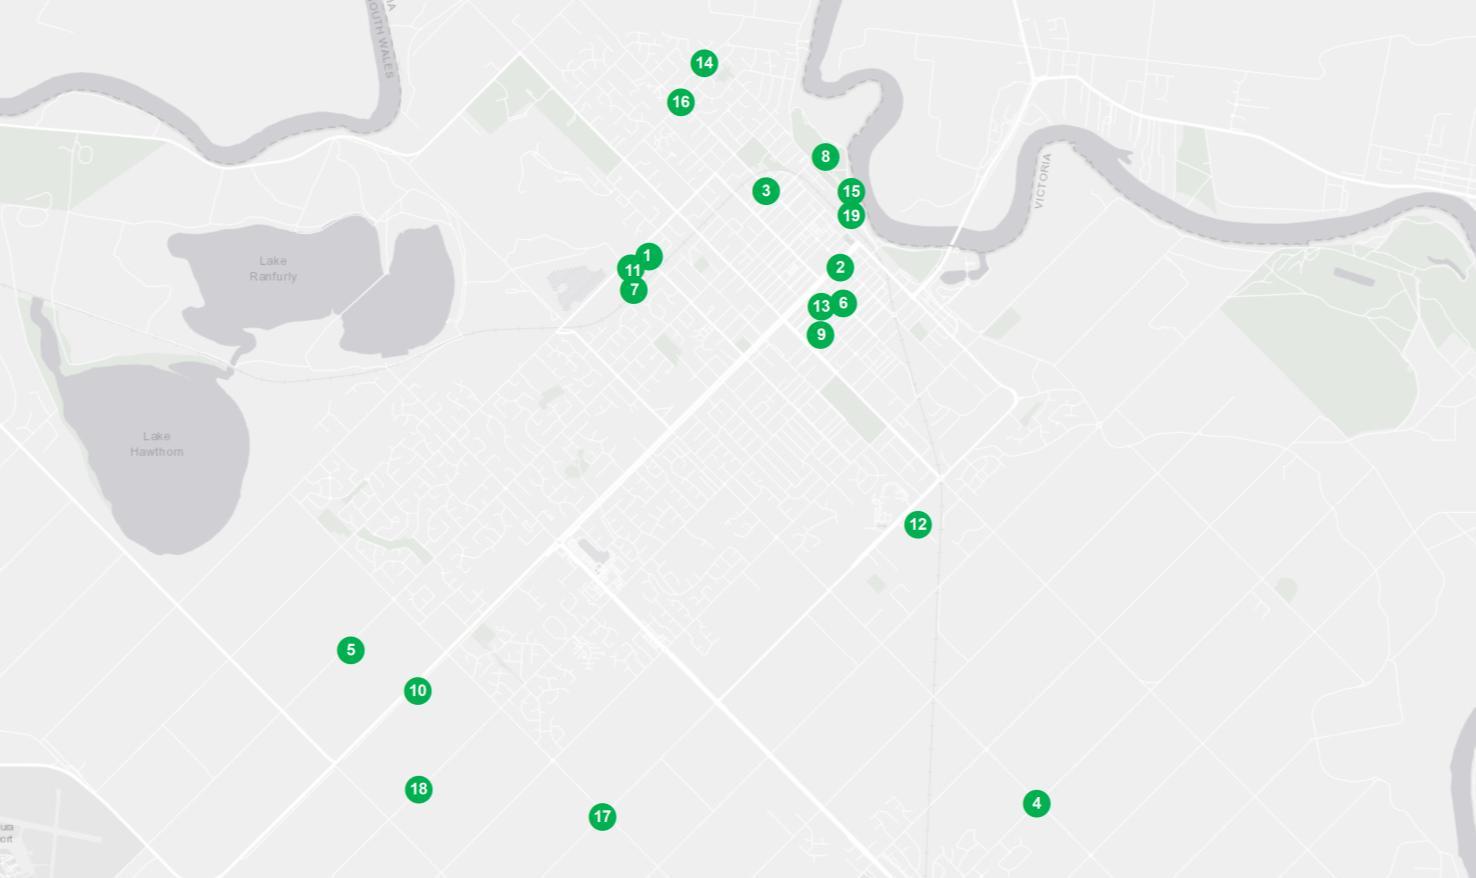
PROJECT DEVELOPMENT MAP 2025-26

MILDURA


RESEARCH SERVICES
Our research services span over every suburb, LGA,and state within Australia; capturedin a variety of standard and customised products, andinclude:
• Advisory and consultancy
• Market analysis including profiling and trends
• Primary qualitative and quantitative research
• Demographic and target market analysis
• Geographic information mapping
• Project analysis including product and pricing recommendations
• Rental and investment return analysis
OUR KNOWLEDGE
Access to accurate and objective research is the foundation of all good property decisions.
OUR PEOPLE
Our research team is made up of highly qualified researchers who focus solely on property analysis.


REFERENCES
* Mildura sales market data and key indicators encapsulates aggregate property market conditions within the suburb of Mildura.
** Estimated values are based on construction value provided by the relevant data authority and does not reflect commercial and/or re-sale value.
# 2024 encapsulates sales transactions for Q1 – Q3 (01/01/2025 – 30/09/2025) only, other years encapsulates sales transactions for the full year (i.e 01/01 to 31/12 of the relevant year).
€ Annual rental growth is a comparison between Q3 2024 (01/07/2024 – 30/09/2024)and Q3 2025 (01/07/2025 – 30/09/2025) house median rent figures.
¥ Mildura rental market data encapsulates aggregate property conditions within the postcode of 3500.
§ Rental yields shown are as reported as of September 2025.
₳ Project development map showcases a sample of upcoming projects only, due to accuracy of addresses provided by the data provider for geocoding purposes.
£ Projects refers to the top developments within the suburb of Mildura.
µ Estimated value is the value of construction costs provided by relevant data authority, it does not reflect the project’s sale/commercial value.
ψ Commencement date quoted for each project is an approximate only, as provided by the relevant data authority, PRD does not hold any liability to the exact date.
Source: APM Pricefinder, Cordell Connect database, SQM Research, Esri ArcGIS.
Disclaimer: PRD does not give any warranty in relation to the accuracy of the information contained in this report. If you intend to rely upon the information contained herein, you must take note that the information, figures and projections have been provided by various sources and have not been verified by us. We have no belief one way or the other in relation to the accuracy of such information, figures and projections. PRD will not be liable for any loss or damage resulting from any statement, figure, calculation or any other information that you rely upon that is contained in the material.
Prepared by PRD Research. © All medians and volumes are calculated by PRD Research. Use with written permission only. All other responsibilities disclaimed. © Copyright PRD 2025.