
Tallebudgera Market Update 2nd Half 2025

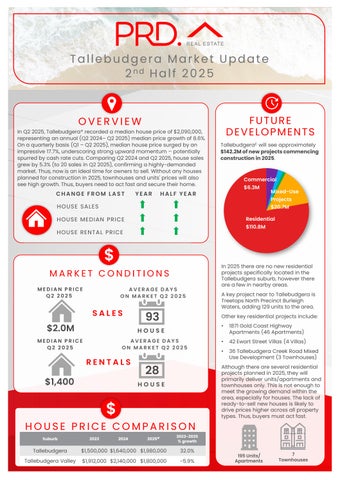
In Q2 2025, Tallebudgera* recorded a median house price of $2,090,000, representing an annual (Q2 2024– Q2 2025) median price growth of 8.6%. On a quarterly basis (Q1 – Q2 2025), median house price surged by an impressive 17.7%, underscoring strong upward momentum – potentially spurred by cash rate cuts. Comparing Q2 2024and Q2 2025,house sales grew by 5.3%(to 20 sales in Q2 2025), confirming a highly-demanded market. Thus, now is an ideal time for owners to sell. Without any houses planned for construction in 2025,townhouses and units' prices will also see high growth. Thus, buyers need to act fast and secure their home.

HOUSE SALES
HALF YEAR CHANGE FROM LAST HOUSE MEDIAN PRICE
HOUSE RENTAL PRICE

CONDITIONS
MEDIAN PRICE Q2 2025


Tallebudgera£ will see approximately $142.2Mofnewprojectscommencing constructionin2025


In 2025there are no new residential projects specifically located in the Tallebudgera suburb, however there are a few in nearby areas.
$2.0M
MEDIAN PRICE Q2 2025
$1,400
AVERAGE DAYS ON MARKET Q2 2025
93
AVERAGE DAYS ON MARKET Q2 2025
28
A key project near to Tallebudgera is Treetops North Precinct Burleigh Waters, adding 129units to the area.
Other key residential projects include:
• 1871Gold Coast Highway Apartments (46 Apartments)
• 42Ewart Street Villas (4 Villas)
• 36 Tallebudgera Creek Road Mixed Use Development (3 Townhouses)
Although there are several residential projects planned in 2025,they will primarily deliver units/apartments and townhouses only. This is not enough to meet the growing demand within the area, especially for houses. The lack of ready-to-sell new houses is likely to drive prices higher across all property types. Thus,buyers must actfast.


AVERAGE VENDOR DISCOUNT*
Average vendor discount reflects the average percentage difference between the first list price and final sold price. A lower percentage difference (closer to 0.0%) suggests that buyers are willing to purchase close to the first asking price of a property.


Average house vendor discounts between Q2 2024and Q2 2025have swung from a premium to a discount, of -3.5%. Market conditions in Tallebudgera* now favour buyers, as vendors are still willing toaccept below the initial listing prices. Although the peak discount period in Q1 2024 (-9.0%) has passed, the current market remains appealing. With no new houses planned, buyers need to actpromptly.
The suburb of Tallebudgera has outperformed the wider Gold Coast Local Government Area (LGA) in median house prices over the past 5years. This continued to be the case in 2025#, with Tallebudgera experiencing stronger and more rapid price growth compared to Gold Coast LGA.
The dominant proportion of houses sold in Tallebudgera* remain within the most affordable price bracket, with its share increasing from 43.5%in 2024(below $1,699,999)to 53.1%in 2025# (below $1,899,999).Notably, even as the most affordable price bracket the entry threshold for this has risen by $200,000,indicating a key window for buyers. Demand for premium homes remained strong, with 37.6% of sales above $2,000,000in 2024and 31.3%above $2,200,000in 2025#;which will continue tobenefit owners.
$2,500,000
$1,500,000 $2,000,000
$1,000,000
$500,000
MARKET COMPARISON
Tallebudgera (4228) House
Gold Coast LGA House Tallebudgera (4228) Unit Gold Coast LGA Unit
The market comparison graph provides a comparative trend for median price of houses and units over the past 5 years. The main LGA chosen was based on their proximity to the main suburb analysed, which is Tallebudgera
PRICE BREAKDOWN
HOUSES SOLD 2024


HOUSES SOLD 2025


Less than$1,899,999
$1,900,000to$1,999,999
$2,000,000to$2,099,999 $2,100,000 to $2,199,999 $2,200,000 and above
RENTAL GROWTH 2025€
House rental yield in Tallebudgera¥ was 3.7% as ofJune 2025, on par Gold Coast Main (3.8%) but higher than Brisbane Metro (3.2%). This is paired with a 16.7% growth in the median house rental price in the past 12months to Q2 2025, to$1,400per week. The number of houses rented has remained stable at 10 rentals in Q2 2025, which suggests a resilient house rental market in Tallebudgera¥. This suggests that there is still room for more investors in the area.
3-bedroom houses have provided investors with a significant +23.5% rental growth annually, achieving a median rent of $1,050per week.
Tallebudgera¥ recorded a vacancyrate of 2.3%in June 2025,above the Gold Coast Main (1.7%). Vacancy rates in Tallebudgera¥ have always fluctuated in the past 3 years, due to the small size of the rental market. That said, onoverall, it has declined in the past 12 months since June 2024, indicating an even tighter market. Further, 2.3%is still below the Real Estate Institute of Australia’s healthy benchmark of 3.0%, suggesting quicker occupancy of rental homes. This is a sustainable environment for investors, even with a higher median house price in Q2 2025.
RENTAL VACANCY RATES 2025

Tallebudgera (4228) Gold Coast Main Brisbane Metro REIA 'Healthy' Benchmark


PROJECT DEVELOPMENT MAP 2025 ₳
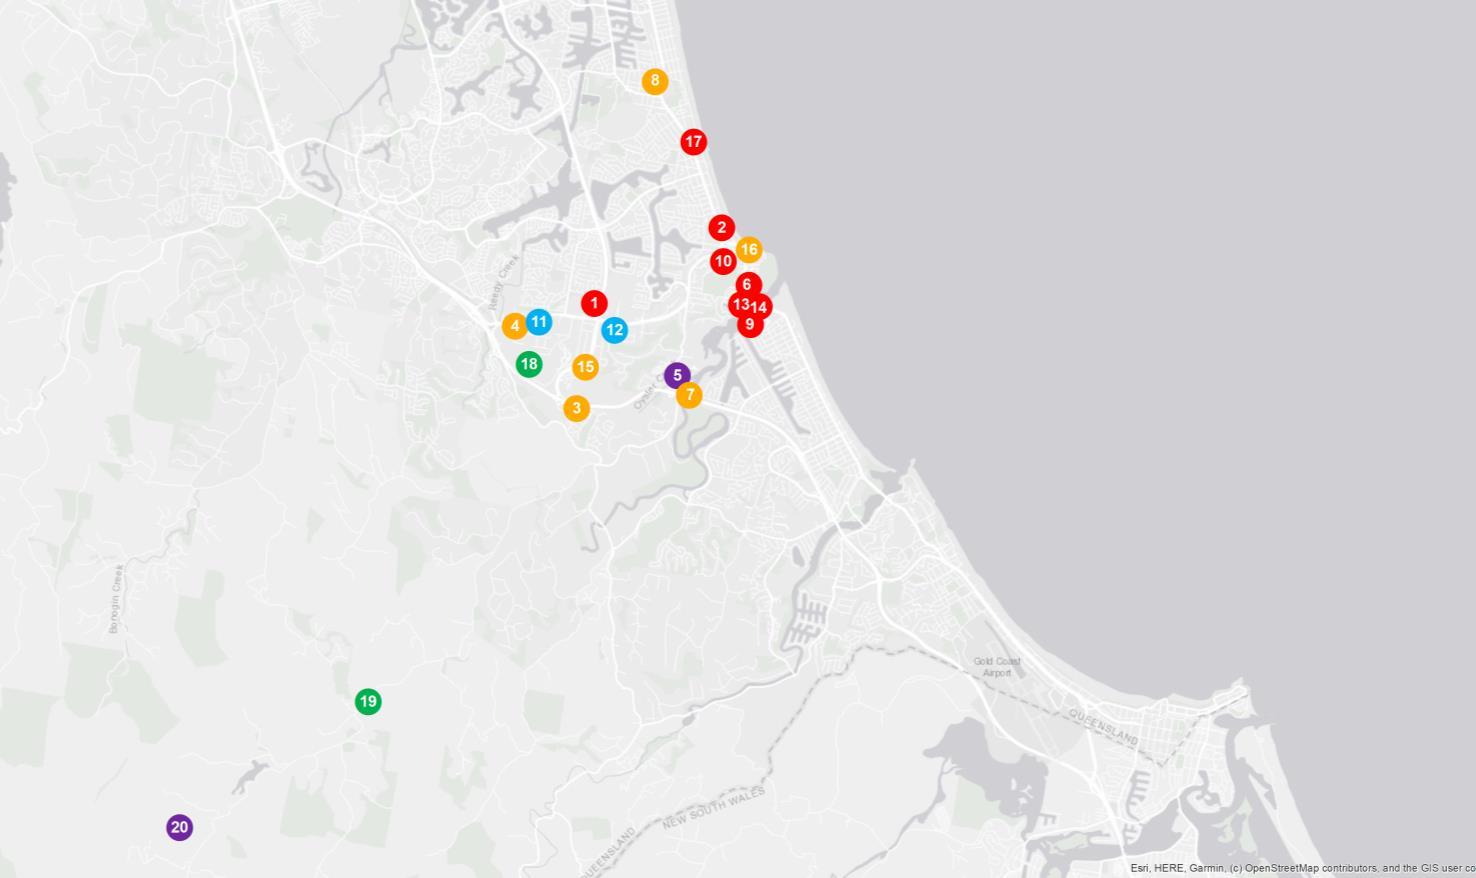

TALLEBUDGERA


RESEARCH SERVICES
Our research services span over every suburb, LGA,and state within Australia; captured in a variety of standard and customised products, andinclude:
• Advisory and consultancy
• Market analysis including profiling and trends
• Primary qualitative and quantitative research
• Demographic and target market analysis
• Geographic information mapping
• Project analysis including product and pricing recommendations
• Rental and investment return analysis
OUR KNOWLEDGE
Access to accurate and objective research is the foundation of all good property decisions.
OUR PEOPLE
Our research team is made up of highly qualified researchers who focus solely on propertyanalysis.


REFERENCES
* Tallebudgera sales market data and key indicators encapsulates aggregate property market conditions within the suburbs of Tallebudgera and Tallebudgera Valley.
** Estimated values are based on construction value provided by the relevant data authority and does not reflect commercial and/or re-sale value.
# 2025 encapsulates sales transactions for 1st half 2025 (01/01/2025 – 30/06/2025) only, other years encapsulates sales transactions for the full year (i.e. 01/01 to 31/12 of the relevant year).
€ Annual rental growth is a comparison between Q2 2024 (01/04/2024 – 30/06/2024) and Q2 2025 (01/04/2025 – 30/06/2025) house median rent figures.
¥ Tallebudgera rental market data encapsulates aggregate property conditions within the postcode of 4228.
§ Rental yields shown are as reported as of June 2025.
₳ Project development map showcases a sample of upcoming projects only, due to accuracy of addresses provided by the data provider for geocoding purposes.
£ Projects refers to the top developments within the postcodes of 4220 and 4228.
µ Estimated value is the value of construction costs provided by relevant data authority, it does not reflect the project’s sale/commercial value.
ψ Commencement date quoted for each project is an approximate only, as provided by the relevant data authority, PRD does not hold any liability to the exact date.
Source: APM Pricefinder, Cordell Connect database, SQM Research, Esri ArcGIS.
Disclaimer: PRD does not give any warranty in relation to the accuracy of the information contained in this report. If you intend to rely upon the information contained herein, you must take note that the information, figures and projections have been provided by various sources and have not been verified by us. We have no belief one way or the other in relation to the accuracy of such information, figures and projections. PRD will not be liable for any loss or damage resulting from any statement, figure, calculation or any other information that you rely upon that is contained in the material.
Prepared by PRD Research. © All medians and volumes are calculated by PRD Research. Use with written permission only. All other responsibilities disclaimed. © Copyright PRD 2025.