Tallebudgera Market Update 1st Half 2025

In Q4 2024, Tallebudgera* recorded a median house price of $1,800,000, representing an annual (Q4 2023– Q4 2024) median price growth of 9.0%for house. Comparing Q4 2023and Q4 2024,house sales declined by -4.0%, to 24sales in Q4 2024.This shows an undersupplied and highly competitive house market, thus an ideal time for owners to capitalize on their investments. On a quarterly basis (Q3 – Q4 2024), median house price declined slightly, by -2.7%, creating a window of opportunity for buyers. However, with no stand-alone houses planned for construction in 2025, buyers need toact fast before further price growth occurs.
CHANGE FROM LAST

HOUSE SALES
HOUSE MEDIAN PRICE
HOUSE RENTAL PRICE


Tallebudgera will see approximately $363.7Mofnewprojectscommencing in2025
YEAR HALF YEAR

MARKET CONDITIONS
MEDIAN PRICE Q4 2024

AVERAGE DAYS ON MARKET Q4 2024
In 2025there are no new residential projects specifically located in the Tallebudgera suburb, however there are a few in nearby areas.
A key project near to Tallebudgera is Burly Residences Miami, adding 100 apartments tothe Tallebudgera area.
Other key projects include:
MEDIAN PRICE Q4 2024
78 $1.8M $1,300
AVERAGE DAYS ON MARKET Q4 2024
17
• Treetops North Precinct Burleigh Waters Units (129Units)
• 1929Gold Coast Highway Apartments (56 Apartments)
• 42Ewart Street Villas (4 Villas)
Although there are new residential projects planned, they will only deliver units/apartments and townhouses, which will only partially address the current stock shortage. The lack of ready-to-sell new houses indicates that the undersupply of houses will persist. This will drive prices up even further, across all property types; thus, limiting opportunities for buyers.


AVERAGE VENDOR DISCOUNT*
Average vendor discount reflects the average percentage difference between the first list price and final sold price. A lower percentage difference (closer to 0.0%) suggests that buyers are willing to purchase close to the first asking price of a property.


Average house vendor discounts between Q4 2023and Q4 2024have tightened slightly to -4.3%. Market conditions in Tallebudgera* still favour buyers, as vendors are still willing to accept below the initial listing prices. Compared to the peak discount time in Q1 2024(-9.0%) the market has seen improvement in buyer sentiment and becoming tighter. With lower interest rates this may stimulate more buyers.
The suburb of Tallebudgera has outperformed the wider Gold Coast Local Government Area (LGA) in median house prices over the past 5years. This continued to be the case in 2024#, with Tallebudgera experiencing stronger and more rapid price growth compared to the LGA market.
The dominant proportion of houses sold in Tallebudgera* has shifted from the most affordable price bracket of below $1,650,000(49.5%) in 2023to the premium price bracket of above $1,950,000(42.0%) in 2024.Despite this shift, demand for most affordable homes is strong in 2024, with 39.8%of sales within the below $1,650,000price range. Thatsaid, there is fewer affordable options available than 12months ago,which suggests that now is the time toac; before further changes in the market occur.
MARKET COMPARISON
Tallebudgera (4228) House
Gold Coast LGA House
The market comparison graph provides a comparative trend for median price of houses and units over the past 5 years. The main LGA chosen was based on their proximity to the main suburb analysed, which is Tallebudgera
HOUSES SOLD 2023


HOUSES SOLD 2024


Less than $1,649,999 $1,650,000 to $1,749,999 $1,750,000 to $1,849,999 $1,850,000 to $1,949,999 $1,950,000 and above
RENTAL GROWTH 2024€
House rental yields in Tallebudgera¥ were 4.3%as of December 2024, higher than Gold Coast Main (3.4%) and Brisbane Metro (3.2%). Thatsaid, median house rental price has declined in the past 12months to Q4 2024, by -8.8% to $1,300per week. The number of houses rented increased significantly to 14rentals in Q4 2024, which suggests that even with a lower median house rent there is still a highly-demanded house rental market; and thus,room for more investors.
4+ bedroom houses have provided investors with +4.0% rental growth annually, achieving a median rent of $1,300per week.
Tallebudgera¥ recorded a vacancyrate of 2.2%in December 2024, above the Gold Coast Main (1.1%). Vacancy rates in Tallebudgera¥ have always fluctuated, due tothe small size of the rental market. That said, on overall, it has declined in the past 12 months,indicating an even tighter market. Further, 2.2%is below the Real Estate Institute of Australia’s healthy benchmark of 3.0%, suggesting quicker occupancy of rental homes. This provides a sustainable environment for investors seeking stable rental returns, even with a higher median house price in Q4 2024.
RENTAL VACANCY RATES 2024

Tallebudgera (4228)

RENTAL YIELD 2024§

PROJECT DEVELOPMENT MAP 2025 ₳
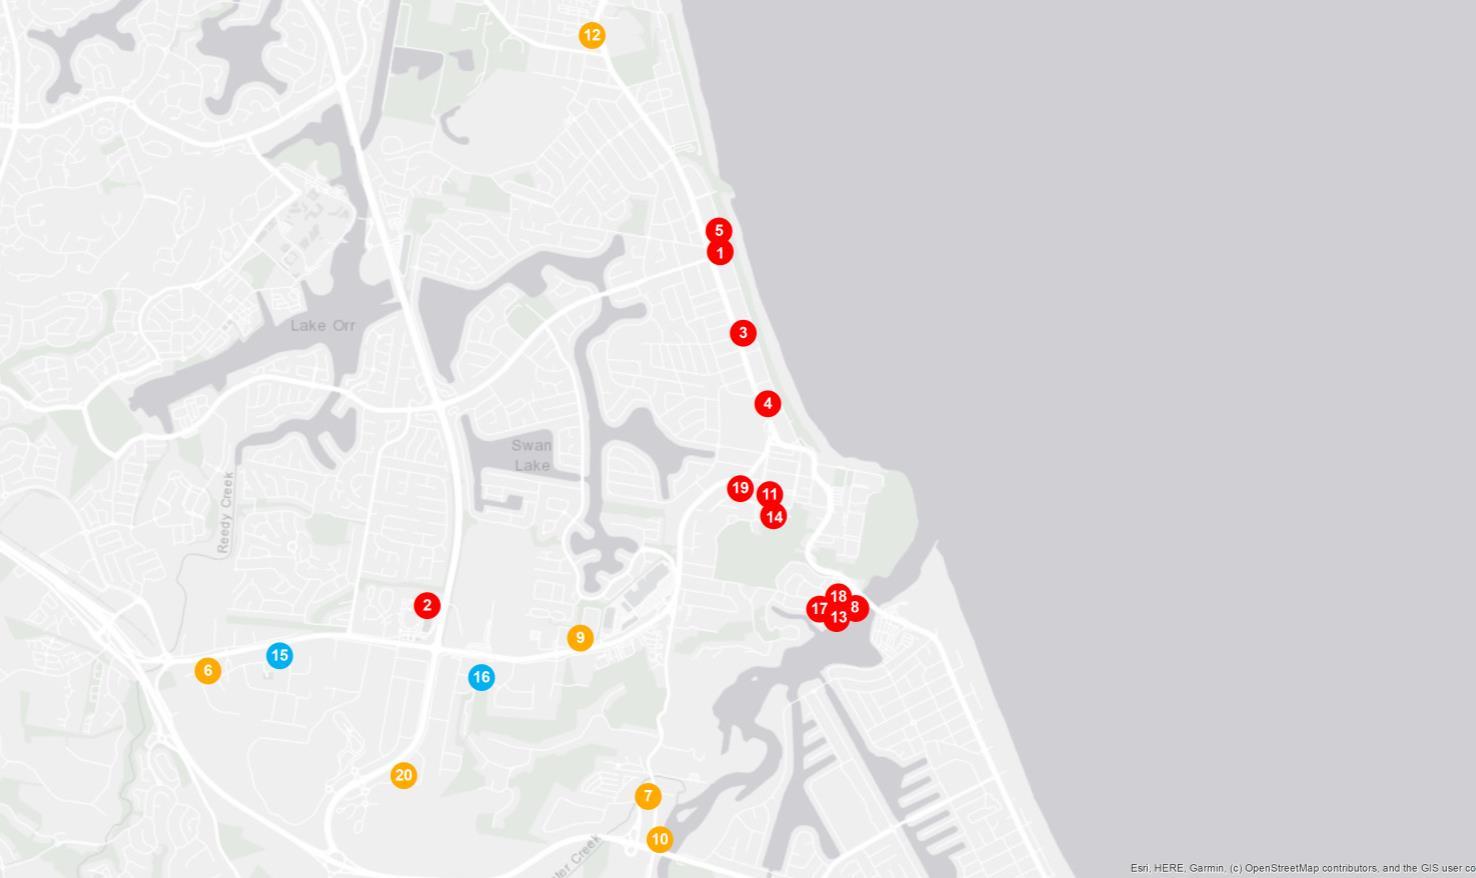

TALLEBUDGERA


RESEARCH SERVICES
Our research services span over every suburb, LGA,and state within Australia; captured in a variety of standard and customised products, andinclude:
• Advisory and consultancy
• Market analysis including profiling and trends
• Primary qualitative and quantitative research
• Demographic and target market analysis
• Geographic information mapping
• Project analysis including product and pricing recommendations
• Rental and investment return analysis
OUR KNOWLEDGE
Access to accurate and objective research is the foundation of all good property decisions.
OUR PEOPLE
Our research team is made up of highly qualified researchers who focus solely on propertyanalysis.


REFERENCES
* Tallebudgera sales market data and key indicators encapsulates aggregate property market conditions within the suburbs of Tallebudgera and Tallebudgera Valley.
** Estimated values are based on construction value provided by the relevant data authority and does not reflect commercial and/or re-sale value.
# 2024 encapsulates sales transactions for the 2024 full year (01/01/2024 – 31/12/2024).
€ Annual rental growth is a comparison between Q4 2023 (01/10/2023 – 31/12/2023)and Q4 2024 (01/10/2024 – 31/12/2024) house median rent figures.
¥ Tallebudgera rental market data encapsulates aggregate property conditions within the postcode of 4228.
§ Rental yields shown are as reported as of December 2024.
₳ Project development map showcases a sample of upcoming projects only, due to accuracy of addresses provided by the data provider for geocoding purposes.
£ Projects refers to the top developments within the postcodes of 4220 and 4228.
µ Estimated value is the value of construction costs provided by relevant data authority, it does not reflect the project’s sale/commercial value.
ψ Commencement date quoted for each project is an approximate only, as provided by the relevant data authority, PRD does not hold any liability to the exact date.
Source: APM Pricefinder, Cordell Connect database, SQM Research, Esri ArcGIS.
Disclaimer: PRD does not give any warranty in relation to the accuracy of the information contained in this report. If you intend to rely upon the information contained herein, you must take note that the information, figures and projections have been provided by various sources and have not been verified by us. We have no belief one way or the other in relation to the accuracy of such information, figures and projections. PRD will not be liable for any loss or damage resulting from any statement, figure, calculation or any other information that you rely upon that is contained in the material.
Prepared by PRD Research. © All medians and volumes are calculated by PRD Research. Use with written permission only. All other responsibilities disclaimed. © Copyright PRD 2025.