
Brighton Market Update 2nd Half 2025

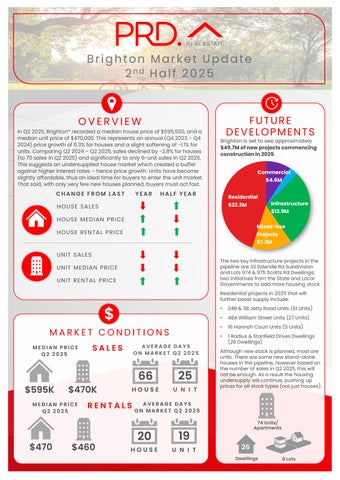
In Q2 2025, Brighton* recorded a median house price of $595,500,and a median unit price of $470,000.This represents anannual (Q4 2023– Q4 2024)price growth of 6.3%for houses and a slight softening of -1.1% for units. Comparing Q2 2024 – Q2 2025, sales declined by -2.8% for houses (to 70sales in Q22025) and significantly to only 6-unit sales in Q2 2025. This suggests an undersupplied house market which created a buffer against higher interest rates – hence price growth. Units have become slightly affordable, thus an ideal time for buyers to enter the unit market Thatsaid, with only very few new houses planned, buyers must actfast.


Brighton is set to see approximately $49.7Mofnewprojectscommencing constructionin2025
FROM LAST HOUSE MEDIAN PRICE HOUSE RENTAL PRICE
HOUSE SALES YEAR HALF YEAR


MEDIAN PRICE Q2 2025 MEDIAN PRICE Q2 2025
$470K
DAYS ON MARKET Q2 2025


The two keyinfrastructure projects in the pipeline are33 Elderslie RdSubdivision and Lots 974 &975 Scotts RdDwellings; two initiatives from the Stateand Local Governments to addmore housing stock.
Residential projects in 2025that will further boost supply include:
• 24B & 38 JettyRoad Units (51 Units)
• 48A William Street Units (27 Units)
• 16Hannah Court Units (5 Units)
• 1 Radius & Stanfield Drives Dwellings (26 Dwellings)
Although new stock isplanned, most are units. There aresome new stand-alone houses in the pipeline, however basedon the number of sales in Q2 2025,this will not be enough. As a result the housing undersupply will continue, pushing up pricesfor all stock types(not just houses).


AVERAGE VENDOR DISCOUNT*
Average vendor discount reflects the average percentage difference between the first list price and final sold price. A lower percentage difference (closer to 0.0%) suggests that buyers are willing to purchase close to the first asking price of a property.


In the past 12months to Q2 2025average house vendor discount have tightened to a lesser discount of -0.4%. Average unit vendor discount have swung to be at a premium, of 1.8%. The house market still favourbuyers, where vendors are willing to accept below the initial listing price. Although the median unit price has softened slightly, sellers are achieving higher than the first asking price. With very low new houses planned, buyers must act fast.
The suburb of Brighton has historically been onpar with the wider Brighton Local Government Area (LGA). In 2025# this trend has continued for both house and unit median prices, with both the suburb and LGA seeing slower price growth.
The dominant proportion of homes sold in Brighton* in 2025# was in the more affordable price point of $449,999 and below (27.6%), in good news for first home buyers. That said, 24.6%of the market was priced in the upper and premium bracket of $750,000and above, which benefits owners/sellers. Most of the units were sold in the middlepriced price bracket between $450,000and $499,999 (28.3%). Overall, this suggests that there is anopportunity for each price bracket, forboth stock types.
MARKET COMPARISON
The market comparison graph provides a comparative trend for the median price of houses and units over the past 5 years. The main LGA profiled was chosen based on their proximity to the main suburb analysed, which is Brighton.


than $399,999
$400,000 to $449,999
$450,000 to $499,999
$500,000 to $549,999
$550,000 and above
RENTAL GROWTH 2025€
House rental yieldsin Brighton (postcode 7030)was4.1% in June 2025,above Hobart Metro (3.5%). This was paired with a slight 1.1% increase in median rent price in the past 12 months to Q2 2025,at $470 perweek. The number of houses rented increased by2.9% in the past 12 months, to 106rentals in Q2 2025;which suggestsa highly demanded market. Median unit rent price rose by7.0% to $460, with astable number of units rented (21 units in Q2 2025). Overall,there is an attractive rental market in the Brighton¥ area,even with a higher entry/saleprice in the past 12 months to Q2 2025.
4+bedroom houses have provided investors with +5.2% rental growth annually, achieving amedian rent of $630 perweek.
The postcode 7030¥ recordeda vacancyrate of 0.3% in June 2025,on parwith Brighton LGA’s(0.3%) however lower than Hobart Metro’s 0.6% average.Vacancy rates in the postcode 7030¥ have fluctuated in the past12months, however in the past3 months have slightly declined even further This suggestsa tighter rental market,which benefits investors Further, a0.3% vacancyrate is still significantly below the Real Estate Institution of Australia’s healthy benchmark of 3.0%,suggesting quicker occupancy of rental homes in the area.
RENTAL VACANCY RATES 2025


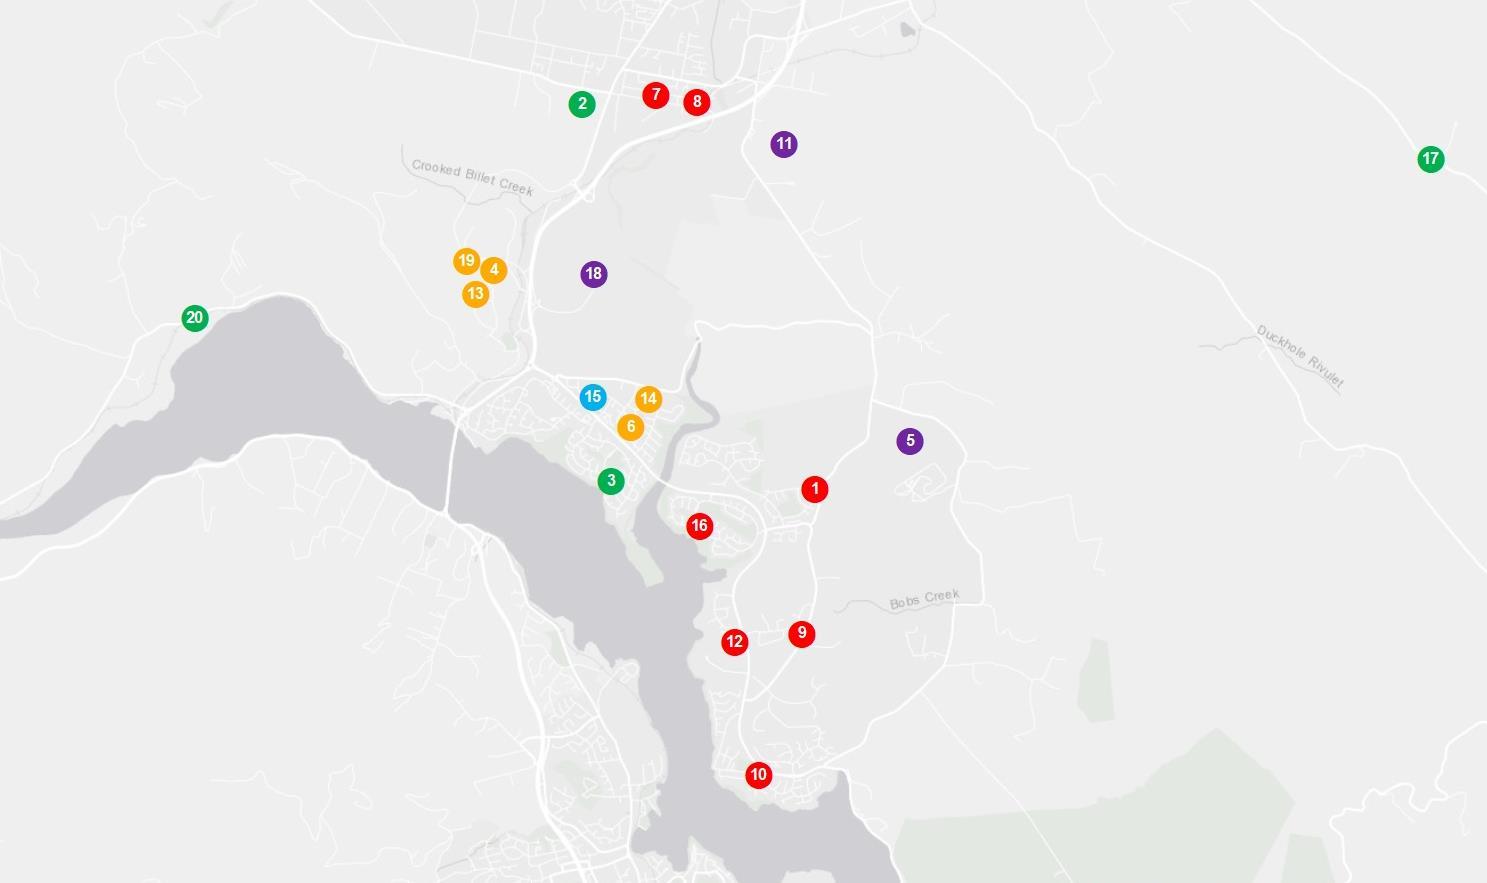
PROJECT DEVELOPMENT MAP 2025 ₳


RESEARCH SERVICES
Our research services span over every suburb, LGA,and state within Australia; captured in a variety of standard and customised products, and include:
• Advisory and consultancy
• Market analysis including profiling and trends
• Primary qualitative and quantitative research
• Demographic and target market analysis
• Geographic information mapping
• Project analysis including product and pricing recommendations
• Rental and investment return analysis
OUR KNOWLEDGE
Access to accurate and objective research is the foundation of all good property decisions.
OUR PEOPLE
Our research team is made up of highly qualified researchers who focus solely on propertyanalysis.


REFERENCES
* Brighton sales market data and key indicators encapsulates aggregate property market conditions within Brighton Local Government Area (LGA)
** Estimated values are based on construction value provided by the relevant data authority and does not reflect commercial and/or re-sale value.
# 2025 encapsulates sales transactions for the 1st Half 2025 (01/01/2025 – 30/06/2025).
€ Annual rental growth is a comparison between Q2 2024 (01/04/2024 – 30/06/2025)and Q2 2025 (04/10/2025 – 30/06/2025) house median rent figures.
¥ Brighton rental market data encapsulates aggregate property conditions within the postcode of 7030.
§ Rental yields shown are as reported as of June 2025.
₳ Project development map showcases a sample of upcoming projects only, due to accuracy of addresses provided by the data provider for geocoding purposes.
£ Projects refers to the top developments within the suburb of Brighton Local Government Area (LGA)
µ Estimated value is the value of construction costs provided by relevant data authority; it does not reflect the project’s sale/commercial value.
ψ Commencement date quoted for each project is an approximate only, as provided by the relevant data authority, PRD does not hold any liability to the exact date.
Source: APM Pricefinder, Cordell Connect database, SQM Research, Esri ArcGIS.
Disclaimer: PRD does not give any warranty in relation to the accuracy of the information contained in this report. If you intend to rely upon the information contained herein, you must take note that the information, figures and projections have been provided by various sources and have not been verified by us. We have no belief one way or the other in relation to the accuracy of such information, figures and projections. PRD will not be liable for any loss or damage resulting from any statement, figure, calculation or any other information that you rely upon that is contained in the material.
Prepared by PRD Research. © All medians and volumes are calculated by PRD Research. Use with written permission only. All other responsibilities disclaimed. © Copyright PRD 2025.