
Blue Mountains Market Update 2
nd Half 2025

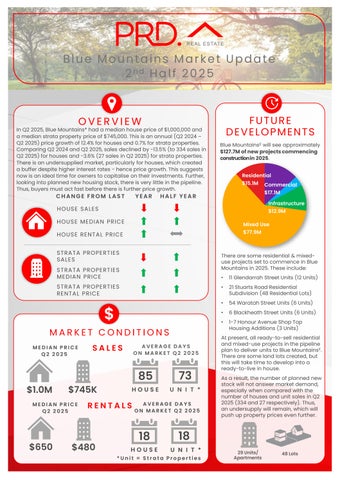
In Q2 2025, Blue Mountains* had a median house price of $1,000,000 and a median strata property price of $745,000.This is anannual (Q2 2024 –Q2 2025)price growth of 12.4%for houses and 0.7% for strata properties Comparing Q2 2024and Q2 2025,sales declined by-13.5% (to 334sales in Q2 2025)for houses and -3.6% (27 sales in Q2 2025) for strata properties
There is an undersupplied market, particularly for houses,which created a buffer despite higher interest rates - hence price growth. This suggests now is an ideal time for owners to capitalise ontheir investments. Further, looking into planned new housing stock, there is very little in the pipeline. Thus,buyers must act fast before there is further price growth.
CHANGE FROM LAST


Blue Mountains£ will see approximately $127.7Mofnewprojectscommencing constructionin2025
YEAR HALF YEAR
HOUSE SALES
HOUSE MEDIAN PRICE
HOUSE RENTAL PRICE
STRATA PROPERTIES SALES
STRATA PROPERTIES
MEDIAN PRICE
STRATA PROPERTIES
RENTAL PRICE

MEDIAN PRICE Q2 2025
$1.0M $745K
MEDIAN PRICE Q2 2025
AVERAGE DAYS ON MARKET Q2 2025
85
AVERAGE DAYS ON MARKET Q2 2025


There are some residential & mixeduse projects set to commence in Blue Mountains in 2025. These include:
• 11 Glendarrah Street Units (12 Units)
• 21Stuarts Road Residential Subdivision (48 Residential Lots)
• 54 WaratahStreet Units (6 Units)
• 6 Blackheath Street Units (6 Units)
• 1-7 Honour Avenue Shop Top Housing Additions (3 Units)
At present, all ready-to-sell residential and mixed-use projects in the pipeline plan todeliver units to Blue Mountains£ There are some land lots created, but this will take time todevelop into a ready-to-live in house.
As a result, the number of planned new stock will not answer market demand, especially when compared with the number of houses and unit sales in Q2 2025(334and 27respectively). Thus, an undersupply will remain, which will push up property prices even further. 73


AVERAGE VENDOR DISCOUNT*
Average vendor discount reflects the average percentage difference between the first list price and final sold price. A lower percentage difference (closer to 0.0%) suggests that buyers are willing to purchase close to the first asking price of a property.


Average vendor discounts between Q2 2024and Q2 2025 have widened to slightly higher discounts of -4.8% for house and -3.0% for strata properties The Blue Mountain market still favours buyers, as sellers are willing to accept below the first listed price. This is good news for buyers, especially with how prices have increased in the past 12 months to Q2 2025. Thatsaid, with no new ready-to-go houses buyers must act fast, before discounts lessen.
The suburb of Springwood has provided a slightly higher median house price than the wider Blue Mountains Local Government Area (LGA) for the past 5years, and an on par median unit price. This has continued in 2025#,with median house and unit prices in the suburb and LGA both growing in the same direction and pace.
Most of the homes sold in the Blue Mountains* in 2024/25# were split somewhat evenly between the most affordable price bracket of less than $849,999(32.3%) and premium price point, of $1.15M and above (28.9%). Strata properties had most sales (31.8%) in the most affordable and middle bracket of $700,000- $799,999(26.5%). This indicates there is a home for every budget in Blue Mountains*.
MARKET COMPARISON
The market comparison graph provides a comparative trend for median price of houses and units over the past 5 years. The main LGA chosen was based on their proximity to the main suburb analysed, which is Springwood.


than$599,999 $600,000to $699,999
$700,000to$799,999
$800,000 to $899,999
$900,000 andabove
Springwood (2777) House Blue Mountains LGA House Springwood (2777) Unit Blue Mountains LGA Unit
RENTAL GROWTH 2025€
House rental yields in Springwood¥ was 3.0%as of June 2025, slightly above the Blue Mountains LGA (2.9%) and the Sydney Metro (2.7%). Further, median house rental price increased by 6.6% in the past 12months to Q2 2025, at $650per week In the same time the number of houses rented decreased, by -15.0% (to 193 houses) in Q2 2025; indicating anundersupply. There is a highly demanded house rental market in Blue Mountains¥, which is beneficial to investors.
3-bedroom houses have provided investors with +8.3%rental growth annually, achieving a median rent of $650per week.
Blue Mountains¥ recorded a vacancy rate of 0.4%in June 2025,well below the Blue Mountains LGA average of 1.0%and Sydney Metro’s 1.6%. Vacancy rates have fluctuated on a month-bymonth basis in the past 12 months, butoverall remained steady, indicating the rental market have remained tight. Further, a 0.4%vacancy rate is well below the Real Estate Institution of Australia’s healthy benchmark of 3.0%, indicating quicker occupancy of rental properties in Springwood¥. This is conducive for investors, even with a higher sale/entry price in Q2 2025.
RENTAL VACANCY RATES 2025


RENTAL YIELD 2025§

Springwood (2777)¥
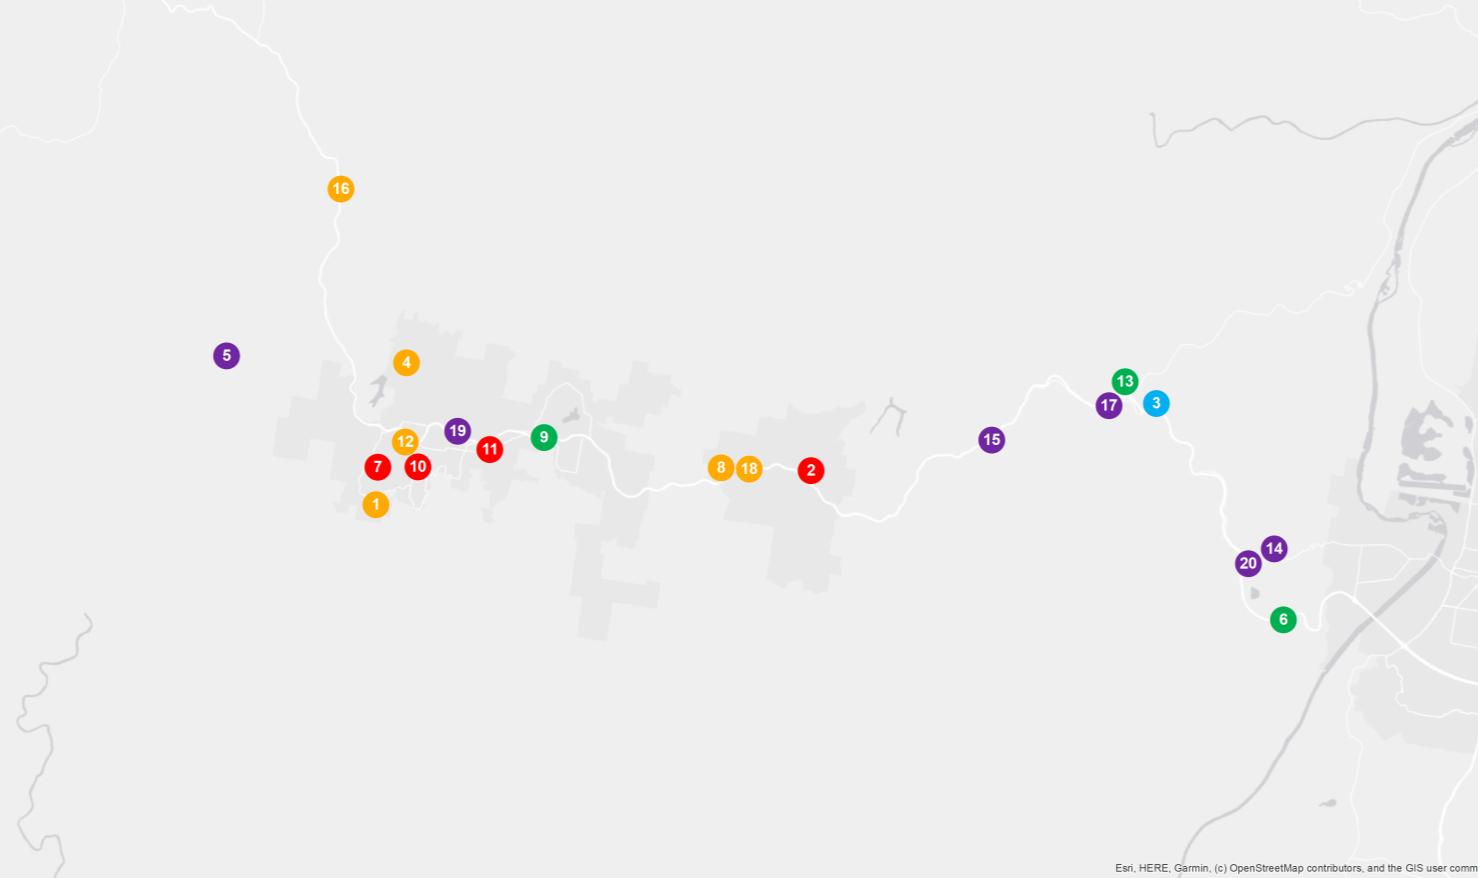
PROJECT DEVELOPMENT MAP 2025 ₳
BLUE MOUNTAINS


RESEARCH SERVICES
Our research services span over every suburb, LGA,and state within Australia; captured in a variety of standard and customised products, andinclude:
• Advisory and consultancy
• Market analysis including profiling and trends
• Primary qualitative and quantitative research
• Demographic and target market analysis
• Geographic information mapping
• Project analysis including product and pricing recommendations
• Rental and investment return analysis
OUR KNOWLEDGE
Access to accurate and objective research is the foundation of all good property decisions.
OUR PEOPLE
Our research team is made up of highly qualified researchers who focus solely on propertyanalysis.


REFERENCES
* Blue Mountains sales market data and key indicators encapsulates aggregate property market conditions within the suburbs of Blue Mountains Local Government Area (LGA).
** Estimated values are based on construction value provided by the relevant data authority and does not reflect commercial and/or re-sale value.
# 2024/25encapsulates sales transactions for the 2024 full year (01/01/2024 – 31/12/2024)and 1st half 2025 (01/01/2025 – 30/06/2025).
€ Annual rental growth is a comparison between Q2 2024 (01/04/2024 – 30/06/2024) and Q2 2025 (01/04/2025 – 30/06/2025) house median rent figures.
¥ Springwood rental market data encapsulates aggregate property conditions within the postcode of 2777.
§ Rental yields shown are as reported as of June 2025.
₳ Project development map showcases a sample of upcoming projects only, due to accuracy of addresses provided by the data provider for geocoding purposes.
£ Projects refers to the top developments within the suburb of Blue Mountains LGA.
µ Estimated value is the value of construction costs provided by relevant data authority, it does not reflect the project’s sale/commercial value.
ψ Commencement date quoted for each project is an approximate only, as provided by the relevant data authority, PRD does not hold any liability to the exact date.
Source: APM Pricefinder, Cordell Connect database, SQM Research, Esri ArcGIS.
Disclaimer: PRD does not give any warranty in relation to the accuracy of the information contained in this report. If you intend to rely upon the information contained herein, you must take note that the information, figures and projections have been provided by various sources and have not been verified by us. We have no belief one way or the other in relation to the accuracy of such information, figures and projections. PRD will not be liable for any loss or damage resulting from any statement, figure, calculation or any other information that you rely upon that is contained in the material.
Prepared by PRD Research. © All medians and volumes are calculated by PRD Research. Use with written permission only. All other responsibilities disclaimed. © Copyright PRD 2025.