
Broome Market Update 2nd Half 2025


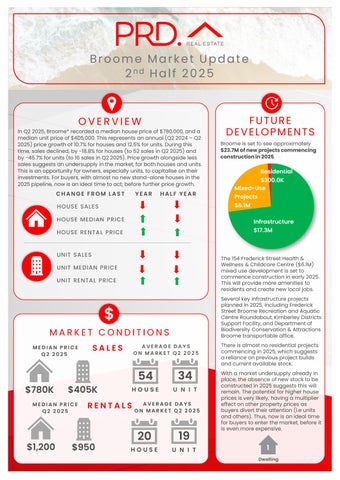
In Q2 2025, Broome* recorded a median house price of $780,000,and a median unit price of $405,000.This represents an annual (Q2 2024– Q2 2025)price growth of 10.7%for houses and 12.5%for units. During this time, sales declined, by -18.8% for houses (to 52 sales in Q2 2025) and by -46.7% for units (to 16 sales in Q2 2025). Price growth alongside less sales suggests an undersupply in the market, for bothhouses and units. This is an opportunity for owners, especially units, tocapitalise on their investments. Forbuyers, with almost no new stand-alone houses in the 2025pipeline, now is anideal time to act; before further price growth. 54
Broome is set to see approximately $23.7Mofnewprojectscommencing constructionin2025
HOUSE SALES YEAR HALF YEAR
FROM LAST HOUSE MEDIAN PRICE HOUSE RENTAL PRICE
SALES
RENTAL PRICE


The 154 Frederick Street Health & Wellness & Childcare Centre ($6.1M) mixed use development is set to commence construction in early 2025. This will provide more amenities to residents and create new local jobs.
Several key infrastructure projects planned in 2025,including Frederick Street Broome Recreation and Aquatic Centre Roundabout, Kimberley Districts Support Facility, and Department of Biodiversity Conservation & Attractions Broome transportable office.
MEDIAN PRICE Q2 2025 MEDIAN PRICE Q2 2025
AVERAGE DAYS ON MARKET
$780K $405K
There is almost noresidential projects commencing in 2025, which suggests a reliance onprevious project builds and current available stock.
With a market undersupply already in place, the absence of new stock to be constructed in 2025suggests this will remain. The potential forhigher house prices is very likely, having a multiplier effect on other property prices as buyers divert their attention (i.e units and others). Thus,now is anideal time for buyers to enter the market, before it is even more expensive.


AVERAGE VENDOR DISCOUNT*
Average vendor discount reflects the average percentage difference between the first list price and final sold price. A lower percentage difference (closer to 0.0%) suggests that buyers are willing to purchase close to the first asking price of a property.


In the past 12months to Q2 2025average vendor discount have remained steady for houses, at -0.5%, buttightened, to a lesser discount of -0.1%, forunits. Both markets still favourbuyers, although very slightly, as vendors are still willing to accept just below the first list price. Q2 2025 discounts are much tighter then 2024,indicating a shift towards a sellers’ market. Thus,buyers must act fast.
The suburb of Broome has historically been onrelative par with the wider Broome Local Government Area (LGA), for both houses and units. This continues to be the case in 2025#,with median prices in both Broome suburb and LGA travelling at the same direction and pace.
The dominant proportion of homes sold in Broome* in 2024/25# was in the middle-range price point of between $650,000- $899,000(54.8%). In good news for buyers the most affordable price bracket of less than $399,999had the second largest number ofsales, at 27.8%.The majority of units sold in 2024/25# were also in the middle price point, between $350,000- $449,999(39.6%). The premium unit market of $550,000and above is growing, at 22.5%of sales. Overall, there is a home for every budget in Broome.
MARKET COMPARISON
The market comparison graph provides a comparative trend for the median price of houses and units over the past 5 years. The main LGA profiled was chosen based on their proximity to the main suburb analysed, which is Broome.


than$249,999
$250,000to $349,999
$350,000 to $449,999
$450,000 to $549,999
$550,000 and above
RENTAL GROWTH 2025€
House rental yieldsin Broome* was 8.2%in June 2025,above Broome LGA (8.3%) and substantially above Perth Metro (3.7%).This waspaired with a 26.3%increase in median rent price in the past 12 months to Q2 2025,at $1,200perweek. The number of houses rented remained steady,35 rentals in Q2 2025;which suggestsahighly demandedmarket. Median unit rent price roseby 46.2%to $950, but the number of units rented decreased,by -22.2%to 14 units in Q2 2025. Thus, an undersupplied unit rental market. Overall,there is a need for more investors in the Broome* rental market.
2 -bedroom houses have provided investors with +36.4% rental growth annually, achieving a median rent of $750per week.
Broome¥ recorded avacancyrate of 0.2% in June 2025,below Broome LGA’s1.0% and Perth's Metro’s 0.8% average.Vacancy rates in Broome¥ have fluctuated in the past 12 months, due to investors responding to interest rate changes. That said, it has declined in the past 6months. This suggestsa tighter rental market. Further, a 0.2%vacancyrate is significantly below the Real Estate Institution of Australia’s healthy benchmark of 3.0%,suggesting quicker occupancy of rental homes in Broome*. Combined with rental yields, this suggestsa conducive and attractive investment environment.
RENTAL VACANCY RATES 2025


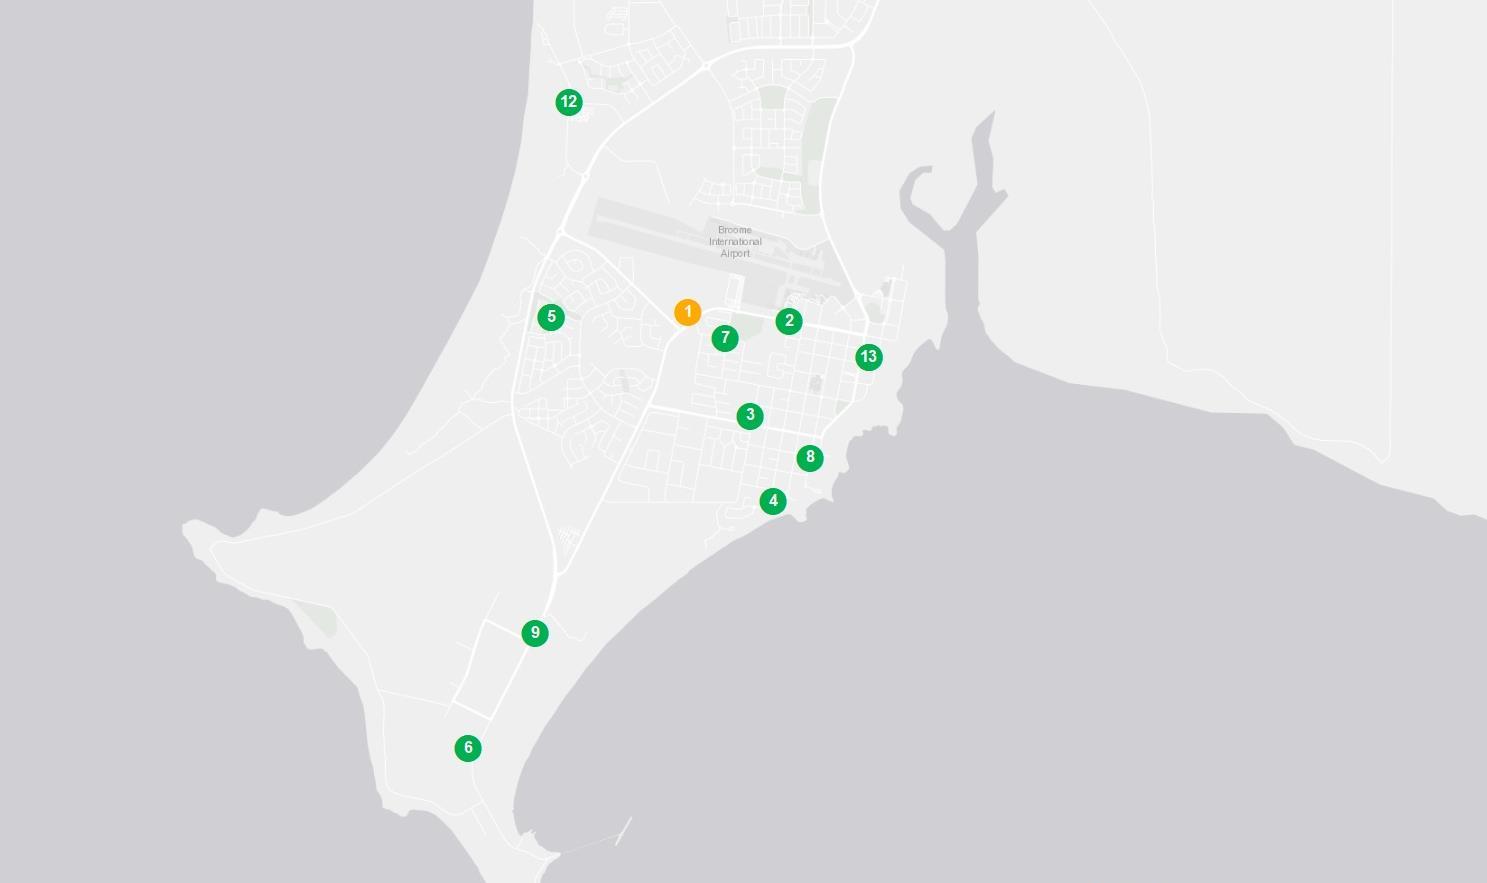
PROJECT DEVELOPMENT MAP 2025 ₳


RESEARCH SERVICES
Our research services span over every suburb, LGA,and state within Australia; captured in a variety of standard and customised products, andinclude:
• Advisory and consultancy
• Market analysis including profiling and trends
• Primary qualitative and quantitative research
• Demographic and target market analysis
• Geographic information mapping
• Project analysis including product and pricing recommendations
• Rental and investment return analysis


OUR KNOWLEDGE
Access to accurate and objective research is the foundation of all good property decisions.
OUR PEOPLE
Our research team is made up of highly qualified researchers who focus solely on propertyanalysis.


REFERENCES
* Broome sales market data and key indicators encapsulates aggregate property market conditions within the suburbs of Broome, Djugun, Bilingurr and Cable Beach.
** Estimated values are based on construction value provided by the relevant data authority and does not reflect commercial and/or re-sale value.
# 2024/25encapsulates sales transactions for the 2024 full year (01/01/2024 – 31/12/2024)and 1st half 2025 (01/01/2025 – 30/06/2025).
€ Annual rental growth is a comparison between Q2 2024 (01/04/2024 – 31/12/2024)and Q2 2025 (01/04/2025 – 30/06/2025) house median rent figures.
¥ Broome rental market data encapsulates aggregate property conditions within the postcode of 6725.
§ Rental yields shown are as reported as of June 2025.
₳ Project development map showcases a sample of upcoming projects only, due to accuracy of addresses provided by the data provider for geocoding purposes.
£ Projects refers to the top developments within the suburbs of Broome, Djugun, Bilingurr and Cable Beach.
µ Estimated value is the value of construction costs provided by relevant data authority, it does not reflect the project’s sale/commercial value.
ψ Commencement date quoted for each project is an approximate only, as provided by the relevant data authority, PRD does not hold any liability to the exact date.
Source: APM Pricefinder, Cordell Connect database, SQM Research, Esri ArcGIS.
Disclaimer: PRD does not give any warranty in relation to the accuracy of the information contained in this report. If you intend to rely upon the information contained herein, you must take note that the information, figures and projections have been provided by various sources and have not been verified by us. We have no belief one way or the other in relation to the accuracy of such information, figures and projections. PRD will not be liable for any loss or damage resulting from any statement, figure, calculation or any other information that you rely upon that is contained in the material.
Prepared by PRD Research. © All medians and volumes are calculated by PRD Research. Use with written permission only. All other responsibilities disclaimed. © Copyright PRD 2024.