


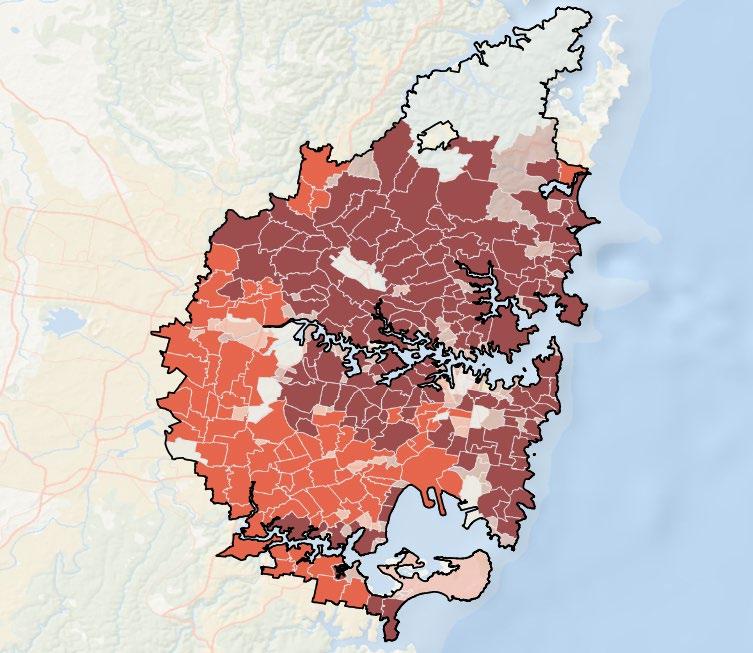
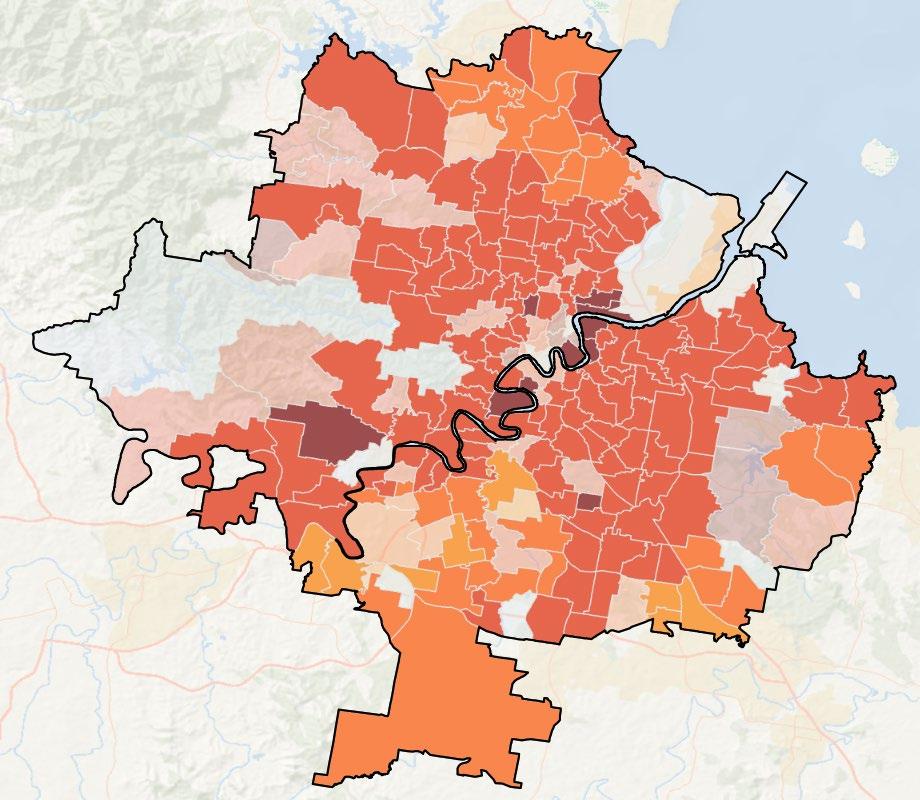
Buying near Sydney doesn’t have to mean compromising on lifestyle or future value. This report highlights key suburbs within 20km of the CBD that strike a balance between value, strong rental yields, and access to everyday essentials like schools, transport, parks and shopping precincts.
The numbers tell a clear story: demand is strong, supply is tight, and the market is shifting. House prices have climbed to $1.55M, up 4.8% in a year, while unit prices dipped slightly to $850K. But here’s the twist: unit sales have exploded by 40.7%. Why? Buyers are chasing affordability and turning to units as house stock dries up.
And that’s the big gap: we simply don’t have enough houses. Developers know it with $11.3B worth of projects in the pipeline, but most of that is unit stock (8,938 units vs. just 1,558 houses). This imbalance creates opportunity: if you’re a buyer, acting now means getting in before house prices climb further. If you’re an investor, units are where the action is, with strong rental demand, low vacancy (1.3%), and yields up to 4.3%.
This guide is for buyers, investors, and anyone looking for smart moves in a competitive market. We’ve spotlighted suburbs that tick the boxes for affordability, growth, and lifestyle These areas aren’t just numbers on a page they’re real opportunities in a market that’s moving fast.
Bottom line: Sydney Metro is a seller’s market with shrinking affordable stock and billions in infrastructure shaping the future. The question isn’t if prices will rise, it’s whether you’ll make your move before they do.


This Smart moves: Capital Cities Edition for Sydney Metro analyses all suburbs within a 20km radius of the Sydney CBD. The following criteria were considered:
• Property trends criteria – all suburbs have a minimum of 20 sales transactions for statistical reliability purposes. Based on market conditions, suburbs have either positive or as close as possible to neutral price growth between 2024 and 2025*.
• Investment criteria – as of September 2025, suburbs considered will have an on-par or higher rental yield than Sydney Metro and an on-par or lower vacancy rate.
• Affordability criteria – identified affordable and liveable suburbs have a median price below the relevant capital city metro area, which in this report is Sydney Metro. We then calculate the percentage premiums that need to be added to the New South Wales (NSW) average home loan, which was $815,865** as of June quarter 2025. Premiums of 60.0% for houses and -28.3% for units were needed to reach the median price of key suburbs (3 for houses and 3 for units) spotlighted in this report. This is below what is required to reach Sydney Metro’s median prices (90.1% for houses and 8.0% for units). This rate makes the chosen suburbs identified in this report more affordable to buyers, creating an opportunity for first home buyers.
• Development criteria – suburbs chosen have new developments commencing construction for 2025, with a high proportion of commercial and infrastructure projects. This ensures the suburbs show signs of sustainable economic growth. Suburbs chosen must also show a reasonable amount of new ready-to-sell stock planned for construction to ensure buyers have access to some new supply.
• Liveability criteria – all identified suburbs have low crime rates, availability of amenities within a 5km radius (i.e., schools, green spaces, public transport, shopping centres and health care facilities), and an unemployment rate on par or lower in comparison to the NSW average (as determined by the Department of Jobs and Small Business, June Quarter 2025 release).


Average house vendor discounts between Q3 2024 and now have remained at a premium, increasing slightly to 3.5%. Average unit vendor discounts have swung from a discount to a slight premium of 0.4%. Sydney continues to favour sellers, as buyers must offer higher than the first list price. There are now premiums for units; thus, buyers must act fast before it increases further.
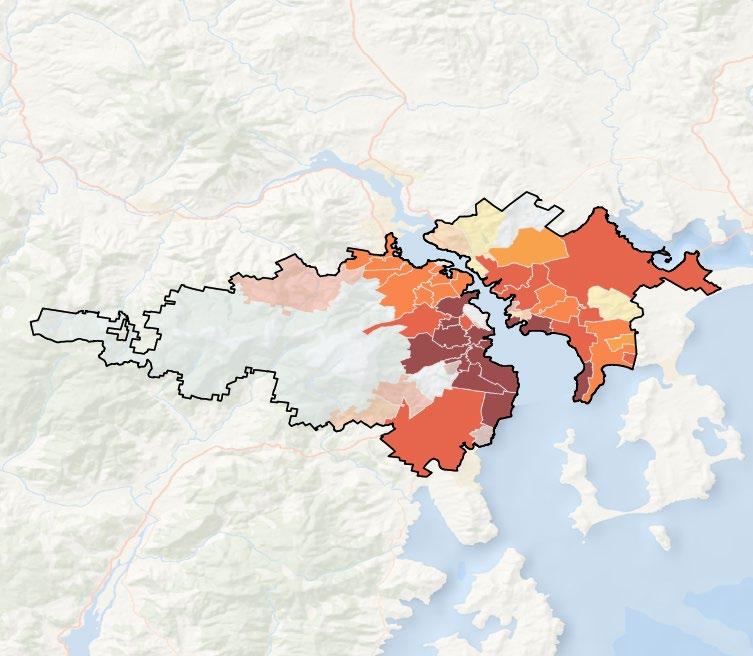
Most of the houses sold in Sydney Metro across 2025# were in the premium price bracket of $1,800,000 and above (68.6%). Most of the units sold were also in the premium price point of $1,000,000 and above (37.1%). There are minimal affordable options when it comes to affordable options for houses, with only 10.0% sold at the most affordable price point of less than $1,199,999. There are more opportunities for first home buyers in the unit's market, as 28.6% of units were sold in the most affordable price point of less than $699,999, but the availability of stock in this price point is shrinking.


$699,999
to $799,999 $800,000 to $899,999 $900,000 to $999,999 $1,000,000 and above


Data not available
$0 - $500,000
$500,000 - $800,000
$800,000 - $1,000,000
House rental yields in Sydney Metro were 2.7% as of September 2025, slightly lower than Melbourne Metro (3.1%) and Brisbane Metro (3.1%). That said, the median house rental price increased by 5.3% in the past 12 months to Q3 2025, at $1000 per week, along with a -0.3% decrease in the number of houses rented (to 4,803 rentals in Q3 2025). The average number of days on the market decreased by -4.3% to 22 days, echoing higher demand for house rentals. The unit rental market is highly demanded, as the median unit rental price increased by 4.0% to $780 per week and the number of units rented increased by 4.9% (25,365 units rented in Q3 2025). Overall, there is strong rental demand for both houses and units, presenting an attractive investment opportunity despite higher property sale prices (especially houses) in the past 12 months.
3 bedroom houses and 3+ bedroom units provided investors with the highest annual rental growth of +10.3% and +8.9%, to achieve $993 and $1,078 per week, respectively. All rental property types have increased in median rental prices.
In September 2025, Sydney Metro recorded a vacancy rate of 1.3%, below Melbourne Metro (1.8%) but higher than Brisbane Metro’s 1.0%. Despite minor fluctuations over the past 12 months, Sydney Metro’s vacancy rate has declined, indicating tighter rental demand. Further, it remains well below the Real Estate Institute of Australia’s benchmark of 3.0%. The result indicates quicker occupancy of rental homes in Sydney Metro, creating a favourable environment for investors.


To widen opportunities for prospective buyers, the below tables provide further alternatives to the top ten suburbs (note: the table below presents seven more suburbs, adding to the 3 houses and 3 unit suburbs explored in the previous sections of the report). The same methodology was applied to select the suburbs below These suburbs were not chosen as key suburbs due to not being able to fulfill one or more of the criteria set but provide an affordable alternative to Sydney Metro median house/unit prices.


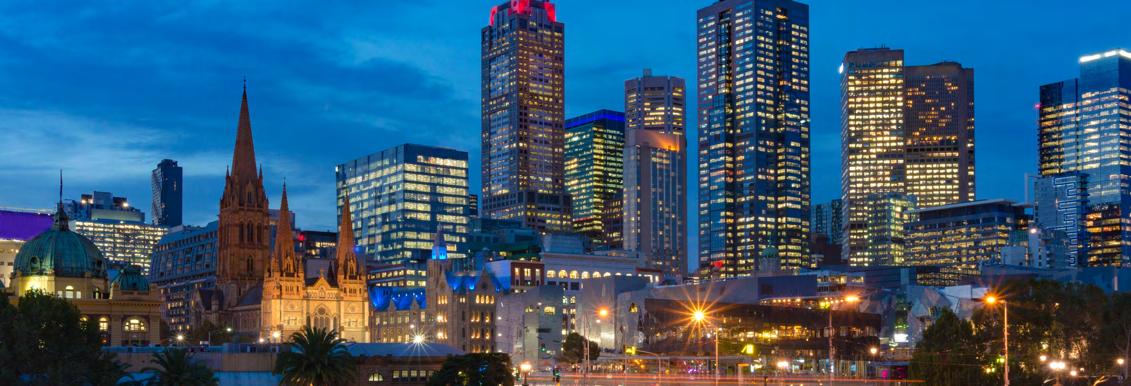
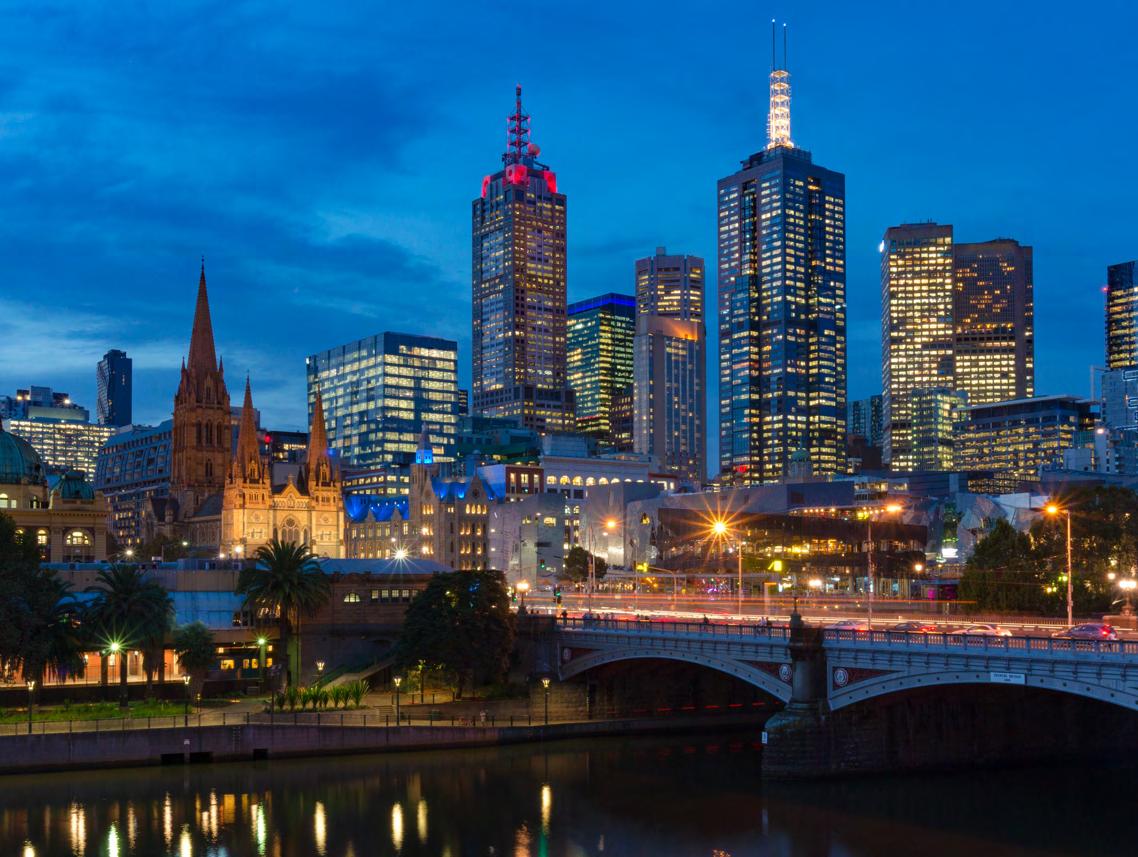
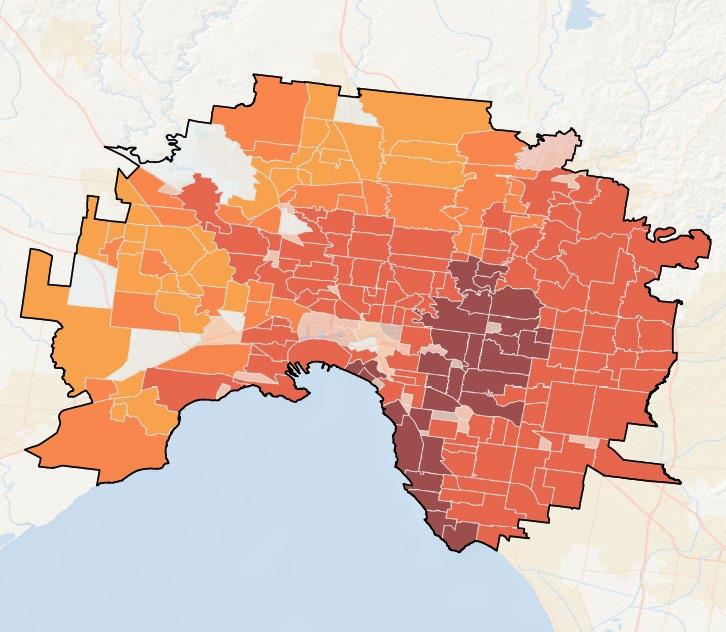
Buying near Melbourne doesn’t have to mean compromising on lifestyle or future value. This report highlights key suburbs within 20km of the CBD that offer the perfect balance of affordability, strong rental yields, and easy access to essentials like schools, transport, parks, and vibrant shopping precincts.
Melbourne’s property market is finding its rhythm again. After years of volatility, prices are stabilising with houses up 2.5% to $953K and units edging up 0.2% to $629K. Sales volumes have also jumped (+11.1% for houses, +7.3% for units). This isn’t just a recovery; it’s a sign of renewed buyer confidence and a more affordable market compared to pre-COVID highs.
The Supply Gap and the Opportunity
But here’s the catch: demand is rising faster than supply. Even with $12.9B in projects planned for 2025, most of the pipeline is skewed toward units (4,873) and townhouses (1,984), with only 855 stand-alone houses in the mix. That imbalance means detached homes will remain scarce and prices will keep climbing. For buyers, the current window of moderate growth is an opportunity to act before the next upswing. For investors, strong rental yields (4.6% for units, 3.1% for houses) and low vacancy (1.8%) make Melbourne a compelling play.
This guide is for buyers, investors, and first-home buyers who want suburbs that balance affordability, growth potential, and lifestyle. We’ve spotlighted areas within 20km of the CBD that tick all the boxes: access to schools, transport, parks, and shopping precincts, while offering smart entry points into a market that’s gearing up for longterm growth
Bottom line: Melbourne is shifting toward a seller’s market. Affordable stock is shrinking, infrastructure investment is booming, and the question isn’t if prices will rise, it’s whether you’ll move before they do.
This Smart Moves: Capital Cities Edition for Melbourne Metro analyses all suburbs within a 20km radius of the Melbourne CBD. The following criteria were considered:
• Property trends criteria – all suburbs have a minimum of 20 sales transactions for statistical reliability purposes. Based on market conditions, suburbs have either positive or as close as possible to neutral price growth between 2024 and 2025*.
• Investment criteria – as of September 2025, suburbs chosen will have an on-par or higher rental yield than Melbourne Metro and an on-par or lower vacancy rate.
• Affordability criteria – chosen affordable and liveable suburbs have a median price below the relevant capital city metro area, which in this report is Melbourne Metro. We calculated the percentage premiums that needed to be added to the Victoria (VIC) average home loan, which was $639,250** as of June Quarter 2025. Premiums of 18.9% for houses and -15.5% for units were needed to reach the median price of suburbs chosen in this report. This percentage is below what is required to reach Melbourne Metro’s median prices (49.2% for houses and -1.6% for units). This makes the chosen suburbs identified in this report more affordable to buyers, creating an opportunity for first home buyers.
• Development criteria – suburbs chosen have new developments commencing construction for 2025, with a high proportion of commercial and infrastructure projects. This ensures the suburbs show signs of sustainable economic growth. Suburbs chosen must also show a reasonable amount of new ready-to-sell stock planned for construction to ensure buyers have access to some new supply.
• Liveability criteria – all identified suburbs have low crime rates, availability of amenities within a 5km radius (i.e., schools, green spaces, public transport, shopping centres and health care facilities), and an unemployment rate on par or lower in comparison to the VIC average (as determined by the Department of Jobs and Small Business, June Quarter 2025 release).


Average vendor discounts have swung to a premium of 1.7% for houses and tightened to a discount of -1.7% for units in the past 18 months to Q3 2025. The Melbourne Metro market currently appears split, with houses favouring sellers as buyers must offer above the first listed price, while units continue to favour buyers. That said, the overall market trend is shifting towards the seller’s market. Therefore, buyers need to act fast.
The dominant proportion sold in Melbourne Metro in 2025# were in the premium price point of $1,100,000 and above for houses (53.4%) and $750,000 and above for units (32.5%). This is beneficial for owners who are looking to capitalise on their investments. That said, the most affordable price brackets are still available, with 23.7% of houses sold at less than $799,999 and 23.9% of units sold at less than $449,999, in good news for first home buyers. Opportunities exist across all price segments within the Melbourne Metro market.


$449,999 $450,000 to $549,999 $550,000 to $649,999 $650,000 to $749,999 $750,000 and above

Data not available
$0 - $500,000
$500,000 - $800,000
$800,000 - $1,000,000
$1,000,000 - $2,000,000
$2,000,000+
20km from CBD
Translucent
House rental yield in Melbourne Metro was 3.1% as of September 2025, outperforming Sydney Metro (2.7%) and on par with Brisbane Metro (3.1%). Median house rental price did decline by -10.8% in the past 12 months to Q3 2025, at $580 per week, along with a significant 170.9% surge in the number of houses rented (to 6,403 rentals) A similar trend can be seen in the unit market, highlighting strong demand across both property types. Despite the short-term rental price adjustments, Melbourne is appealing to long-term investors, especially with a lower entry price than Sydney Metro.
4+ bedroom houses and 1-bedroom units have provided investors with the highest annual rental growth of +1.7% and +19.0%, to achieve $590 and $500 per week, respectively.
In September 2025, Melbourne Metro recorded a vacancy rate of 1.8%, above Sydney Metro (1.3%) and Brisbane Metro (1.0%). Vacancy rates have shown a slight increasing trend over the past 6 months, due to a higher number of investors entering the market. However, Melbourne Metro’s vacancy rate of 1.8% remains well below the Real Estate Institute of Australia‘s benchmark of 3.0%, signalling quicker occupancy of rental properties and, subsequently, rental income cash flow. The result indicates a conducive and sustainable environment for investors, even if the median house and unit sale price (thus, entry price) have increased in the past 12 months to Q3 2025.
1 BEDROOM +19.0% $500

12 11-27 Dorcas Street Mixed Use Development - Middleton Lane (Residential - 246 Apartments + Commercial)

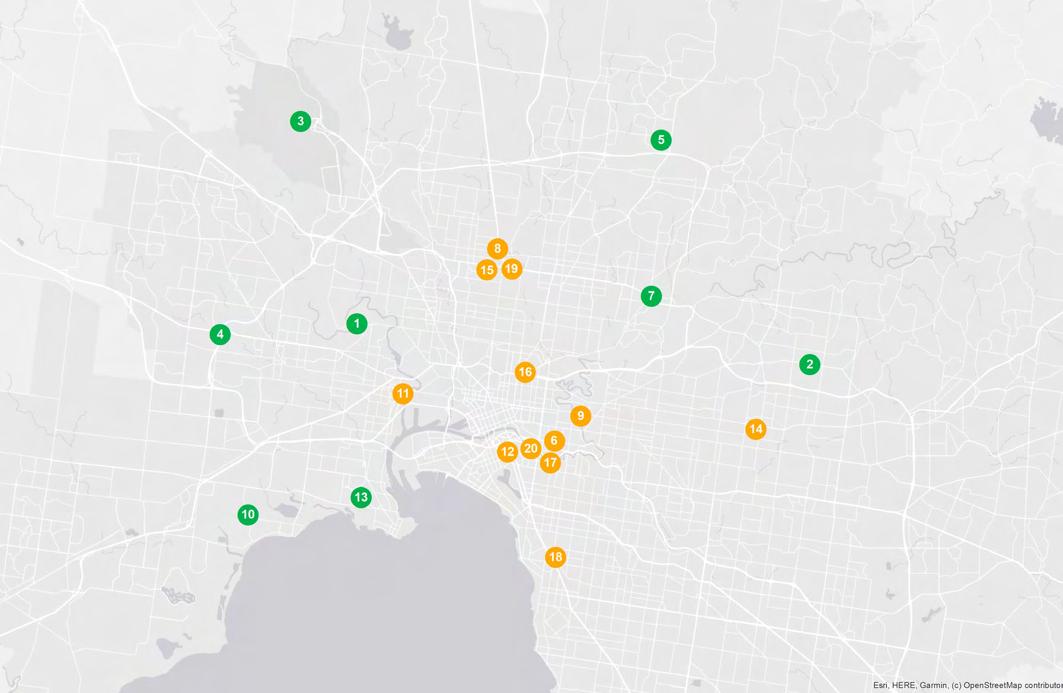


To widen the opportunities for prospective buyers, the below tables provide further alternatives to the top ten suburbs (note: the table below presents seven more suburbs, adding to the 3 house and 3 unit suburbs explored in the previous sections of the report). The same methodology was applied to select the suburbs below. These suburbs were not chosen as key suburbs due to not being able to fulfil one or more of the criteria set but provide an affordable alternative to Melbourne Metro median house/unit prices.


The data paints a clear picture: demand is strong, supply is tight, and the market is at a turning point. House prices have held steady at $740K, while units jumped 9.3% to $590K, a sign that buyers are pivoting to more affordable options. Yet sales volumes have dropped sharply (-22.8% for houses, -35.4% for units), not because demand is falling, but because there’s simply not enough stock.
Here’s the kicker: $922.6M worth of projects are planned for 2025, but most of the new supply is units (203 planned), with only 49 houses and 35 townhouses in the pipeline. That’s nowhere near enough to meet demand. Add to that a vacancy rate of just 0.4% and rising rents, and you’ve got a market where competition will only intensify.

So what dos this mean for you?
For buyers: The recent quarterly dip in prices (-1.3% for houses, -1.7% for units) is a rare window of opportunity before the next upswing.
For investors: Strong rental yields (3.7% for houses, 5.2% for units) and ultra low vacancies make Hobart one of the most attractive markets in the country.
For first-home buyers: We’ve identified suburbs that balance affordability, growth potential, and lifestyle think Warrane, Rokeby, Glenorchy for houses, and New Town, Lindisfarne, Glenorchy for units.
This guide is built for buyers, investors, and anyone looking to make smart moves in a market that’s moving fast. With billions in infrastructure and limited new housing stock, the question isn’t if prices will rise it’s whether you’ll act before they do.
This Smart Moves: Capital Cities Edition for Hobart Metro analyses all suburbs within a 10km radius of the Hobart CBD. The following criteria were considered:
• Property trends criteria – all suburbs have a minimum of 10 sales transactions for statistical reliability purposes. Based on market conditions, suburbs have either positive or as close as possible to neutral price growth between 2024 and 2025*.
• Investment criteria – as of September 2025, suburbs considered will have an on-par or higher rental yield than Hobart Metro and an on-par or lower vacancy rate.
• Affordability criteria – chosen affordable and liveable suburbs have a median price below the relevant capital city metro area, which in this report is Hobart Metro. We then calculate the percentage premiums that need to be added to the Tasmania (TAS) average home loan, which was $481,293** as of June Quarter 2025. Premiums of 22.0% for houses and 3.0% for units were needed to reach the median price of suburbs chosen in this report. This rate is below what is required to reach Hobart Metro’s median prices (51.5% for houses and 14.3% for units). This makes the chosen suburbs identified in this report more affordable to buyers, creating an opportunity for first home buyers.
• Development criteria – suburbs chosen have new developments commencing construction for 2025, with a high proportion of commercial and infrastructure projects. This ensures the suburbs show signs of sustainable economic growth. Suburbs chosen must also show a reasonable amount of new ready-to-sell stock planned for construction to ensure buyers have access to some new supply.
• Liveability criteria – all identified suburbs have low crime rates, availability of amenities within a 5km radius (i.e., schools, green spaces, public transport, shopping centres and health care facilities), and an unemployment rate on par or lower in comparison to the TAS average (as determined by the Department of Jobs and Small Business, in the June Quarter of 2025 release).


Average vendor discounts between Q3 2024 and Q3 2025 have swung from a discount to a premium and are now sitting at 1.0% for houses and 0.0% for units. The Hobart Metro market now favours sellers, as houses are selling slightly above the first list price. This is the first premium occurrence in the past 12 months, which suggests that time is of the essence. With very low new housing supply planned, buyers must act fast before higher premiums occur.
The dominant proportion of houses sold in Hobart Metro in 2025# were in the middle price bracket of $650,000 to $849,999 (34.1%). Conversely, units had most sales in the premium price point of $700,000 and above (28.3%). The more affordable prices are still available, with 27.5% of houses sold at $450,000 - $649,999 and 19.4% of units sold at $400,000 - $499,999. This trend suggests there is a home for every budget in Hobart Metro, an ideal time to transact.


$400,000 to $499,999
$500,000 to $599,999
$600,000 to $699,999
$700,000 and above

Data not available
$0 - $350,000
$350,000 - $500,000
$500,000 - $650,000 $650,000 - $800,000
House rental yields in Hobart Metro were 3.7% as of September 2025, outperforming Sydney and Melbourne Metros (2.7% and 3.1%, respectively). This surge was paired with an 8.2% increase in median house rental price in the past 12 months to Q3 2025, at $595 per week, along with a -7.5% decrease in the number of houses rented (to 566 rentals in Q3 2025). The median unit rental price also increased, by 3.2% in the 12 months to Q3 2025, to $490 per week, and the number of units rented increased by 2.4% (to 345 rentals). This suggests an undersupplied house rental market and a highly demanded unit market, creating a favourable and more affordable investment alternative to Sydney and Melbourne Metro.
2-bedroom houses and 3+ bedroom units provided investors with the highest annual rental growth possible, of +8.3% and +6.9%, at $520 and $620 per week, respectively. All rental property types have increased in median rental prices.
In September 2025, Hobart Metro recorded a vacancy rate of 0.4%, well below Sydney Metro (1.3%) and Melbourne Metro (1.5%). Despite minor fluctuations in the past 6 months, vacancy rates have continued to decline, indicating a tighter rental market. Further, Hobart Metro’s vacancy rate is significantly below the Real Estate Institute of Australia's healthy benchmark of 3.0%. This rise indicates quicker occupancy of rental homes, which is beneficial for investors, even if the median house sales price (thus, entry price) has increased in the past 12 months to Q3 2025.


To widen the opportunities for prospective buyers, the below tables provide further alternatives to the top ten suburbs (note: the table below presents seven more suburbs, adding to the 3 houses and 3 unit suburbs explored in the previous sections of the report). The same methodology was applied to select the suburbs below. These suburbs were not chosen as key suburbs due to not being able to fulfill one or more of the criteria set but provide an affordable alternative to Hobart Metro median house/unit prices.


Buying near Brisbane doesn’t have to mean sacrificing lifestyle or future value. This report showcases key suburbs within 20km of the CBD that deliver the perfect mix of affordability, strong rental yields, and easy access to essentials like schools, transport, parks, and vibrant shopping precincts.
Brisbane is on the move and fast. Median house prices have surged 8.1% to $1.06M, while units jumped 12.4% to $755K, pushing Brisbane past Melbourne as Australia’s second most expensive capital city. But here’s the catch: sales are down for houses by -5.2%, and for units by -23%. That’s not a demand problem; it’s a supply crunch. Fewer listings mean buyers are competing harder, and prices are climbing.
The pipeline for 2025 looks big ($4B in planned projects) but dig deeper and you’ll see the imbalance. Most new stock will be units (2,269) and townhouses (359), plus 1,426 land lots, while only seven stand-alone houses are planned. This shortage of detached homes will keep house prices rising, while units offer a more affordable entry point and strong growth potential
Rental demand is another story: vacancy is just 1.0%, rents are climbing, and yields are healthy 4.1% for units, 3.1% for houses. Investors are seeing a market that’s tight, resilient, and outperforming Sydney and Melbourne.
Buyers who want to act before prices climb further.
Investors chasing strong rental returns and low vacancy.
First-home buyers looking for suburbs that balance affordability, growth, and lifestyle
The suburbs spotlighted in this report aren’t just names on a map; they’re opportunities in a market where timing matters.
Bottom line: Brisbane is a seller’s market with shrinking affordable stock and billions in infrastructure shaping its future. The question isn’t if prices will rise, it’s whether you’ll make your move before they do.
This Smart Moves: Capital Cities Edition for Brisbane Metro analyses all suburbs within a 20km radius of the Brisbane CBD. The following criteria were considered:
• Property trends criteria – all suburbs have a minimum of 20 sales transactions for statistical reliability purposes. Based on market conditions, suburbs have either positive or as close as possible to neutral price growth between 2024 and 2025*.
• Investment criteria – as of September 2025, suburbs chosen will have an on-par or higher rental yield than Brisbane Metro and an on-par or lower vacancy rate.
• Affordability criteria – chosen affordable and liveable suburbs have a median price below the relevant capital city metro area, which in this report is Brisbane Metro. We calculated the percentage premiums that needed to be added to the Queensland (QLD) average home loan, which was $661,590** as of June Quarter 2025. Premiums of 28.5% for houses and 2.8% for units were needed to reach the median price of suburbs chosen in this report. This percentage is below what is required to reach Brisbane Metro’s median prices (60.5% for houses and 14.1% for units). This makes the chosen suburbs identified in this report more affordable to buyers, creating an opportunity for first home buyers.
• Development criteria – suburbs chosen have new developments commencing construction for 2025, with a high proportion of commercial and infrastructure projects. This ensures the suburbs show signs of sustainable economic growth. Suburbs chosen must also show a reasonable amount of new ready-to-sell stock planned for construction to ensure buyers have access to some new supply.
• Liveability criteria – all identified suburbs have low crime rates, availability of amenities within a 5km radius (i.e., schools, green spaces, public transport, shopping centres and health care facilities), and an unemployment rate on par or lower in comparison to the QLD average (as determined by the Department of Jobs and Small Business, June Quarter 2025 release).


Average vendor discounts remained at a premium in the past 12 months to Q3 2025; however, at a higher rate of 1.2% for houses and 2.8% for units. This marks a peak premium for both property types. The Brisbane Metro market continues to favour sellers, with buyers increasingly offering above the first listed prices. Now is an ideal time for owners to sell and maximise their returns.
Most of the homes sold in Brisbane Metro in 2025# were in the premium price point of $1,200,000 and above (53.0%) for houses and $900,000 and above (24.5%) for units. This is beneficial for homeowners looking to capitalise on their investments. The most affordable price brackets are still available, with 17.7% of houses sold for less than $899,999 and 20.9% of units sold for less than $599,999, ingood news for first home buyers The Brisbane Metro market does provide opportunities across all price ranges, however, with the more affordable price points shrinking (in %), buyers must act fast.


$600,000 to $699,999
$700,000 to $799,999
$800,000 to $899,999
$900,000 and above
$500,000 - $800,000
$800,000 - $1,000,000
$1,000,000 - $2,000,000
$2,000,000+
House rental yield in Brisbane Metro was 3.1% as of September 2025, outperforming Sydney Metro (2.7%) and on par with Melbourne Metro (3.1%). This performance was paired with a 1.5% increase in median house rental price in the past 12 months to Q3 2025, at $700 per week, along with a 43.4% surge in the number of houses rented (to 6,701 rentals). A similar trend can be seen in the unit market, which reflects high demand and competitiveness across both property types. This phenomenon creates a favourable environment for investors to re-enter the market, especially with a lower entry price than Sydney Metro.
2-bedroom houses and 2-bedroom units have provided investors with the highest annual rental growth of +0.9% and +9.2%, to achieve $575 and $650 per week, respectively. All rental property types have increased in median rental prices.
In September 2025, Brisbane Metro recorded a low vacancy rate of 1.0%, below Sydney Metro (1.3%) and Melbourne Metro (1.8%). Despite minor fluctuations over the past 6 months, Brisbane Metro’s rental market has remained resilient, consistently recording vacancy rates well below the Real Estate Institute of Australia's healthy benchmark of 3.0%, signalling quicker occupancy of rental properties. This suggests a conducive and sustainable environment for investors, even if the median house sales price (thus, entry price) has increased in the past 12 months to Q3 2025. BRISBANE METRO


To widen the opportunities for prospective buyers, the below tables provide further alternatives to the top ten suburbs (note: the table below presents seven more suburbs, adding to the 3 houses and 3 unit suburbs explored in the previous sections of the report). The same methodology was applied to select the suburbs below. These suburbs were not chosen as key suburbs due to not being able to fulfill one or more of the criteria set but provide an alternative to Brisbane Metro median house/unit prices.

PRD’s property research division provides reliable and unbiased data, insights and consultancy to clients in both metropolitan and regional locations across Australia.
Our extensive research capabilities and specialised approach ensure our clients can make the most informed and financially sound decisions about residential and commercial properties.
Access to accurate and objective research is the foundation of all good property decisions. PRD shares
and decades of knowledge to deliver innovative and effective solutions to
We take a holistic approach and focus on understanding new issues impacting the property industry, such as the environment and sustainability, the economy, demographic and psychographic shifts, and commercial and residential design, and forecast future implications around such issues based on historical data and facts.
Our in-house research team is skilled in deriving macro and micro quantitative information from multiple credible sources, so we can ensure we provide strategic advice and financially sound direction regarding property and market performance.
Our research services span over every suburb, local government area, and state within Australia. We have the ability and systems to monitor market movements, demographic changes and property trends. We use our knowledge of market sizes, price structure and buyer profiles to identify opportunities for clients and provide market knowledge that is unbiased, thorough and reliable.


•
• Market analysis including profiling & trends
• Primary qualitative & quantitative research
• Demographic & target market analysis
• Geographic information mapping
• Project analysis including product & pricing recommendations
• Rental & investment return analysis