
Panania Market Update 2nd Half 2025

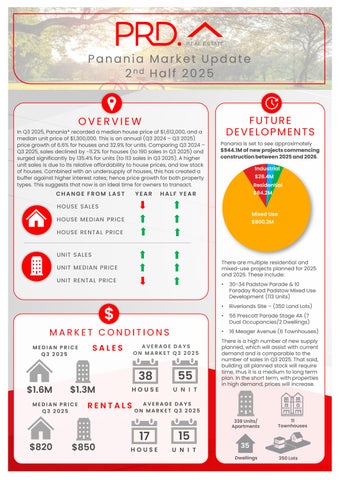
In Q3 2025, Panania* recorded a median house price of $1,612,000,and a median unit price of $1,300,000.This is an annual (Q3 2024 – Q3 2025) price growth of6.6% for houses and 32.9%for units. Comparing Q3 2024 –Q3 2025,sales declined by -11.2% forhouses (to 190 sales in Q3 2025)and surged significantly by 135.4%for units (to 113 sales in Q3 2025).A higher unit sales is due to its relative affordability to house prices, and low stock of houses. Combined with anundersupply of houses, this has created a buffer against higher interest rates; hence price growth for bothproperty types. This suggests that now is an ideal time forowners to transact.

HOUSE SALES YEAR HALF YEAR CHANGE FROM LAST
HOUSE MEDIAN PRICE
HOUSE RENTAL PRICE
SALES
RENTAL PRICE

MEDIAN PRICE Q3 2025
$1.3M AVERAGE DAYS ON MARKET Q3 2025
MEDIAN PRICE Q3 2025


Panania is set tosee approximately $944.1Mofnewprojectscommencing constructionbetween2025and2026


There are multiple residential and mixed-use projects planned for 2025 and 2026.These include:
• 30-34 Padstow Parade & 10 Faraday Road Padstow Mixed Use Development (113 Units)
• Riverlands Site – (350 Land Lots)
• 56 Prescott Parade Stage 4A (7 Dual Occupancies/2 Dwellings)
• 16 Meager Avenue (6 Townhouses)
There is a high number of new supply planned, which will assist with current demand and is comparable to the number of sales in Q32025. That said, building all planned stock will require time, thus it is a medium tolong term plan. In the short term, with properties in high demand, prices will increase.


AVERAGE VENDOR DISCOUNT*
Average vendor discount reflects the average percentage difference between the first list price and final sold price. A lower percentage difference (closer to 0.0%) suggests that buyers are willing to purchase close to the first asking price of a property.


In the past 12months to Q3 2025average house vendor discount have continued to be a premium, however at a slightly higher rate of 3.9%. Average unit vendor discount also expanded, toan even higher premium of 5.6%. The market still favours sellers, where buyers must offer higher than the first list price. With premiums expanding and the time required to build new stock, buyers should actfast.
The suburb of Panania has historically been on par with the wider Georges River Local Government Area (LGA) for houses, while providing a premium market for units. In 2025 # this trend has continued, with price growth in the suburb outpacing that of the wider LGA.
The dominant proportion of homes sold in Panania* in 2025# were in the premium price point of $1,750,000and above (28.2%). House prices remain high in Panania*, but affordable options forfirst homes buyers are available; with 29.7% of houses sold under $1,449,999.Most of the units sold were in the most affordable price point of under $1,149,999(46.8%), providing options in a fast-paced and high price growth market. Overall, there is an opportunity for buyers and sellers, and a home for all budgets.
MARKET COMPARISON
The market comparison graph provides a comparative trend for the median price of houses and units over the past 5 years. The main LGA profiled was chosen based on their proximity to the main suburb analysed, which is Panania.


PRICE BREAKDOWN 2025 #


than $1,149,999
$1,150,000 to $1,249,999 $1,250,000 to $1,349,999 $1,350,000 to $1,449,999 $1,450,000 and above
RENTAL GROWTH 2025€
House rental yields in Panania¥ was 3.4%in September, above the Sydney Metro’s 2.7% yield. This was paired with a 3.1% increase in median rent price in the past 12 months to Q3 2025,at $820per week. At the same time the number of houses rented increased by 0.7%, to 152 rentals in Q3 2025;suggesting a highly demanded market. Thus,the house rental market in Panania¥ creates an ideal investment opportunity; even if median house sales price (thus, entry price) have increased in the past 12 months to Q3 2025.
4+ bedroom houses have provided investors with +8.1% rental growth annually, achieving a median rent of $1,000per week.
Panania¥ recorded a vacancy rate of 0.4% in September 2025,slightly below the CanterburyBankstown LGA’s 0.9%and Sydney Metro’s 1.3% average. Vacancy rates in Panania¥ fluctuated slightly in the past 12months but overall shown a declining pattern. This suggests an even tighter rental market. Further, a 0.4% vacancyrate is significantly below the Real Estate Institution of Australia’s healthy benchmark of 3.0%, thus quicker occupancy of rental homes.
RENTAL VACANCY RATES 2025


Panania¥ (2213)
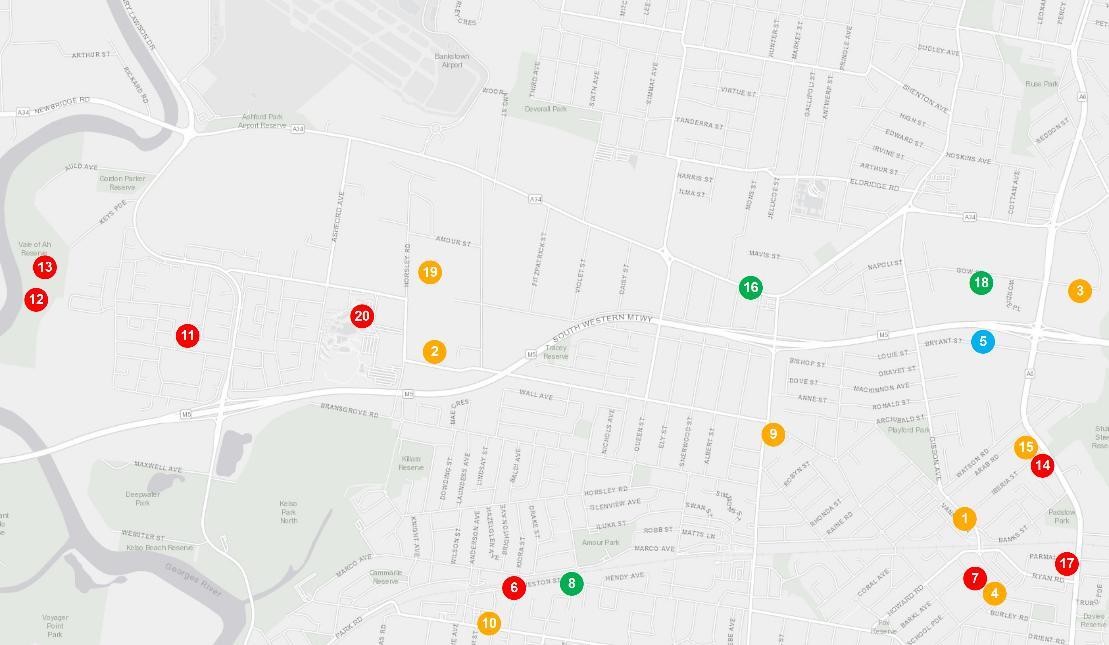
PROJECT DEVELOPMENT MAP 2025-26

PANANIA


RESEARCH SERVICES
Our research services span over every suburb, LGA,and state within Australia; captured in a variety of standard and customised products, andinclude:
• Advisory and consultancy
• Market analysis including profiling and trends
• Primary qualitative and quantitative research
• Demographic and target market analysis
• Geographic information mapping
• Project analysis including product and pricing recommendations
• Rental and investment return analysis
OUR KNOWLEDGE
Access to accurate and objective research is the foundation of all good property decisions.
OUR PEOPLE
Our research team is made up of highly qualified researchers who focus solely on propertyanalysis.


REFERENCES
* Panania sales market data and key indicators encapsulates aggregate property market conditions within the suburbs of Panania, East Hills, Padstow, Picnic Point, Revesby and Milperra.
** Estimated values are based on construction value provided by the relevant data authority and does not reflect commercial and/or re-sale value.
# 2025 encapsulates sales transactions for Q1 – Q3 2025 (01/01/2025 – 30/09/2025) only, other years encapsulates sales transactions for the full year (i.e 01/01 to 31/12 of the relevant year).
€ Annual rental growth is a comparison between Q3 2024 (01/07/2024 – 30/09/2024)and Q3 2025 (01/07/2025 – 30/09/2025) house median rent figures.
¥ Panania rental market data encapsulates aggregate property conditions within the postcode of 2213.
§ Rental yields shown are as reported as of September 2025.
₳ Project development map showcases a sample of upcoming projects only, due to accuracy of addresses provided by the data provider for geocoding purposes.
£ Projects refers to the top developments within the suburbs of Panania, East Hills, Padstow, Picnic Point, Revesby and Milperra.
µ Estimated value is the value of construction costs provided by relevant data authority; it does not reflect the project’s sale/commercial value.
ψ Commencement date quoted for each project is an approximate only, as provided by the relevant data authority, PRD does not hold any liability to the exact date.
Source: APM Pricefinder, Cordell Connect database, SQM Research, Esri ArcGIS.
Disclaimer: PRD does not give any warranty in relation to the accuracy of the information contained in this report. If you intend to rely upon the information contained herein, you must take note that the information, figures and projections have been provided by various sources and have not been verified by us. We have no belief one way or the other in relation to the accuracy of such information, figures and projections. PRD will not be liable for any loss or damage resulting from any statement, figure, calculation or any other information that you rely upon that is contained in the material.
Prepared by PRD Research. © All medians and volumes are calculated by PRD Research. Use with written permission only. All other responsibilities disclaimed. © Copyright PRD 2025.