
Nagambie Market Update 1st Half 2024


CHANGE FROM LAST


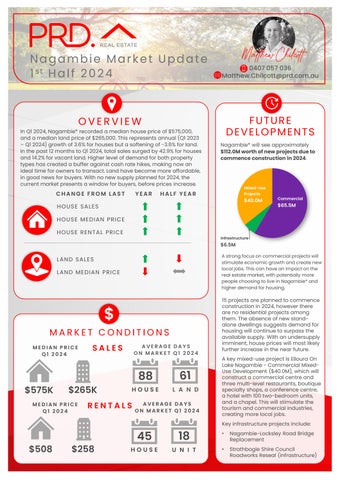
In Q1 2024,Nagambie* recorded a median house price of $575,000, and a median land price of $265,000.This represents annual (Q1 2023 – Q1 2024)growth of 3.6% for houses but a softening of -3.6% for land. In the past 12months to Q1 2024,total sales surged by 42.9%for houses and 14.2%for vacantland. Higher level of demand for both property types has created a buffer against cash rate hikes, making now an ideal time for owners to transact. Land have become more affordable, in good news for buyers. With nonew supply planned for2024, the current market presents a window for buyers, before prices increase 88
YEAR HALF YEAR
HOUSE SALES
HOUSE MEDIAN PRICE
HOUSE RENTAL PRICE
LAND SALES
LAND MEDIAN PRICE

MEDIAN PRICE Q1 2024
$575K $265K
MEDIAN PRICE Q1 2024
AVERAGE DAYS ON MARKET Q1 2024
AVERAGE DAYS ON MARKET Q1 2024
Nagambie* will see approximately $112.0Mworthofnewprojectsdueto commenceconstructionin2024


Astrongfocuson commercial projectswill stimulate economicgrowthandcreate new local jobs.This can havean impact on the real estatemarket,with potentially more people choosingto live in Nagambie*and higherdemandfor housing.
15 projects are planned to commence construction in 2024, however there are noresidential projects among them. The absence of new standalone dwellings suggests demand for housing will continue to surpass the available supply. With anundersupply imminent, house prices will most likely further increase in the near future
A key mixed-use project is Elloura On Lake Nagambie - Commercial MixedUse Development ($40.0M), which will construct a commercial centre and three multi-level restaurants, boutique specialty shops, a conference centre, a hotel with 100 two-bedroom units, and a chapel. This will stimulate the tourism and commercial industries, creating more local jobs.
Key infrastructure projects include:
• Nagambie-Locksley Road Bridge Replacement
• Strathbogie Shire Council
(infrastructure)

AVERAGE VENDOR DISCOUNT*
Average vendor discount reflects the average percentage difference between the first list price and final sold price. A lower percentage difference (closer to 0.0%) suggests that buyers are willing to purchase close to the first asking price of a property.


Average vendor discounts between Q1 2023and Q1 2024 have tightened, to -5.5% for houses and-6.4% forunits. Although peak discount periods forhouses and units have passed in Q4 2022, current discount is still appealing. The markets in Nagambie* still favourbuyers, as sellers are willing to accept below the initial listed price. Now is an ideal time forbuyers to enter the market, before further price increases.
The suburb ofNagambie has historically outperformed the wider Northern Victoria Region for houses but have remained on par with the vacant land. 2024# saw a similar pattern, with a softer price growth in Nagambie.
The dominant proportion of houses sold in Nagambie* in 2023and 2024# were in the upper price bracket between $600,000-$699,999(26.1%). The premium market continue to perform well, with 21.7% sold above $700,000,in good news for owners. Interestingly, 54.1%of vacantland sales were in the middle-range price bracket between $250,000-$299,999. Thatsaid affordable options are still available, with 12.0% of houses sold below $399,999and 8.1%of units sold below $199,999,in good news for first home buyers.
Nagambie (3608) House
NorthernVictoria House Nagambie (3608) Vacant Land
NorthernVictoria Vacant Land
The market comparison graph provides a comparative trend for the median price of houses and vacantland over the past 5 years. The LGA chosen was based on their proximity to the main suburb analysed, which is Nagambie*.


BREAKDOWN 2023-2024#


RENTAL GROWTH 2024€
House rental yields in Nagambie¥ was 3.8% as of April 2024,slightly below Northen Victoria (4.0%), but higher than Melbourne Metro (3.1%). This was paired with a 10.0% increase in median house rental price in the past 12 months, at$508 per week. The number of houses rented declined by -41.7%, indicating an undersupplied rental market. This is good news for investors looking for analternative and more affordable option to Melbourne Metro.
3- bedroom houses have provided investors with +13.1% rental growth annually, achieving a median rent of $475per week.
Nagambie¥ recorded a vacancy rate of2.4%in April 2024. Despite reaching peak levels in July and August 2023,vacancy rates have steadily declined over the past 10 months, which suggests a tighter rental demand. Furthermore, a 2.4% vacancy rate is still below the Real Estate Institute of Australia’s healthy benchmark of 3.0%, thus there is quicker occupancy of rental properties. This confirms Nagambie¥ as a conducive and sustainable environment for investors, even if median house prices increased in the past 12 months to Q1 2024.
RENTAL VACANCY RATES 2024
(3608)

¥

Nagambie
PROJECT DEVELOPMENT MAP 2024 ₳

NAGAMBIA


RESEARCH SERVICES
Our research services span over every suburb, LGA,and state within Australia; captured in a variety of standard and customised products, andinclude:
• Advisory and consultancy
• Market analysis including profiling and trends
• Primary qualitative and quantitative research
• Demographic and target market analysis
• Geographic information mapping
• Project analysis including product and pricing recommendations
• Rental and investment return analysis
OUR KNOWLEDGE
Access to accurate and objective research is the foundation of all good property decisions.
OUR PEOPLE
Our research team is made up of highly qualified researchers who focus solely on propertyanalysis.


REFERENCES
* Nagambie sales market data and key indicators encapsulates aggregate property market conditions within the suburbs of Nagambie, Avenel, Murchison, Kirwans Bridge.
** Estimated values are based on construction value provided by the relevant data authority and does not reflect commercial and/or re-sale value.
# 2024 encapsulates sales transactions for Q1 2024 (01/01/2024 – 31/03/2024) only, other years encapsulates sales transactions for the full year (i.e 01/01 to 31/12 of the relevant year).
€ Annual rental growth is a comparison between Q1 2023 (01/01/2023 – 31/03/2023)and Q1 2024 (01/01/2024 – 31/03/2024) house median rent figures.
¥ Nagambie rental market data encapsulates aggregate property conditions within the postcode of 3608.
§ Rental yields shown are as reported as of April 2024.
₳ Project development map showcases a sample of upcoming projects only, due to accuracy of addresses provided by the data provider for geocoding purposes.
£ Projects refers to the top developments within the Shire of Strathbogie.
µ Estimated value is the value of construction costs provided by relevant data authority, it does not reflect the project’s sale/commercial value.
ψ Commencement date quoted for each project is an approximate only, as provided by the relevant data authority, PRD does not hold any liability to the exact date.
Source: APM Pricefinder, Cordell Connect database, SQM Research, Esri ArcGIS.
Disclaimer: PRD does not give any warranty in relation to the accuracy of the information contained in this report. If you intend to rely upon the information contained herein, you must take note that the information, figures and projections have been provided by various sources and have not been verified by us. We have no belief one way or the other in relation to the accuracy of such information, figures and projections. PRD will not be liable for any loss or damage resulting from any statement, figure, calculation or any other information that you rely upon that is contained in the material.
Prepared by PRD Research. © All medians and volumes are calculated by PRD Research. Use with written permission only. All other responsibilities disclaimed. © Copyright PRD 2024.