
Nagambie Market Update 1st Half 2025


In Q1 2025,Nagambie* recorded a median house price of $645,000and a median land price of $270,000.This represents an annual (Q1 2024 –Q1 2025)price growth of 5.3%for houses and 76% for land. Comparing Q1 2024and Q1 2025,total sales increased by 5.3% forhouses (to 20 sales in Q1 2025) and by 25.0% for land (to 10sales in Q1 2025). There is a high demand for both property types, which created a buffer against higher interest rates. Vacantland experienced higher price and sales volume growth than houses, suggesting buyers are looking into more affordable options. With limited supply available, buyers must actfast.
HALF YEAR CHANGE FROM LAST


The Shire of Strathbogie plans tosee approx.$84.9Mofnewprojectsdueto commenceconstructionin2025
HOUSE SALES
HOUSE MEDIAN PRICE
HOUSE RENTAL PRICE
LAND SALES
LAND MEDIAN PRICE

MEDIAN PRICE Q1 2025
$645K $270K
MEDIAN PRICE Q1 2025
AVERAGE DAYS ON MARKET Q1 2025
153
AVERAGE DAYS ON MARKET Q1 2025
$390 HOUSE UNIT


A main mixed-use project is Elloura On Lake Nagambie Development, which will add a vibrant commercial center including three restaurants over the water, boutique shops, a conference centre, a 100-bedroom hotel, and a chapel.
Residential projects planned include:
• 38-44 Cowslip Street (6 Dwellings)
• 25-29 Racecourse Road Subdivision (23 Lots)
• 9 Kennedy Street (6 Dwellings)
Although there are a few dwellings to be delivered through these projects, it is still insufficient to meet the strong demand. Additionally, the land lots planned will require time to be built and developed. As a result, property prices for all stock types is expected to increase further in the short term.


AVERAGE VENDOR DISCOUNT*
Average vendor discount reflects the average percentage difference between the first list price and final sold price. A lower percentage difference (closer to 0.0%) suggests that buyers are willing to purchase close to the first asking price of a property.


Average vendor discounts between Q1 2024 and Q1 2025 have widened, to-7.4% for houses and -9.9% forland. While peak discount for houses andland occurred in Q3 2024and Q4 2024 respectively, current discounts remain attractive. The Nagambie* market continues to favour buyers, as sellers are willing to accept below the initial listed prices. Now is an ideal time for buyers to act, before further price increases.
The suburb of Nagambie has historically outperformed the wider Strathbogie Shire for houses but have remained on par for median vacant land price. 2025# saw a similar pattern, with a price growth for both property types in Nagambie*.
The dominant proportion of homes sold in Nagambie* in 2024/2025# were in the middle price bracket of $600,000to $699,999(40.7%)for houses and of $250,000to$274,999 (40.6%) for land. The premium market continue toperform well, with 9.9% houses sold above $800,000and 31.3%land sold above$300,000.This creates an opportunity for owners to capitalize on their investments. Affordable options remain available, with 22.2% of houses sold below $499,999and 9.4% of land sold below $224,999;ingoodnews for first home buyers. There is home tosuit every budget in Nagambie*.
MARKET COMPARISON
Nagambie (3608) House
Strathbogie Shire House Nagambie (3608) Vacant Land
Strathbogie Shire Vacant Land
The market comparison graph provides a comparative trend forthe median price of houses and vacantland over the past 5 years. The LGA chosen was based on their proximity to the main suburb analysed, which is Nagambie*.


than $224,999 $225,000 to $249,999
$250,000 to $274,999
$275,000 to $299,999
$300,000 and above
RENTAL GROWTH 2025€
House rental yield in Nagambie¥ was 4.2% as of March 2025,higher than Northen Victoria (3.9%) and Melbourne Metro (3.1%). Median house rental price did soften slightly in the past 12 months to Q1 2025,however, only by -2.8%, sitting at $520per week. In contrast the number of houses rented surged by 37.5% (to 11 rentals in Q 2025). This confirms a highly-demanded house rental market despite slight price adjustment, making it an attractive alternative for investors, especially with more affordable entry (sales) price compared to Melbourne Metro.
4+ bedroom houses have provided investors with +13.2%rental growth annually, achieving a median rent of $600per week.
Nagambie¥ recorded a vacancy rate of 2.0%in March2025. Although vacancy rates have experienced some fluctuations, they have declined over the past six months,indicating tighter rental demand. Furthermore, a 2.0% vacancy rate is still well below the Real Estate Institute of Australia’s healthy benchmark of 3.0%, indicating a quicker occupancy of rental homes. This confirms Nagambie¥ as a sustainable and conducive environment for investors.
RENTAL VACANCY RATES 2025


Nagambie (3608)
PROJECT DEVELOPMENT MAP 2025 ₳
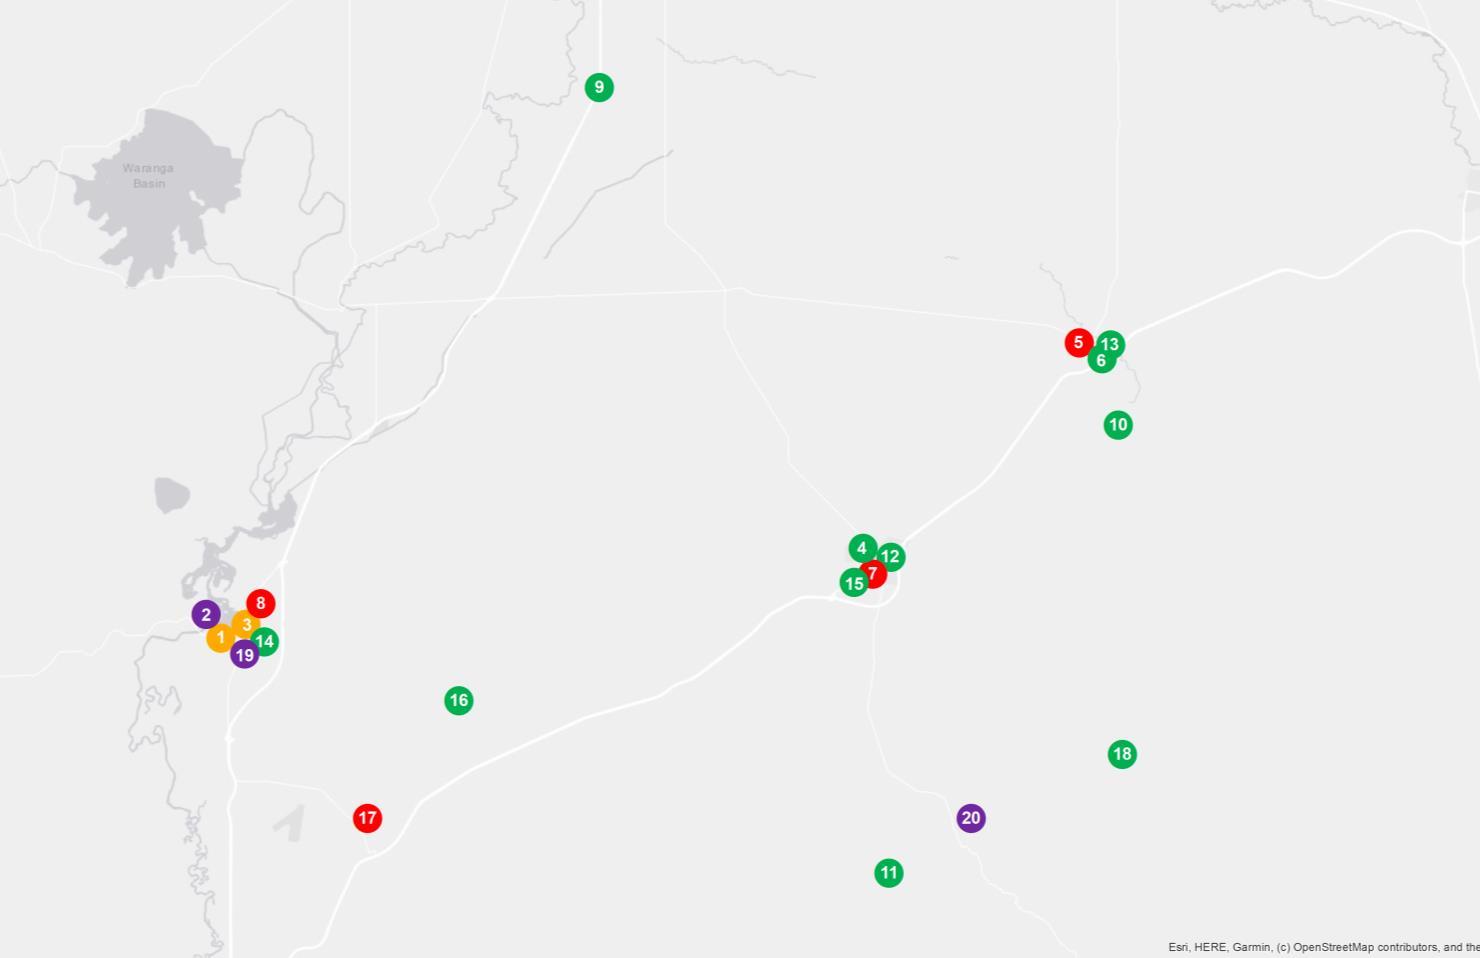

STRATHBOGIE SHIRE


RESEARCH SERVICES
Our research services span over every suburb, LGA,and state within Australia; captured in a variety of standard and customised products, andinclude:
• Advisory and consultancy
• Market analysis including profiling and trends
• Primary qualitative and quantitative research
• Demographic and target market analysis
• Geographic information mapping
• Project analysis including product and pricing recommendations
• Rental and investment return analysis
OUR KNOWLEDGE
Access to accurate and objective research is the foundation of all good property decisions.
OUR PEOPLE
Our research team is made up of highly qualified researchers who focus solely on propertyanalysis.


REFERENCES
* Nagambie sales market data and key indicators encapsulates aggregate property market conditions within the suburbs of Nagambie, Avenel, Murchison, Kirwans Bridge.
** Estimated values are based on construction value provided by the relevant data authority and does not reflect commercial and/or re-sale value.
# 2025 encapsulates sales transactions for Q1 2025 (01/01/2025 – 31/03/2025) only, other years encapsulates sales transactions for the full year (i.e 01/01 to 31/12 of the relevant year).
€ Annual rental growth is a comparison between Q1 2024 (01/01/2024 – 31/03/2024) and Q1 2025 (01/01/2025 – 31/03/2025) house median rent figures.
¥ Nagambie rental market data encapsulates aggregate property conditions within the postcode of 3608.
§ Rental yields shown are as reported as of March 2025.
₳ Project development map showcases a sample of upcoming projects only, due to accuracy of addresses provided by the data provider for geocoding purposes.
£ Projects refers to the top developments within the Shire of Strathbogie.
µ Estimated value is the value of construction costs provided by relevant data authority; it does not reflect the project’s sale/commercial value.
ψ Commencement date quoted for each project is an approximate only, as provided by the relevant data authority, PRD does not hold any liability to the exact date.
Source: APM Pricefinder, Cordell Connect database, SQM Research, Esri ArcGIS.
Disclaimer: PRD does not give any warranty in relation to the accuracy of the information contained in this report. If you intend to rely upon the information contained herein, you must take note that the information, figures and projections have been provided by various sources and have not been verified by us. We have no belief one way or the other in relation to the accuracy of such information, figures and projections. PRD will not be liable for any loss or damage resulting from any statement, figure, calculation or any other information that you rely upon that is contained in the material.
Prepared by PRD Research. © All medians and volumes are calculated by PRD Research. Use with written permission only. All other responsibilities disclaimed. © Copyright PRD 2025.