
Kogarah Market Update 2nd Half 2025

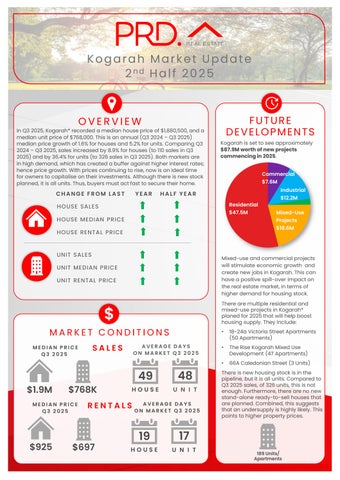
In Q3 2025, Kogarah* recorded a median house price of $1,880,500,and a median unit price of $768,000.This is an annual (Q3 2024 – Q3 2025) median price growth of 1.6% forhouses and 5.2%for units. Comparing Q3 2024– Q3 2025,sales increased by 8.9% for houses (to 110 sales in Q3 2025)and by 36.4%for units (to 326 sales in Q3 2025). Both markets are in high demand, which has created a buffer against higher interest rates; hence price growth. With prices continuing to rise, now is anideal time for owners to capitalise ontheir investments. Although there is new stock planned, it is all units. Thus,buyers must actfast to secure their home.

HOUSE SALES
FROM LAST HOUSE MEDIAN PRICE HOUSE RENTAL PRICE
SALES


Kogarah is set to see approximately $87.9Mworthofnewprojects commencingin2025.
HALF YEAR

PRICE
RENTAL PRICE

MEDIAN PRICE Q3 2025
AVERAGE DAYS ON MARKET Q3 2025
49 $1.9M $768K
MEDIAN PRICE Q3 2025
48
AVERAGE DAYS ON MARKET Q3 2025
$697 HOUSE UNIT


Mixed-use and commercial projects will stimulate economic growth and create new jobs in Kogarah. This can have a positive spill-over impact on the real estate market, in terms of higher demand for housing stock.
There are multiple residential and mixed-use projects in Kogarah* planed for 2025that will help boost housing supply. They include:
• 18-24a Victoria Street Apartments (50 Apartments)
• The Rise Kogarah Mixed Use Development (47 Apartments)
• 66A Caledonian Street (3 Units)
There is new housing stock is in the pipeline, but it is all units. Compared to Q3 2025sales, of 326 units, this is not enough. Furthermore, there are no new stand-alone ready-to-sell houses that are planned. Combined, this suggests that an undersupply is highly likely. This points to higher property prices.
19 17 189Units/ Apartments $925

AVERAGE VENDOR DISCOUNT*
Average vendor discount reflects the average percentage difference between the first list price and final sold price. A lower percentage difference (closer to 0.0%) suggests that buyers are willing to purchase close to the first asking price of a property.


In the past 12months to Q3 2025average house vendor discount have continued to be at a premium, but ata higher rate of 8.4%. Average unit vendor discount have tightened to a lesser discount of -0.7%. The house market continues tofavour sellers, as buyers must offer higher than the first list price. Units still favourbuyers for the time being, however, the room to negotiate is becoming much smaller. With limited stock, unit buyers must actfast.
The suburb of Kogarah has historically been onpar with the wider Georges River Local Government Area (LGA). In 2025# this trend has continued for both house and unit median prices, with median house prices in the suburb rising to meet the wider LGA.
The dominant proportion of homes sold in Kogarah* in 2025# was in the most affordable price bracket of less than $1,649,999(26.6%); which is good new for buyers due to rising prices. However, the premium market of $2.2M and above is still strong (22.0% of sales), which benefits owners. Most of the units sold were in the more affordable bracket (24.8%) and middle (22.9%) price brackets, thus there is a home for every budget in Kogarah*.
MARKET COMPARISON
Kogarah House Georges River LGA House Kogarah Unit Georges River LGA Unit
The market comparison graph provides a comparative trend for the median price of houses and units over the past 5 years. The main LGA profiled was chosen based on their proximity to the main suburb analysed, which is Kogarah.


PRICE BREAKDOWN 2025 #


Less than $599,999
$600,000 to $699,999
$700,000 to $799,999 $800,000 to $899,999 $900,000 and above
RENTAL GROWTH 2025€
House rental yields in Kogarah* was 3.3%in September, above the Sydney Metro (2.7%). This was paired with a 19.8% increase in median rent price in the past 12 months to Q3 2025,at $925per week. The number of houses rented increased by 7.8% in the past 12 months, to110 rentals in Q3 2025;indicating a high demand. Median unit rent price rose by 18.1% to $697,but the number of units rented decreased, by -5.3% to 609units in Q3 2025; thus,an undersupply of units for rent is evident. Overall, the Kogarah* rental market benefits investors
2-bedroom houses have provided investors with +4.0%rental growth annually, achieving a median rent of $700per week.
Kogarah¥ recorded a vacancy rate of 1.3%in September 2025,onpar with Sydney Metro’s 1.3%. Vacancy rates in Kogarah¥ have trended downwards in the past 12 months, indicating a tighter rental market A 1.3% vacancy rate is below the Real Estate Institution of Australia’s healthy benchmark of 3.0%, thus quicker occupancy of rental homes. This is conducive for investment, even if property sale prices have increased in the past 12 months to Q3 2025.
RENTAL VACANCY RATES 2025


Kogarah (2217)¥
Kogarah (2217)
Georges River LGA
Sydney Metro
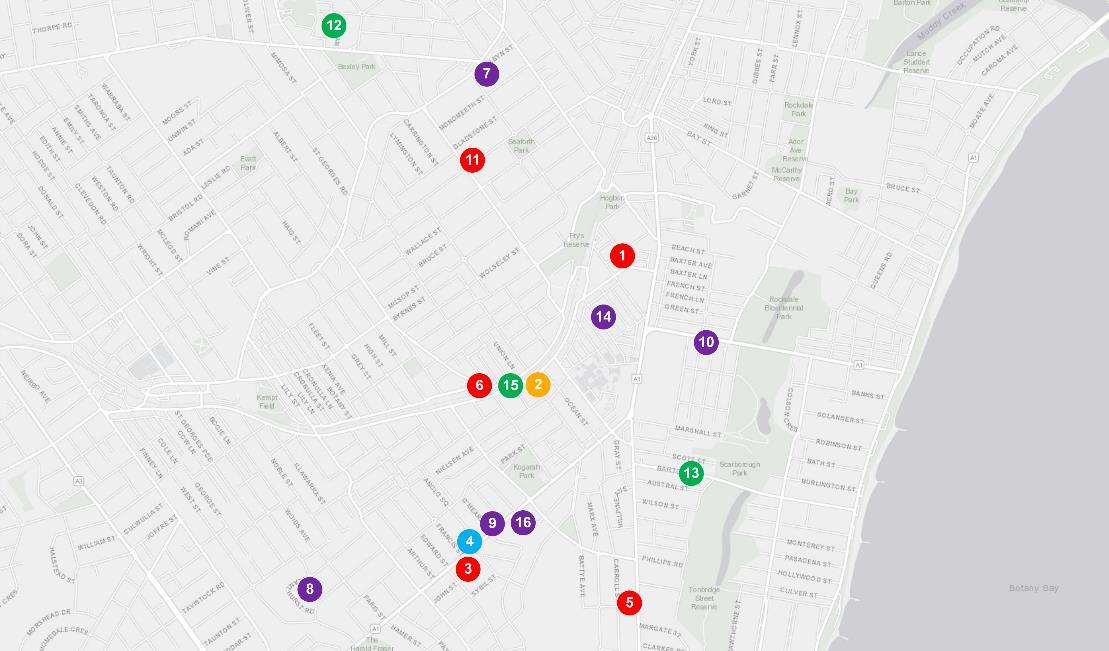
PROJECT DEVELOPMENT MAP 2025 ₳

KOGARAH


RESEARCH SERVICES
Our research services span over every suburb, LGA,and state within Australia; captured in a variety of standard and customised products, andinclude:
• Advisory and consultancy
• Market analysis including profiling and trends
• Primary qualitative and quantitative research
• Demographic and target market analysis
• Geographic information mapping
• Project analysis including product and pricing recommendations
• Rental and investment return analysis
OUR KNOWLEDGE
Access to accurate and objective research is the foundation of all good property decisions.
OUR PEOPLE
Our research team is made up of highly qualified researchers who focus solely on propertyanalysis.


REFERENCES
* Kogarah market data and key indicators encapsulates aggregate property market conditions within the suburbs of Beverley Park, Bexley, Carlton, Kogarah, Kogarah Bay and Rockdale.
** Estimated values are based on construction value provided by the relevant data authority and does not reflect commercial and/or re-sale value.
# 2025 encapsulates sales transactions for 2025 (01/01/2025-30/09/2025)only
€ Annual rental growth is a comparison between Q3 2024 (01/07/2024 – 30/09/2024)and Q3 2025 (01/07/2025 – 30/09/2025) house median rent figures.
¥ Kogarah market data encapsulates aggregate property conditions within the postcode of 2217.
§ Rental yields shown are as reported as of October 2025.
₳ Project development map showcases a sample of upcoming projects only, due to accuracy of addresses provided by the data provider for geocoding purposes.
£ Projects refers to the top developments within the suburbs of Beverley Park, Bexley, Carlton, Kogarah, Kogarah Bay and Rockdale.
µ Estimated value is the value of construction costs provided by relevant data authority, it does not reflect the project’s sale/commercial value.
ψ Commencement date quoted for each project is an approximate only, as provided by the relevant data authority, PRD does not hold any liability to the exact date.
Source: APM Pricefinder, Cordell Connect database, SQM Research, Esri ArcGIS.
Disclaimer: PRD does not give any warranty in relation to the accuracy of the information contained in this report. If you intend to rely upon the information contained herein, you must take note that the information, figures and projections have been provided by various sources and have not been verified by us. We have no belief one way or the other in relation to the accuracy of such information, figures and projections. PRD will not be liable for any loss or damage resulting from any statement, figure, calculation or any other information that you rely upon that is contained in the material.
Prepared by PRD Research. © All medians and volumes are calculated by PRD Research. Use with written permission only. All other responsibilities disclaimed. © Copyright PRD 2025.