
Coffs Harbour Market Update 2nd Half 2025

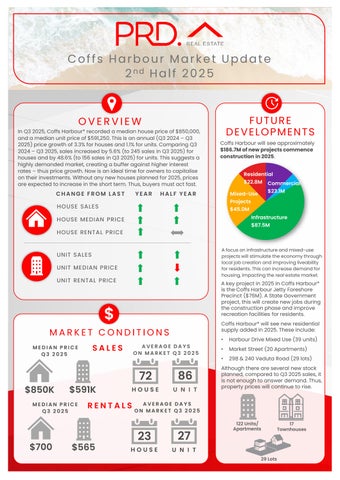
In Q3 2025, Coffs Harbour* recorded a median house price of $850,000, and a median unit price of $591,250.This is anannual (Q3 2024 – Q3 2025)price growth of 3.3%for houses and 1.1% for units. Comparing Q3 2024– Q3 2025,sales increased by 5.6% (to 245sales in Q3 2025) for houses and by 48.6%(to 156 sales in Q3 2025)for units. This suggests a highly demanded market, creating a buffer against higher interest rates – thus price growth. Now is an ideal time for owners tocapitalise on their investments. Without any new houses planned for 2025,prices are expected toincrease in the short term. Thus, buyers must act fast.

HOUSE SALES
FROM LAST HOUSE MEDIAN PRICE HOUSE RENTAL PRICE


Coffs Harbour will see approximately $186.7Mofnewprojectscommence constructionin2025
HALF YEAR


MEDIAN PRICE Q3 2025
AVERAGE DAYS ON MARKET Q3 2025
72 $850K $591K
MEDIAN PRICE Q3 2025
AVERAGE DAYS ON MARKET Q3 2025


Afocuson infrastructureandmixed-use projectswill stimulate the economythrough local jobcreation andimprovingliveability for residents.This canincrease demandfor housing,impactingthe real estatemarket.
A key project in 2025in Coffs Harbour* is the Coffs Harbour Jetty Foreshore Precinct ($76M). A State Government project, this will create new jobs during the construction phase and improve recreation facilities forresidents.
Coffs Harbour* will see new residential supply added in 2025. These include:
• Harbour Drive Mixed Use (39 units)
• Market Street (20 Apartments)
• 298& 240 Veduta Road (29 lots)
Although there are several new stock planned, compared toQ3 2025sales, it is not enough to answer demand. Thus, property prices will continue to rise. 122Units/ Apartments 17 Townhouses


AVERAGE VENDOR DISCOUNT*
Average vendor discount reflects the average percentage difference between the first list price and final sold price. A lower percentage difference (closer to 0.0%) suggests that buyers are willing to purchase close to the first asking price of a property.


In the past 12months to Q3 2025average vendor discount have tightened toa lesser discount of -3.4% for houses and -2.6% for units. The house and unit market conditions in Coffs Harbour continue to favourbuyers, as sellers are willing to accept below the first listed price. That said, with the trend of discounts slowly lessening, buyers should act fast to secure the best deal.
The suburb of Coffs Harbour has historically offered a more affordable median house price than the wider Coffs Harbour Local Government Area (LGA); and on par pricing for units. In 2025# this trend has continued for both house and unit prices in Coffs Harbour, with the suburb and LGA price growth trending in a similar manner.
The dominant proportion of homes sold in Coffs Harbour* in 2025# were in the premium price point of $950,00and above (37.6%). Most of the units sold were spread between the most affordable price point of less than $549,999 (37.8%) and the premium price of $700,000and above (29.6%); which creates equal opportunities for unit owners and buyers. Overall, this shows that while Coffs Harbour* is a premium market, there are options for all budgets.
MARKET COMPARISON
The market comparison graph provides a comparative trend for the median price of houses and units in the past 5 years. The LGA profiled was chosen based on their proximity tothe main suburb analysed, which is Coffs Harbour.


PRICE BREAKDOWN 2025 #


$550,000 to $599,999
$600,000 to $649,999
$650,000 to $699,999 $700,000 and above
RENTAL GROWTH 2025€
House rental yields in Coffs Harbour¥ was 3.4% in September 2025,higher than Sydney Metro (2.7%). This was paired with a 2.9% increase in median house rental price in the past 12 months to Q3 2025,at $700per week. The number of houses rented declined by -32.2%in the past 12 months, to 99rentals in Q3 2025.Higher rent and less properties rented can also be seen in the unit rental market, confirming an undersupply of rental properties in Coffs Harbour¥. This is beneficial to investors; especially those looking for a more affordable option than Sydney.
4-bedroom houses have provided investors with +6.5%rental growth annually, achieving a median rent of $820per week.
Coffs Harbour¥ recorded a vacancy rate of 1.2%in September 2025, below Sydney Metro’s 1.3% average. Vacancy rates in Coffs Harbour¥ increased slightly in the past 12months, due to the return of investors However, a 1.2%vacancy rate is still well below the Real Estate Institution of Australia’s healthy benchmark of 3.0%, suggesting quick occupancy of rental homes. This is conducive forinvestment, even with a higher property sale price (thus, entry price) in Q3 2025.
RENTAL VACANCY RATES 2025


Coffs Harbour (2450)
Coffs Harbour LGA
Sydney Metro REIA 'Healthy' Benchmark
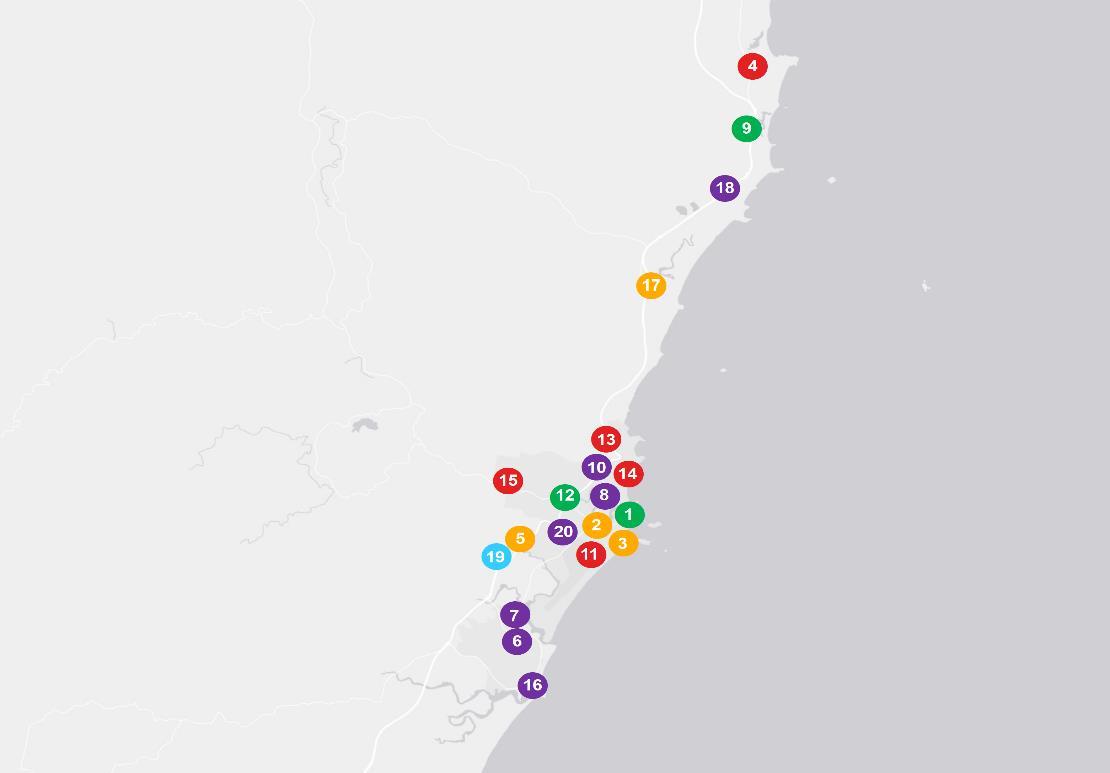
PROJECT DEVELOPMENT 2025 ₳

Harbour


RESEARCH SERVICES
Our research services span over every suburb, LGA,and state within Australia; captured in a variety of standard and customised products, andinclude:
• Advisory and consultancy
• Market analysis including profiling and trends
• Primary qualitative and quantitative research
• Demographic and target market analysis
• Geographic information mapping
• Project analysis including product and pricing recommendations
• Rental and investment return analysis
OUR KNOWLEDGE
Access to accurate and objective research is the foundation of all good property decisions.
OUR PEOPLE
Our research team is made up of highly qualified researchers who focus solely on propertyanalysis.


REFERENCES
* Coffs Harbour market data and key indicators encapsulates aggregate property market conditions within the Coffs Harbour LGA.
** Estimated values are based on construction value provided by the relevant data authority and does not reflect commercial and/or re-sale value.
# 2025 encapsulates sales transactions for Q1 – Q3 2025 (01/01/2025 – 30/09/2025) only, other years encapsulates sales transactions for the full year (i.e 01/01 to 31/12 of the relevant year).
€ Annual rental growth is a comparison between Q3 2024 (01/07/2024 – 30/09/2024)and Q3 2025 (01/07/2025 – 30/09/2025) house median rent figures.
¥ Coffs Harbour market data encapsulates aggregate property conditions within the postcode of 2450.
§ Rental yields shown are as reported as of September 2025.
₳ Project development map showcases a sample of upcoming projects only, due to accuracy of addresses provided by the data provider for geocoding purposes.
£ Projects refers to the top developments within the Coffs Harbour LGA.
µ Estimated value is the value of construction costs provided by relevant data authority, it does not reflect the project’s sale/commercial value.
ψ Commencement date quoted for each project is an approximate only, as provided by the relevant data authority, PRD does not hold any liability to the exact date.
Source: APM Pricefinder, Cordell Connect database, SQM Research, Esri ArcGIS.
Disclaimer: PRD does not give any warranty in relation to the accuracy of the information contained in this report. If you intend to rely upon the information contained herein, you must take note that the information, figures and projections have been provided by various sources and have not been verified by us. We have no belief one way or the other in relation to the accuracy of such information, figures and projections. PRD will not be liable for any loss or damage resulting from any statement, figure, calculation or any other information that you rely upon that is contained in the material.
Prepared by PRD Research. © All medians and volumes are calculated by PRD Research. Use with written permission only. All other responsibilities disclaimed. © Copyright PRD 2025.