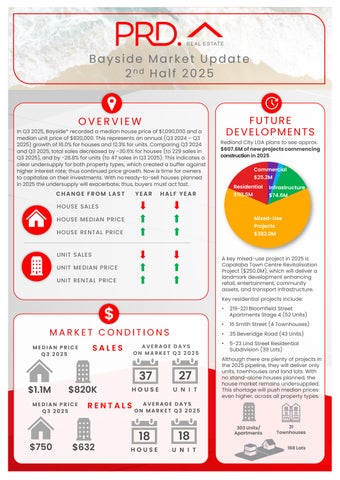

Bayside Market Update 2nd Half 2025

In Q3 2025, Bayside* recorded a median house price of $1,090,000and a median unit price of $820,000.This represents anannual (Q3 2024 – Q3 2025)growth of16.0% for houses and 12.3%for units. Comparing Q3 2024 and Q3 2025,total sales decreased by -30.6% for houses (to 229sales in Q3 2025), and by -28.8% for units (to 47sales in Q3 2025). This indicates a clear undersupply for both property types, which created a buffer against higher interest rate; thus continued price growth. Now is time for owners to capitalize on their investments With noready-to-sell houses planned in 2025the undersupply will exacerbate; thus, buyers must act fast.
CHANGE FROM LAST

HOUSE SALES YEAR HALF YEAR
HOUSE MEDIAN PRICE
HOUSE RENTAL PRICE
PRICE
RENTAL PRICE

MEDIAN PRICE Q3 2025


Redland City LGA plans tosee approx. $607.6Mofnewprojectscommencing constructionin2025.

AVERAGE DAYS ON MARKET Q3 2025
37 $1.1M $820K
MEDIAN PRICE Q3 2025
AVERAGE DAYS ON MARKET Q3 2025


A key mixed-use project in 2025is Capalaba Town Centre Revitalisation Project ($250.0M), which will deliver a landmark development enhancing retail, entertainment, community assets, and transport infrastructure.
Key residential projects include:
• 219-221Bloomfield Street Apartments Stage 4 (52 Units)
• 16 Smith Street (4 Townhouses)
• 35Beveridge Road (43 Units)
• 5-23 Lind Street Residential Subdivision (39 Lots)
Although there are plenty of projects in the 2025pipeline, they will deliver only units, townhouses and land lots. With no stand-alone houses planned, the house market remains undersupplied. This shortage will push median prices even higher, across all property types.


AVERAGE VENDOR DISCOUNT*
Average vendor discount reflects the average percentage difference between the first list price and final sold price. A lower percentage difference (closer to 0.0%) suggests that buyers are willing to purchase close to the first asking price of a property.


Average vendor discounts have swung from discounts to premiums over the past 12months toQ3 2025, of 0.4%for houses and 0.2% forunits. The Bayside* market has shifted and now favours sellers, with buyers needing to offer above listed prices. Q3 2025 marks a return in the Bayside* market, after a period of brief discounts. Buyers must act fast, due to the absence of new houses being built in 2025.
In the past 2years to 2025#,the suburb of MountCotton saw the highest growth in median house price, of 35.0%. This is followed by the Thornlands (27.2%) and Redland Bay (22.8%). All foursuburbs are now $1-million suburbs, with the Victoria Point being the most affordable in 2025#
The dominant proportion of homes sold in Bayside* in 2025# was in the most affordable price point of less than $949,999for houses (29.8%) and in the middle price bracket between $750,000to $849,999for units (30.6%).
Thatsaid, the premium price brackets remain strong, with 27.0% of houses sold above $1,250,000and 27.3%of units sold above $950,000,which benefits homeowners looking to transact. Overall, Bayside* caters to a wide range of budgets, ensuring there is a home for every buyer.
MARKET COMPARISON


than $649,999 $650,000 to $749,999 $750,000 to $849,999 $850,000 to $949,999 $950,000 and above
RENTAL GROWTH 2025€
House rental yields in Bayside¥ was 3.8% as of September 2025, higher than the Redland City LGA (3.6%) and Brisbane Metro (3.1%). This was paired with a 7.1%increase in median house rental price in the past 12months, at $750per week, along with an 8.4% increase in the number of housed rented (to 168houses in Q3 2025). The same pattern canbe seen for unit rentals, suggesting a highly-demanded rental market in Bayside¥ overall. This is beneficial to investors.
4+ bedroom houses have provided investors with +6.9% rental growth annually, achieving a median rent of $775per week.
Bayside¥ recorded a vacancy rate of 0.9%in September 2025, below Redland City LGA (1.3%) and Brisbane Metro (1.0%). Vacancy rates have fluctuated but shown an overall declining trend over the past 12months, reflecting a tighter rental market. Furthermore, a 0.9%vacancy rate is significantly below the Real Estate Institute of Australia’s healthy benchmark of 3.0%, indicating quicker occupancy of rental properties. This creates a conducive environment for investors, even with a higher house and unit sales (thus entry) price in the past 12months toQ3 2025.
RENTAL VACANCY RATES 2025

Bayside (4165) Redland City LGA Brisbane Metro REIA 'Healthy' Benchmark

Bayside¥

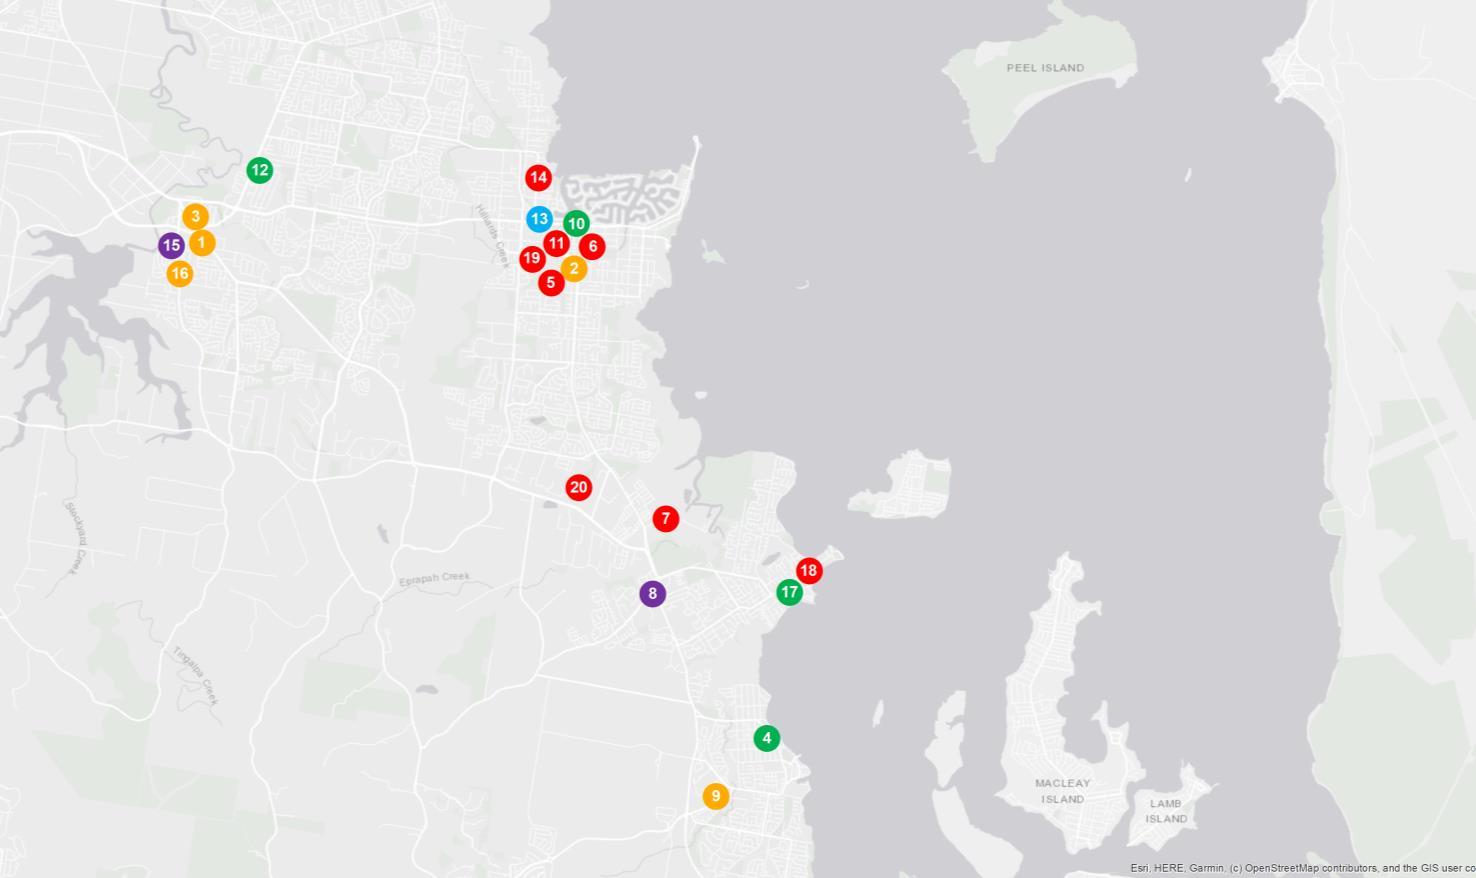
PROJECT DEVELOPMENT MAP 2025 ₳


RESEARCH SERVICES
Our research services span over every suburb, LGA,and state within Australia; captured in a variety of standard and customised products, andinclude:
• Advisory and consultancy
• Market analysis including profiling and trends
• Primary qualitative and quantitative research
• Demographic and target market analysis
• Geographic information mapping
• Project analysis including product and pricing recommendations
• Rental and investment return analysis
OUR KNOWLEDGE
Access to accurate and objective research is the foundation of all good property decisions.
OUR PEOPLE
Our research team is made up of highly qualified researchers who focus solely on propertyanalysis.


REFERENCES
* Bayside sales market data and key indicators encapsulates aggregate property market conditions within the suburbs of Mount Cotton, Redland Bay, Thornlands, and Victoria Point.
** Estimated values are based on construction value provided by the relevant data authority and does not reflect commercial and/or re-sale value.
# 2025 encapsulates sales transactions for Q1 - Q3 (01/01/2025– 30/09/2025)only, other years encapsulates sales transactions for the full year (i.e 01/01 to 31/12 of the relevant year).
€ Annual rental growth is a comparison between Q3 2024 (01/07/2024 – 30/09/2024)and Q3 2025 (01/07/2025 – 30/09/2025) house median rent figures.
¥ Bayside rental market data encapsulates aggregate property conditions within the postcode of 4165.
§ Rental yields shown are as reported as of September 2025.
₳ Project development map showcases a sample of upcoming projects only, due to accuracy of addresses provided by the data provider for geocoding purposes.
£ Projects refers to the top developments within the Redland City Local Government Area.
µ Estimated value is the value of construction costs provided by relevant data authority, it does not reflect the project’s sale/commercial value.
ψ Commencement date quoted for each project is an approximate only, as provided by the relevant data authority, PRD does not hold any liability to the exact date.
Source: APM Pricefinder, Cordell Connect database, SQM Research, Esri ArcGIS.
Disclaimer: PRD does not give any warranty in relation to the accuracy of the information contained in this report. If you intend to rely upon the information contained herein, you must take note that the information, figures and projections have been provided by various sources and have not been verified by us. We have no belief one way or the other in relation to the accuracy of such information, figures and projections. PRD will not be liable for any loss or damage resulting from any statement, figure, calculation or any other information that you rely upon that is contained in the material.
Prepared by PRD Research. © All medians and volumes are calculated by PRD Research. Use with written permission only. All other responsibilities disclaimed. © Copyright PRD 2025.