Kogarah Market Update 2nd Half 2024

In Q3 2024, Kogarah* recorded a median house price of $1,901,000,and a median unit price of $745,500.This is anannual (Q3 2024 – Q3 2024) price growth of 17.3%for houses and 2.8%for units. Comparing Q32023 – Q3 2024,sales declined by -27.3% for houses (to 93 sales in Q3 2024) and by -25.5% for units (to 238sales in Q3 2024). An undersupply in the market, for both houses and units, has created a buffer against higher interest rates; hence price growth. With prices continuing to rise, now is an ideal time forowners to capitalise on their investments. Most of the new incoming stock are units, which presents an opportunity for buyers.
FROM LAST

MEDIAN PRICE HOUSE RENTAL PRICE
SALES


Kogarah is set to see approximately $132.7Mofnewprojectscommencing constructionin2024
HALF YEAR

PRICE
RENTAL PRICE

MEDIAN PRICE Q3 2024
AVERAGE DAYS ON MARKET Q3 2024
39 $1.9M $745K
MEDIAN PRICE Q3 2024
50
AVERAGE DAYS ON MARKET Q3 2024
21 21
$680 HOUSE UNIT


These projectswill stimulate economic growthandcreatenew jobopportunities in Kogarah.This will have apositive spilloverimpacton the real estatemarket,in the form of higher demandfor housing.
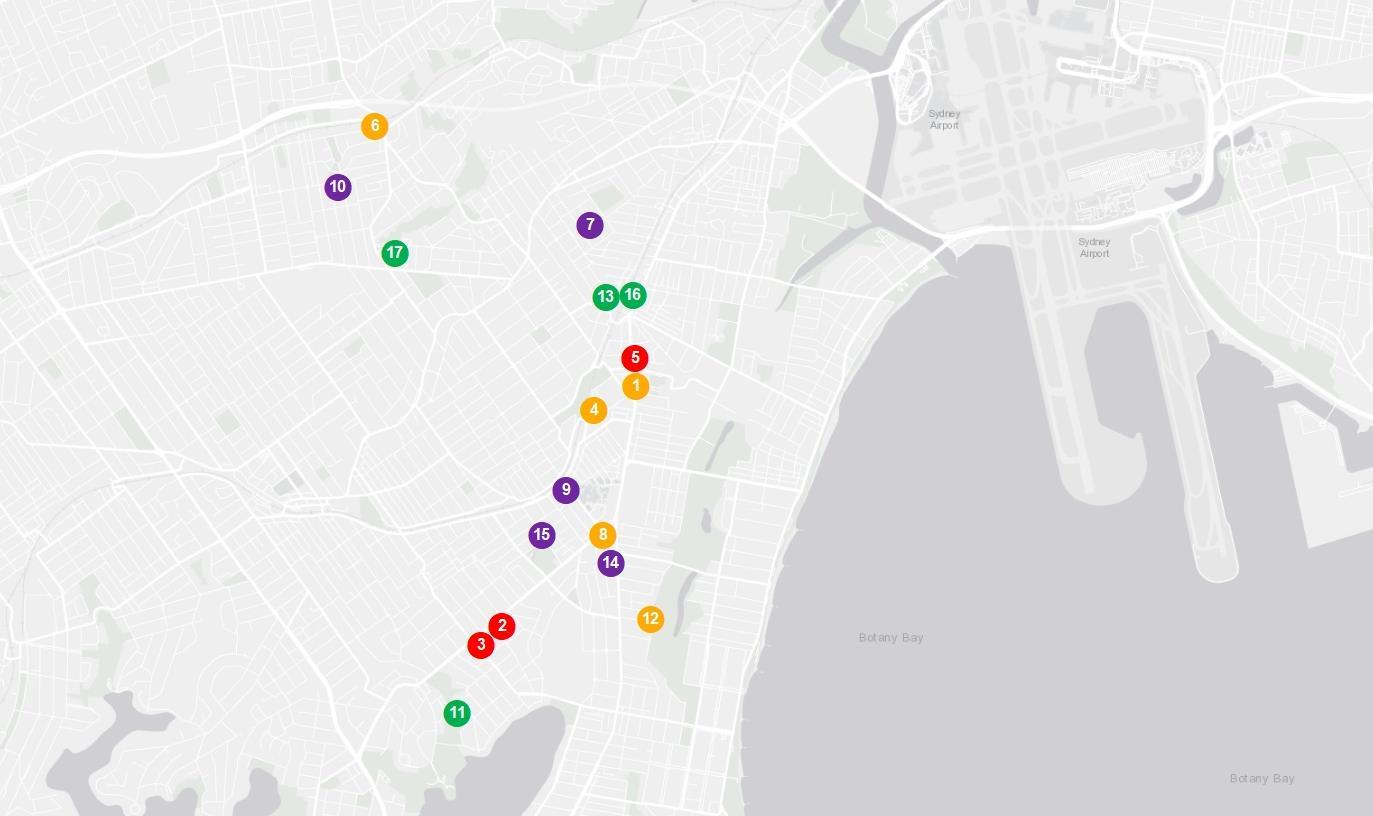
There are multiple residential and mixed-use projects planned for 2024 that will help boost supply, including:
• 648-652 Princes Highway & 1-3 Ashton Street (61 Units)
• 13-21 Wyuna Street Units – Bayside (64 Units/Townhouses)
• 10 Victor Street & Gladstone Street Mixed Use Development (32Units)
• Princes Highway Apartments (58 Apartments)
• Shaw Street Apartments & Commercial (11 Apartments)
Although new stock is planned, all are units. This will answer some demand, but it is notenough. The absence in new houses suggest anundersupply will remain, thus pushing up prices.
192Units/ Apartments $800

AVERAGE VENDOR DISCOUNT*


In the past 12months to Q3 2024average house vendor discount have continue to be a premium, however at a slightly lower rate of 4.1%. Average unit vendor discount have remained stable, at -1.0%. The house market still favoursellers, where buyers must offer higher than the first list price. Units still favour buyers, however the roomto negotiate is quite small – thus unit buyers must act fast.
The suburb of Kogarah has historically been onpar with the wider Georges River Local Government Area (LGA). In 2024 # this trend has continued forboth house and unit median prices, with median house prices in the suburb rising to meet the wider LGA.
The dominant proportion of homes sold in Kogarah* in 2024# was in the more affordable price point of $1,749,999 and below(44.7%). Whilst house prices remain quite high in Kogarah*, with the premium market of $2,050,000and above accounting for 33.2%of sales, this indicates that there is still affordable options for first homes buyers. Most of the units sold were in the most affordable (33.2%) and premium (29.4%) price brackets, thus there is a home for every budget in Kogarah*.
MARKET COMPARISON
The market comparison graph provides a comparative trend for the median price of houses and units over the past 5 years. The main LGA profiled was chosen based on their proximity to the main suburb analysed, which is Kogarah.
Average vendor discount reflects the average percentage difference between the first list price and final sold price. A lower percentage difference (closer to 0.0%) suggests that buyers are willing to purchase close to the first asking price of a property. UNITS SOLD HOUSES SOLD


BREAKDOWN 2024#


to $749,999 $750,000 to $799,999 $800,000 and above
Unit Georges River LGA Unit
RENTAL GROWTH 2024€
House rental yields in Kogarah* was 3.2%in September, slightly above Sydney Metro (2.8%). This was paired with a 2.6%increase in median rent price in the past 12months to Q32024, at $840per week. The number of houses rented decreased by -12.6% in the past 12months, to 104rentals in Q3 2024; which suggests an undersupply. Similarly, median unit rent price rose by 6.3%to $680,but the number of units rented increased, by 8.2%to 630 units in Q3 2024. This suggests a highly demanded unit rental market. Overall, this is good news for investors.
3-bedroom houses have provided investors with +6.3% rental growth annually, achieving a median rent of $850per week.
Kogarah¥ recorded a vacancy rate of 1.7% in September 2024, slightly above Georges River LGA’s 1.5%and Sydney Metro’s 1.6% average. Vacancy rates in Kogarah¥ have generally trended upwards in the past 12 months, due to investors returning to market as cash rates stabilised. Thatsaid, a 1.7% vacancy rate is still significantly below the Real Estate Institution of Australia’s healthy benchmark of 3.0%, suggesting quicker occupancy of rental homes.
RENTAL VACANCY RATES 2024


Kogarah (2217)¥
Kogarah (2217)
Georges River LGA
Sydney Metro
PROJECT DEVELOPMENT MAP 2024 ₳

KOGARAH


RESEARCH SERVICES
Our research services span over every suburb, LGA,and state within Australia; captured in a variety of standard and customised products, andinclude:
• Advisory and consultancy
• Market analysis including profiling and trends
• Primary qualitative and quantitative research
• Demographic and target market analysis
• Geographic information mapping
• Project analysis including product and pricing recommendations
• Rental and investment return analysis
OUR KNOWLEDGE
Access to accurate and objective research is the foundation of all good property decisions.
OUR PEOPLE
Our research team is made up of highly qualified researchers who focus solely on propertyanalysis.


414 223 372


REFERENCES
* Kogarah sales market data and key indicators encapsulates aggregate property market conditions within the suburbs of Beverley Park, Bexley, Carlton, Kogarah, Kogarah Bay and Rockdale.
** Estimated values are based on construction value provided by the relevant data authority and does not reflect commercial and/or re-sale value.
# 2024 encapsulates sales transactions for Q1 - Q3 (01/01/2024– 30/09/2024)only, other years encapsulates sales transactions for the full year (i.e 01/01 to 31/12 of the relevant year).
€ Annual rental growth is a comparison between Q3 2023 (01/07/2023 – 30/09/2023) and Q3 2024 (01/07/2024 – 30/09/2024) house median rent figures.
¥ Kogarah rental market data encapsulates aggregate property conditions within the postcode of 2217.
§ Rental yields shown are as reported as of October 2024.
₳ Project development map showcases a sample of upcoming projects only, due to accuracy of addresses provided by the data provider for geocoding purposes.
£ Projects refers to the top developments within the suburbs of Beverley Park, Bexley, Carlton, Kogarah, Kogarah Bay and Rockdale.
µ Estimated value is the value of construction costs provided by relevant data authority, it does not reflect the project’s sale/commercial value.
ψ Commencement date quoted for each project is an approximate only, as provided by the relevant data authority, PRD does not hold any liability to the exact date.
Source: APM Pricefinder, Cordell Connect database, SQM Research, Esri ArcGIS.
Disclaimer: PRD does not give any warranty in relation to the accuracy of the information contained in this report. If you intend to rely upon the information contained herein, you must take note that the information, figures and projections have been provided by various sources and have not been verified by us. We have no belief one way or the other in relation to the accuracy of such information, figures and projections. PRD will not be liable for any loss or damage resulting from any statement, figure, calculation or any other information that you rely upon that is contained in the material.
Prepared by PRD Research. © All medians and volumes are calculated by PRD Research. Use with written permission only. All other responsibilities disclaimed. © Copyright PRD 2024.