Upper Hunter Market Update 2 nd H a l f 2 0 2 5
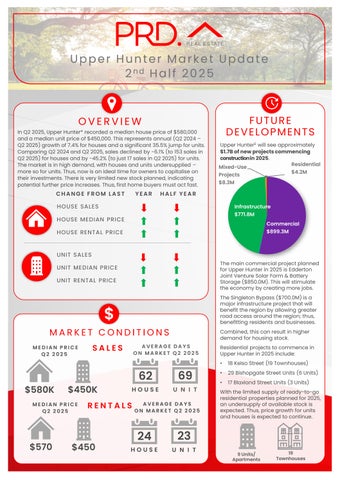
FUTURE DEVELOPMENTS
OVERVIEW
In Q2 2025, Upper Hunter* recorded a median house price of $580,000 and a median unit price of $450,000. This represents annual (Q2 2024 – Q2 2025) growth of 7.4% for houses and a significant 35.5% jump for units. Comparing Q2 2024 and Q2 2025, sales declined by -6.1% (to 153 sales in Q2 2025) for houses and by -45.2% (to just 17 sales in Q2 2025) for units. The market is in high demand, with houses and units undersupplied – more so for units. Thus, now is an ideal time for owners to capitalise on their investments. There is very limited new stock planned, indicating potential further price increases. Thus, first home buyers must act fast.
CHANGE FROM LAST
YEAR
Upper Hunter£ will see approximately $1.7B of new projects commencing construction in 2025. Residential Mixed-Use $4.2M Projects $8.3M
HALF YEAR
HOUSE SALE S
Infrastructure $771.8M
HOUSE ME DIAN PRICE
Commercial $899.3M
HOUSE RE NTAL PRICE
UNIT SALE S The main commercial project planned for Upper Hunter in 2025 is Edderton Joint Venture Solar Farm & Battery Storage ($850.0M). This will stimulate the economy by creating more jobs.
UNIT ME DIAN PRICE UNIT RE NTAL PRICE
The Singleton Bypass ($700.0M) is a major infrastructure project that will benefit the region by allowing greater road access around the region; thus, benefitting residents and businesses.
$ MARKET CONDITIONS
Combined, this can result in higher demand for housing stock.
SALES
Residential projects to commence in Upper Hunter in 2025 include:
MEDIAN PRICE Q2 2025
$580K
$450K
MEDIAN PRICE Q2 2025
$570
AVERAGE DAYS ON MARKET Q2 2025
62
69
HOUSE
U N I T
RENTALS
$450
AVERAGE DAYS ON MARKET Q2 2025
24
23
HOUSE
U N I T
•
18 Kelso Street (19 Townhouses)
•
29 Bishopgate Street Units (6 Units)
•
17 Blaxland Street Units (3 Units)
With the limited supply of ready-to-go residential properties planned for 2025, an undersupply of available stock is expected. Thus, price growth for units and houses is expected to continue.
9 Units/ Apartments
19 Townhouses