
Kingsgrove Market Update 1st Half 2025

In Q1 2025,Kingsgrove* recorded a median house price of $1,660,000and a median unit price of $650,000.This is an annual (Q1 2024– Q1 2025) slight price softening of -6.5% for houses, but a price increase of 3.6%for units. Comparing Q1 2024and Q1 2025,sales softened by -13.8%(to 125 sales in Q1 2025) for houses and increased by 41.6% (to 109sales in Q1 2025)for units. House prices have been impacted by higher interest rates, even if there is less stock available. This creates an opportunity for buyers. Units have become highly demanded, due tolow house stock available and its comparative affordability in price. This has pushed up unit prices, creating an opportunity for owners to capitalise on their investment.

HOUSE SALES
FROM LAST HOUSE MEDIAN PRICE HOUSE RENTAL PRICE
SALES


Kingsgrove£ will see approximately $101.6Mofnewprojectscommencing constructionbetween2025and2026
HALF YEAR


MEDIAN PRICE Q1 2025
$1.6M $650K
MEDIAN PRICE Q1 2025
AVERAGE DAYS ON MARKET Q1 2025
56
AVERAGE DAYS ON MARKET Q1 2025


A focus oncommercial projects will bring more services and create local jobs in the area, making Kingsgrove* a more vibrant place to do business.
Residential and Mixed-Use projects set to commence construction in 2025 and 2026 include (but not limited to):
• 892-906 Canterbury Road (50 Units)
• 84-88 Chapel Street Belmore Units (20 Units)
• 599-603 Canterbury Road Apartments (36 Apartments)
• 82Riverview Road Units (11 Units)
• 2-6 Martin Street (4 Dwellings)
Although there are few residential and mixed-use projects delivering stock, it is no enough to answer the demand There is very little new stand-alone houses planned and the number of units in the pipeline does not match current sales figures. This is expected to push prices up, for all stock types. 78


AVERAGE VENDOR DISCOUNT*
Average vendor discount reflects the average percentage difference between the first list price and final sold price. A lower percentage difference (closer to 0.0%) suggests that buyers are willing to purchase close to the first asking price of a property.


Average house vendor discounts between Q1 2024and Q1 2025continue to trend as a premium, however at a slightly higher level of 4.8%. This indicates that even with a slight softening in median house sales price, the house market is still a seller’s market. Average unit vendor discount saw a widening in the past 12 months, to -4.2% in Q1 2025.This is good news for first home buyers, now is the time to act.
The suburb of Kingsgrove has been a premium market compared to the wider Canterbury-Bankstown Local Government Area (LGA) in median house and unit prices for the past 5 years. Whilst house prices continue to be premium in 2025#,the unit market is now on par with the LGA, as unit prices saw a slight recovery in early 2025(after a softer market in 2024).
Most of the homes sold in Kingsgrove* in 2024/2025#were price in the premium point of $1,800,00and above (50.6%). Units however saw a more balanced market. Even though most sales (28.3%) were in the premium price point of $800,000and above, there were strong sales numbers in the middle price bracket of$500,000 - $599,999(22.1%) as well. This creates a wider opportunity for buyers.
MARKET COMPARISON
The market comparison graph provides a comparative trend for median price of houses and units over the past 5 years. The main LGA chosen was based on their proximity to the main suburb analysed, which is Kingsgrove.


than$499,999
$500,000 to $599,999
$600,000to $699,999
$700,000to$799,999
$800,000 and above
RENTAL GROWTH 2025€
House rental yields in Kingsgrove¥ was 2.5% as of March2025, relatively on par with Sydney Metro (2.7%). Median house rental price have remained relatively stable on a quarter per quarter basis in the past 12 months, ranging between $820 - $850per week. The number of houses rented increased, by 32.7% (to 211 houses) in the past 12 months to Q1 2025; indicating a well demanded rental market. Median unit price increased by 4.7% in the past 12 months to Q1 2025. Combined, this creates unique opportunities for investors.
4+ bedroom houses have provided investors with +13.2%rental growth annually, achieving a median rent of $1,100per week.
Kingsgrove¥ recorded a vacancy rate of 1.0%in March2025,slightly below Sydney Metro’s 1.3%.
Vacancy rates did fluctuate in the past 12 months, butoverall showed an increasing pattern, due tothe increase in investors returning to market. However, a 1.0% vacancy rate is still well below the Real Estate Institution of Australia’s healthy benchmark of 3.0%, indicating quicker occupancy of rental homes in Kingsgrove¥; which is a conducive environment for investors.
RENTAL VACANCY RATES 2025


RENTAL YIELD 2025§

Kingsgrove (2208)¥
Kingsgrove (2208)
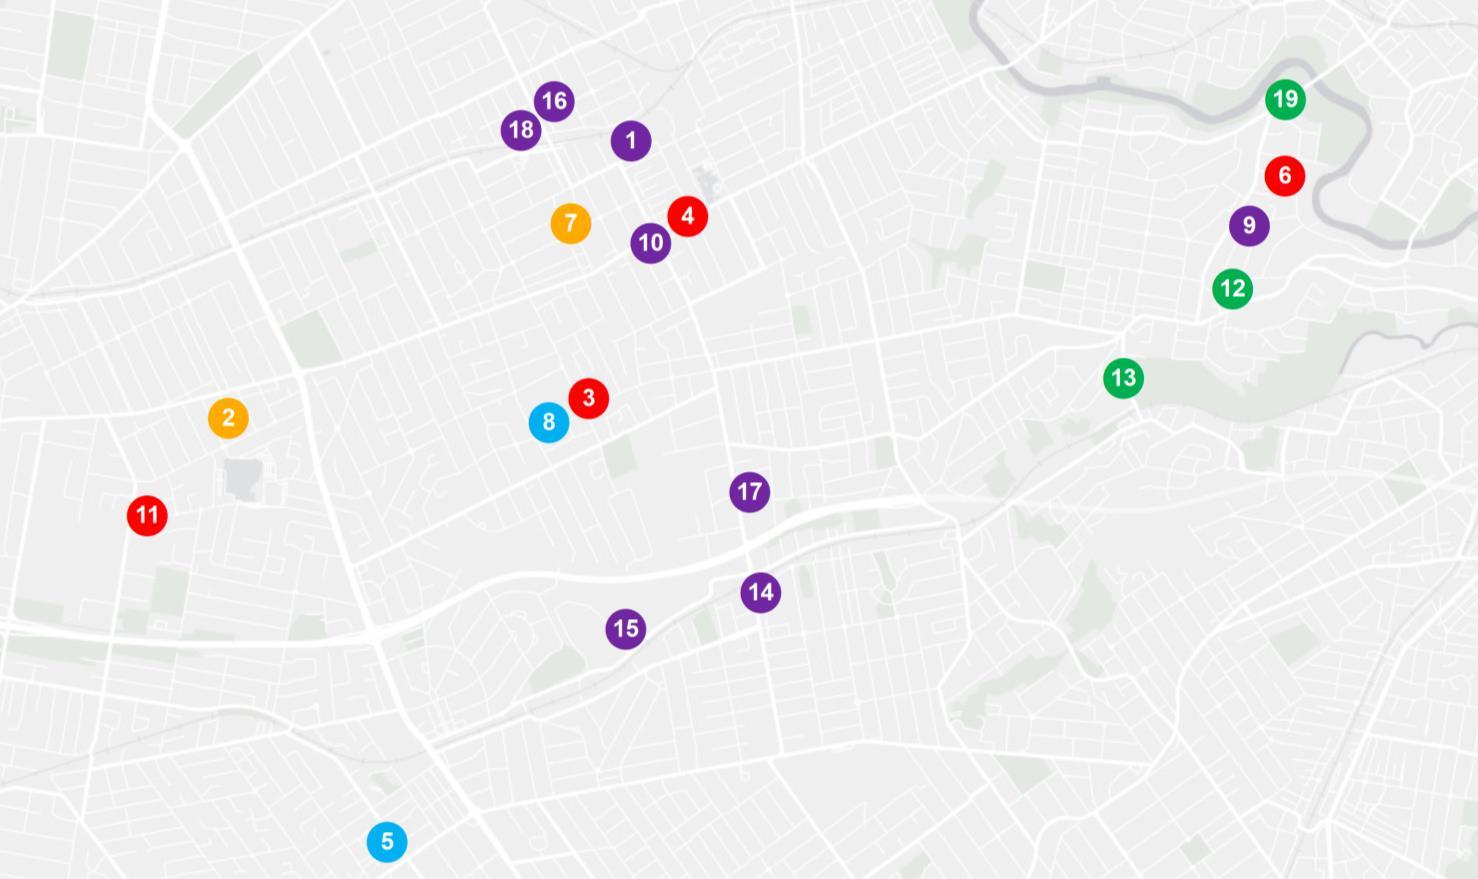
PROJECT DEVELOPMENT MAP 2025-26 ₳
KINGSGROVE


RESEARCH SERVICES
Our research services span over every suburb, LGA,and state within Australia; captured in a variety of standard and customised products, andinclude:
• Advisory and consultancy
• Market analysis including profiling and trends
• Primary qualitative and quantitative research
• Demographic and target market analysis
• Geographic information mapping
• Project analysis including product and pricing recommendations
• Rental and investment return analysis
OUR KNOWLEDGE
Access to accurate and objective research is the foundation of all good property decisions.
OUR PEOPLE
Our research team is made up of highly qualified researchers who focus solely on propertyanalysis.


REFERENCES
* Kingsgrove market data and key indicators encapsulates aggregate property market conditions within the suburbs of Kingsgrove, Roselands, Earlwood, Beverly Hills, Belmore and Clemton Park.
** Estimated values are based on construction value provided by the relevant data authority and does not reflect commercial and/or re-sale value.
# 2025 encapsulates sales transactions for Q1 (01/01/2025 – 31/03/2025) only, other years encapsulates sales transactions for the full year (i.e 01/01 to 31/12 of the relevant year).
€ Annual rental growth is a comparison between Q1 2024 (01/01/2024 – 31/03/2024) and Q1 2025 (01/01/2025 – 31/03/2025) house median rent figures.
¥ Kingsgrove rental market data encapsulates aggregate property conditions within the postcode of 2208.
§ Rental yields shown are as reported as of March 2025.
₳ Project development map showcases a sample of upcoming projects only, due to accuracy of addresses provided by the data provider for geocoding purposes.
£ Projects refers to the top developments within the suburbs of Kingsgrove, Roselands, Earlwood, Beverly Hills, Belmore and Clemton Park.
µ Estimated value is the value of construction costs provided by relevant data authority, it does not reflect the project’s sale/commercial value.
ψ Commencement date quoted for each project is an approximate only, as provided by the relevant data authority, PRD does not hold any liability to the exact date.
Source: APM Pricefinder, Cordell Connect database, SQM Research, Esri ArcGIS.
Disclaimer: PRD does not give any warranty in relation to the accuracy of the information contained in this report. If you intend to rely upon the information contained herein, you must take note that the information, figures and projections have been provided by various sources and have not been verified by us. We have no belief one way or the other in relation to the accuracy of such information, figures and projections. PRD will not be liable for any loss or damage resulting from any statement, figure, calculation or any other information that you rely upon that is contained in the material.
Prepared by PRD Research. © All medians and volumes are calculated by PRD Research. Use with written permission only. All other responsibilities disclaimed. © Copyright PRD 2025.