Hurstville Market Update 2nd Half 2025

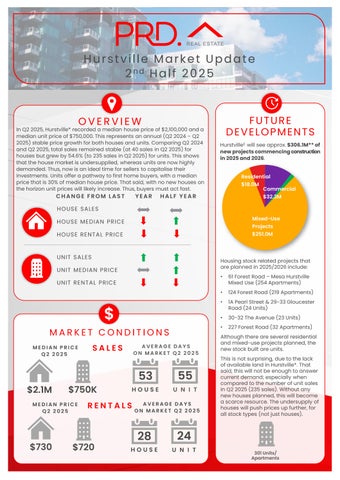
In Q2 2025, Hurstville* recorded a median house price of $2,100,000 and a median unit price of $750,000.This represents anannual (Q2 2024 – Q2 2025)stable price growth for both houses and units. Comparing Q2 2024 and Q2 2025,total sales remained stable (at 40 sales in Q2 2025)for houses butgrew by 54.6% (to 235sales in Q2 2025)for units. This shows that the house market is undersupplied, whereas units are now highly demanded. Thus, now is an ideal time for sellers to capitalise their investments Units offer a pathway tofirst home buyers, with a median price that is 30% of median house price. That said, with nonew houses on the horizon unit prices will likely increase. Thus,buyers must act fast.

HOUSE SALES YEAR HALF YEAR CHANGE FROM LAST HOUSE MEDIAN PRICE HOUSE RENTAL PRICE


Hurstville£ will see approx $306.1M**of newprojectscommencingconstruction in2025and2026


Housing stock related projects that are planned in 2025/2026include:
• 61 Forest Road – Mesa Hurstville Mixed Use (254Apartments)
• 124Forest Road (219 Apartments)

• 1A Pearl Street & 29-33Gloucester Road (24Units)
• 30-32 The Avenue (23Units)
• 227Forest Road (32 Apartments)
MEDIAN PRICE Q2 2025 MEDIAN PRICE Q2 2025
AVERAGE DAYS ON MARKET Q2 2025
53 $2.1M $750K
55
AVERAGE DAYS ON MARKET Q2 2025
Although there are several residential and mixed-use projects planned, the new stock built are units.
This is notsurprising, due to the lack of available land in Hurstville*. That said, this will not be enough to answer current demand; especially when compared to the number of unit sales in Q2 2025(235 sales). Without any new houses planned, this will become a scarce resource. The undersupply of houses will push prices up further, for all stock types (not just houses).

AVERAGE VENDOR DISCOUNT*
Average vendor discount reflects the average percentage difference between the first list price and final sold price. A lower percentage difference (closer to 0.0%) suggests that buyers are willing to purchase close to the first asking price of a property.

Average house vendor discounts between Q2 2024and Q2 2025is still at a premium, however, have reduced from 9.3% to 6.3%. Thus,house buyers must still offer above the first listing price. Units still offer a discount, of -0.9%, suggesting unit buyers can still offer below the first listed price. But this is a tighter discount than 12 months prior (-2.1%); indicating a shift towards a seller’s market Unit buyers must act fast.
The suburb of Hurstville has slightly outperformed the wider Georges River Local Government Area (LGA) in median house prices over the past 5years. This continued to be the case in 2025#,with the gap widening slightly, establishing Hurstville as a premium market Unit median prices in the suburb of Hurstville remains onpar with Georges River LGA


Most of the homes sold in Hurstville* in 2024/25#were in the premium price bracket of $2,300,000and above (38.7%). However, the market is relatively well distributed, with 17.7% of houses sold in the more affordable price of less than$1,699,999.Units had most sales (27.4%) in the mid-range price bracket, of $700,000to$799,999.Hurstville is a premium market, but there are still properties available for every budget; which benefits first home buyers.
MARKET COMPARISON
Hurstville (2220) House Georges River LGA House Hurstville (2220) Unit Georges River LGA Unit
The market comparison graph provides a comparative trend for median price of houses and units over the past 5 years. The main LGA chosen was based on their proximity to the main suburb analysed, which is Hurstville.


Less than$599,999
$600,000to $699,999 $700,000to$799,999 $800,000 to $899,999
$900,000 andabove
RENTAL GROWTH 2025€
House rental yields in Hurstville¥ were 2.7% as of June 2025,on par with Georges River LGA(2.6%) and Sydney Metro (2.7%). Median house rental price in Hurstville¥ did decline by -9.9% in the past 12months to Q2 2025,at $730per week; and the number of houses rented also decreased, by -2.4% (to 41houses) in Q2 2025.This suggests a stabilisation in the rental market, which is not unusual forblue-chip suburbs. A more affordable rental market is beneficial for renters.
4+ bedroom houses have provided investors with +4.3%rental growth annually, achieving a median rent of $1,200per week.
Hurstville¥ recorded a vacancy rate of 1.6%in June 2025,above the Georges River LGA average of 1.3% but on par toSydney Metro’s 1.6%. Vacancy rates have declined from 2.0% in June 2024, which indicates a tighter rental market. Also, a 1.6% vacancy rate sits far below The Real Estate Institution of Australia’s healthy benchmark of 3.0%at 1.6%, suggesting quick occupancyof rental homes in Hurstville¥ . There is a conducive environment for investors, especially as house and unit prices (thus entry prices) have stabilised in the past 12 months to Q22025.
RENTAL VACANCY RATES 2025


Hurstville (2220)
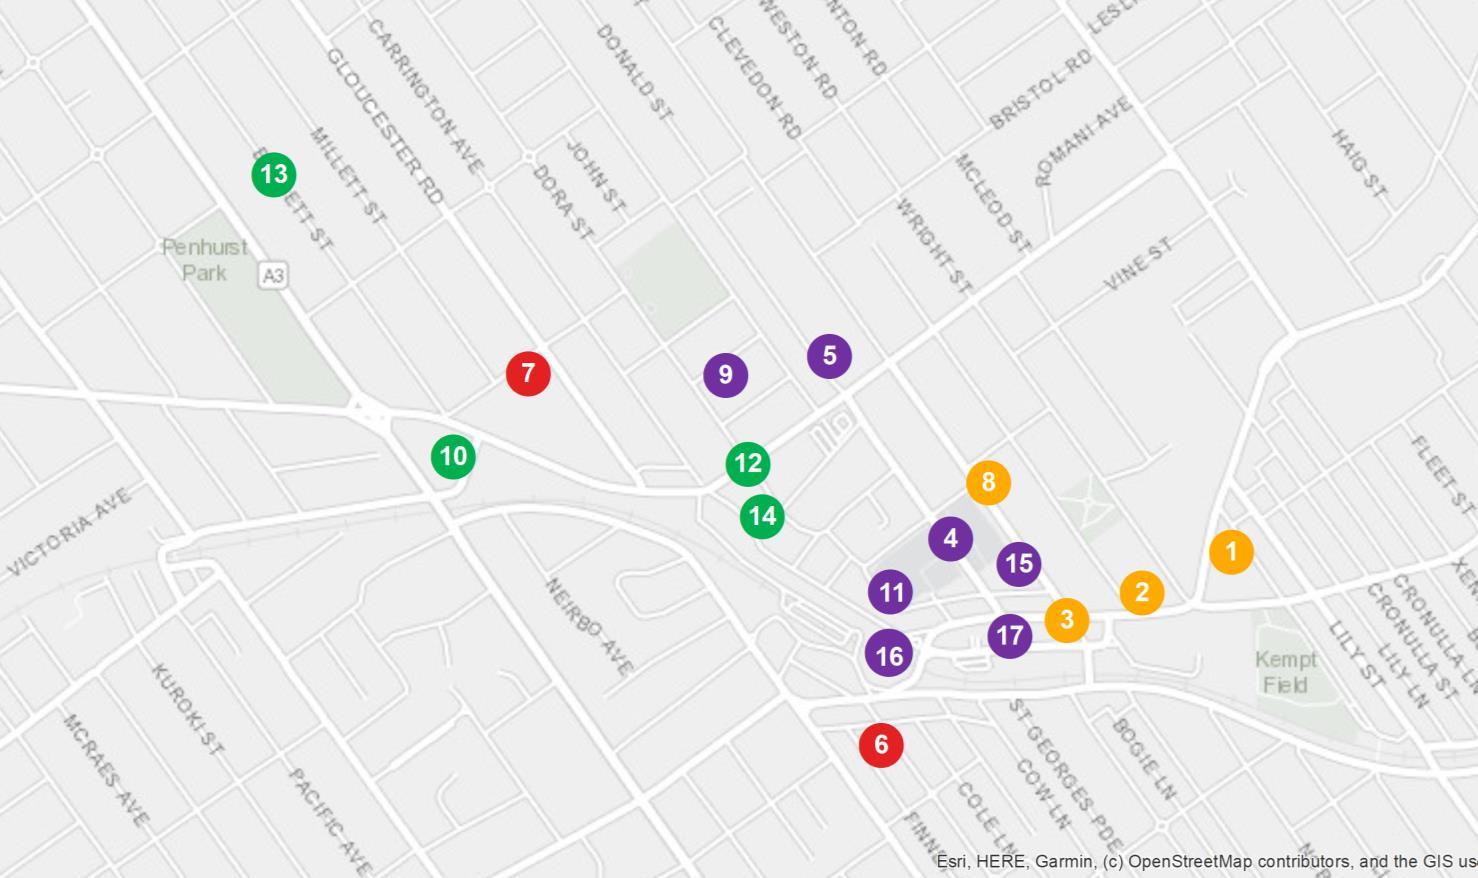
PROJECT DEVELOPMENT MAP 2025 ₳

HURSTVILLE

RESEARCH SERVICES
Our research services span over every suburb, LGA,and state within Australia; captured in a variety of standard and customised products, andinclude:
• Advisory and consultancy
• Market analysis including profiling and trends
• Primary qualitative and quantitative research
• Demographic and target market analysis
• Geographic information mapping
• Project analysis including product and pricing recommendations
• Rental and investment return analysis
OUR KNOWLEDGE
Access to accurate and objective research is the foundation of all good property decisions.
OUR PEOPLE
Our research team is made up of highly qualified researchers who focus solely on propertyanalysis.


REFERENCES
* Hurstville sales market data and key indicators encapsulates aggregate property market conditions within the suburb of Hurstville.
** Estimated values are based on construction value provided by the relevant data authority and does not reflect commercial and/or re-sale value.
# 2024/25encapsulates sales transactions for the 2024 full year (01/01/2024 – 31/12/2024)and 1st half 2025 (01/01/2025 – 30/06/2025).
€ Annual rental growth is a comparison between 1H 2024 (01/01/2024 – 30/06/2024)and 1H 2025 (01/01/2025 – 30/06/2025) house median rent figures.
§ Hurstville rental market data encapsulates aggregate property conditions within the postcode of 2220.
¥ Rental yields shown are as reported as of June 2025.
₳ Project development map showcases a sample of upcoming projects only, due to accuracy of addresses provided by the data provider for geocoding purposes.
£ Projects refers to the top developments within the suburb of Hurstville.
µ Estimated value is the value of construction costs provided by relevant data authority, it does not reflect the project’s sale/commercial value.
ψ Commencement date quoted for each project is an approximate only, as provided by the relevant data authority, PRD does not hold any liability to the exact date.
Source: APM Pricefinder, Cordell Connect database, SQM Research, Esri ArcGIS.
Disclaimer: PRD does not give any warranty in relation to the accuracy of the information contained in this report. If you intend to rely upon the information contained herein, you must take note that the information, figures and projections have been provided by various sources and have not been verified by us. We have no belief one way or the other in relation to the accuracy of such information, figures and projections. PRD will not be liable for any loss or damage resulting from any statement, figure, calculation or any other information that you rely upon that is contained in the material.
Prepared by PRD Research. © All medians and volumes are calculated by PRD Research. Use with written permission only. All other responsibilities disclaimed. © Copyright PRD 2025.