

Hunter Valley Market Update 2nd Half 2024


HOUSE SALES
FROM LAST HOUSE MEDIAN PRICE HOUSE RENTAL PRICE
SALES
In Q2 2024, Hunter Valley* recorded a median house price of $760,000, and a median unit price of $547,500.This represents annual (Q2 2023 –Q2 2024)median price growth of 3.4% forhouses 3.3%for units. On a quarterly basis (Q1 – Q22024), median price grew by 1.3% for houses and 8.4%for units. Over the past 12month to Q2 2024,total house sales grew by 10.5% for house (to 158sales), indicating strong demand in the housing market. Conversely, unit sales decreased by -21.2% forunits (to 26 sales), highlighting a potential undersupply. Now is an opportune time forproperty owners to capitalise on their investments. 54
HALF YEAR
Hunter Valley is set to see approximately$581.8Mworthofnew projectscommencinginthe2nd half of2024
PRICE
RENTAL PRICE

MEDIAN PRICE Q2 2024
$760K $547K
MEDIAN PRICE Q2 2024
AVERAGE DAYS ON MARKET Q2 2024
AVERAGE DAYS ON MARKET Q2 2024


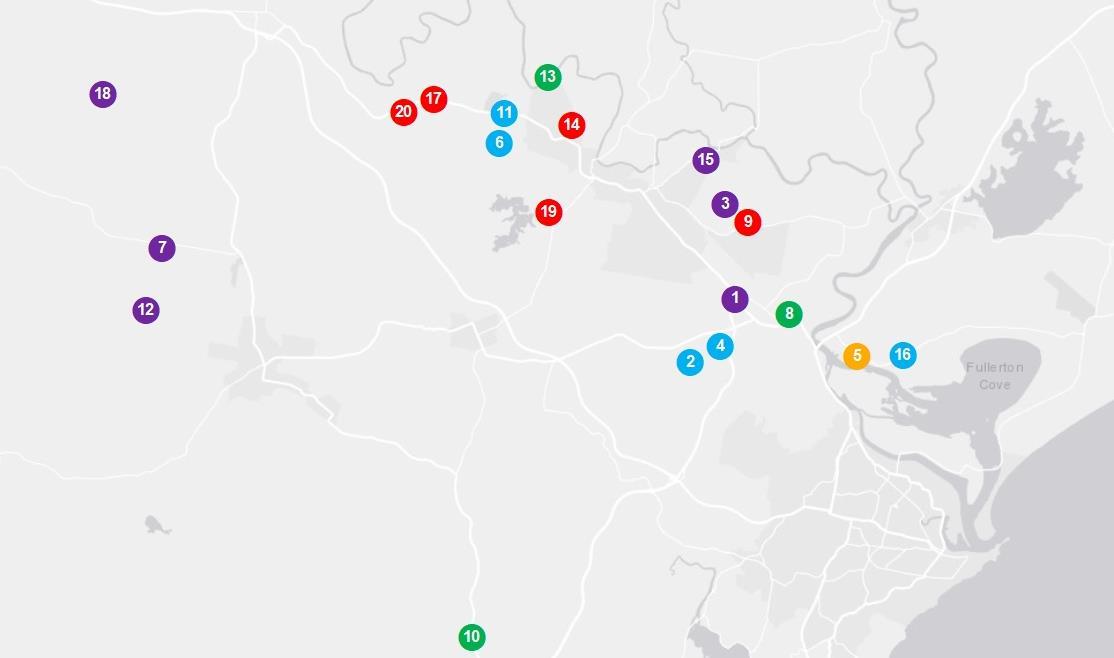
Akey residentialdevelopmentin the2nd half of 2024 is theRaymondTerraceRoad &SettlersBoulevardResidential SubdivisionStages1-6($17.2M).Thisis the reconfigurationof 193TorrensTitle lots. Otherdevelopmentsinclude:
• BeresfieldBatteryEnergyStorage System($203.3M,Commercial)
• 1134 JohnRenshawDriveIndustrial Subdivision($76.9M,Industrial)
• 37& 39 LaverickAvenue&Tomago RoadIndustrialUnits($32.0M,Mixeduse)
• RichmondVale Rail Trail($23.1M, Infrastructure)
Newland developmentsrequiretime to complete,and withonly a limited number of ready-stockdevelopmentsavailable in the2nd half of 2024, thesupplyremains constrained.Thusit is expectedtofurther driveup medianprices.


AVERAGE VENDOR DISCOUNT*
Average vendor discount reflects the average percentage difference between the first list price and final sold price. A lower percentage difference (closer to 0.0%) suggests that buyers are willing to purchase close to the first asking price of a property.


Average vendor discounts between Q2 2023and Q2 2024 have tightened to -3.0% for houses and -2.3% for units. The peak discount for houses has passed in Q4 2024and for units in Q3 2023. Market conditions in Hunter Valley* continue to favorbuyers, with vendors still willing to accept below the initial listing price. However, the market is beginning to shift, thus buyers should act fast.
The suburb of East Maitland has historically outperformed the wider Maitland Local Government Area (LGA) in both and unit median prices for the past 5years. 2024# saw this trend continued with unit prices in East Maitland suburb growing at a faster pace compared to the LGA.
The dominant proportion of homes sold in Hunter Valley* across 2024# were in the middle-price bracket between $700,000to $749,999(28.8%). The premium market is growing, with 19.6%of house sales exceeding $900,000. On the other hand, most units were sold in the premium price bracket above $600,000(35.0%). Affordable options are still available, with 16.9%of units sold below $449,999 and 13.7% of houses sold for less than$599,999.
MARKET COMPARISON
The market comparison graph provides a comparative trend for the median price of houses and unit over the past 5years. The main areas profiled are chosen based on their proximity to the main suburb analysed, which is East Maitland.


PRICE BREAKDOWN 2024#


$600,000 to
$700,000 to $799,999
$800,000 to $899,999
$900,000 and above


RENTAL GROWTH 2024€
House rental yields in Hunter Valley¥ was 3.6%in July 2024, higher than Sydney Metro (2.8%). This was paired with a 3.4%median house price increase in the past 12months toQ2 2024, to $612per week, and an -4.5% decline in the number of houses rented (to 147rentals). Average days decreased by 66.9%to 54 days. Unit market presents the same pattern. This suggests an undersupplied rental market forboth property types, which is advantageous for investors, especially given the more affordable prices compared to Sydney Metro.
2- bedroom houses have provided investors with +8.0%rental growth annually, achieving a median rent of $475per week.
Hunter Valley¥ recorded a vacancy rate of 1.1% as of July 2024, on par with Maitland LGA’ 1.1% average but below Sydney Metro’s 1.7% average. Vacancy rates in Hunter Valley¥ have decreased slightly over the past 12 months, due to a return of renters toan already tight market. A 1.1% figure is well below the Real Estate Institute of Australia’s healthy benchmark of 3.0%, indicating quicker property occupancies. Thus a conducive environment forinvestors.
RENTAL VACANCY RATES 2024


PROJECT DEVELOPMENT 2 nd HALF MAP 2024 ₳


RESEARCH SERVICES
Our research services span over every suburb, LGA,and state within Australia; captured in a variety of standard and customised products, andinclude:
• Advisory and consultancy
• Market analysis including profiling and trends
• Primary qualitative and quantitative research
• Demographic and target market analysis
• Geographic information mapping
• Project analysis including product and pricing recommendations
• Rental and investment return analysis
OUR KNOWLEDGE
Access to accurate and objective research is the foundation of all good property decisions.
OUR PEOPLE
Our research team is made up of highly qualified researchers who focus solely on propertyanalysis.


REFERENCES
* Hunter Valley market data and key indicators encapsulates aggregate property market conditions within the suburbs of Aberglasslyn, Ashtonfield, East Maitland, Rutherford and Thornton.
** Estimated values are based on construction value provided by the relevant data authority and does not reflect commercial and/or re-sale value.
# 2024 encapsulates sales transactions for 1st Half 2024 (01/01/2024 – 30/06/2024) only, other years encapsulates sales transactions for the full year (i.e 01/01 to 31/12 of the relevant year).
€ Annual rental growth is a comparison between Q2 2023 (01/04/2023 – 30/06/2023)and Q2 2024 (01/04/2024 – 30/06/2024) house median rent figures.
¥ Hunter Valley market data encapsulates aggregate property conditions within the postcode of 2323.
§ Rental yields shown are as reported as of July 2024.
₳ Project development map showcases a sample of upcoming projects only, due to accuracy of addresses provided by the data provider for geocoding purposes.
£ Projects refers to the top developments within the suburbs of 2320, 2321, 2322, and 2323.
µ Estimated value is the value of construction costs provided by relevant data authority, it does not reflect the project’s sale/commercial value.
ψ Commencement date quoted for each project is an approximate only, as provided by the relevant data authority, PRD does not hold any liability to the exact date.
Source: APM Pricefinder, Cordell Connect database, SQM Research, Esri ArcGIS.
Disclaimer: PRD does not give any warranty in relation to the accuracy of the information contained in this report. If you intend to rely upon the information contained herein, you must take note that the information, figures and projections have been provided by various sources and have not been verified by us. We have no belief one way or the other in relation to the accuracy of such information, figures and projections. PRD will not be liable for any loss or damage resulting from any statement, figure, calculation or any other information that you rely upon that is contained in the material.
Prepared by PRD Research. © All medians and volumes are calculated by PRD Research. Use with written permission only. All other responsibilities disclaimed. © Copyright PRD 2024.
