
Derwent Valley Market Update 2nd Half 2024

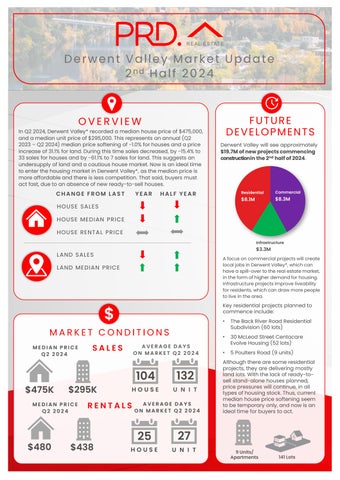
In Q2 2024, Derwent Valley* recorded a median house price of $475,000, and a median unit price of $295,000.This represents an annual (Q2 2023– Q2 2024)median price softening of -1.0% forhouses and a price increase of 31.1% for land. During this time sales decreased, by -15.4% to 33sales for houses and by -61.1% to 7sales for land. This suggests an undersupply of land and a cautious house market. Now is an ideal time to enter the housing market in Derwent Valley*, as the median price is more affordable and there is less competition. That said, buyers must act fast, due to an absence of new ready-to-sell houses.


Derwent Valley will see approximately $19.7Mofnewprojectscommencing constructioninthe2nd halfof2024
HOUSE SALES YEAR HALF YEAR CHANGE FROM LAST
HOUSE MEDIAN PRICE
HOUSE RENTAL PRICE
LAND SALES
LAND MEDIAN PRICE

MEDIAN PRICE Q2 2024
$475K $295K
MEDIAN PRICE Q2 2024
AVERAGE DAYS ON MARKET Q2 2024
104
AVERAGE DAYS ON MARKET Q2 2024


Afocuson commercialprojectswill create local jobsin DerwentValley*, whichcan havea spill-overto the real estatemarket, in the form of higher demandfor housing. Infrastructureprojectsimprove liveability for residents,whichcan draw morepeople to live in the area.
Key residential projects planned to commence include:
• The Back River Road Residential Subdivision (60 lots)
• 30McLeod Street Centacare Evolve Housing (52 lots)
• 5 Poulters Road (9 units)
Although there are some residential projects, they are delivering mostly land lots. With the lack of ready-tosell stand-alone houses planned, price pressures will continue, in all types of housing stock. Thus,current median house price softening seem to be temporary only, and now is an ideal time for buyers toact.


AVERAGE VENDOR DISCOUNT*
Average vendor discount reflects the average percentage difference between the first list price and final sold price. A lower percentage difference (closer to 0.0%) suggests that buyers are willing to purchase close to the first asking price of a property.


Between Q2 2023and Q2 2024the average house vendor discount swung froma premium to a discount, of -3.4%. Average land vendor discount have tightened to a lesser discount in Q2 2024, of -1.8%. House market conditions in Derwent Valley* now favourbuyers, as sellers are willing to accept lower than the first list price. Land buyers still benefit from a discount, although less than prior. This suggests there is limited time, thus buyers must act fast.
The suburb of New Norfolk has historically tracked on par with the wider Derwent Valley Local Government Area (LGA) in bothhouse and land median prices. This said, 2024# has seen New Norfolk land prices fall below the LGA’s median prices, creating an opportunity for buyers.
The dominant proportion of homes sold in Derwent Valley* across 2024# were in the premium price bracket of $550,000and above (27.0%). Thatsaid, 23.8%of house sales were in the more affordable price bracket between $450,000and $499,999; suggesting there is a home for every budget. Vacant land recorded a dominant middle price bracket between $200,000and $299,999(46.7%).
MARKET COMPARISON
New Norfolk (7140) House
New Norfolk (7140) Land
Derwent Valley LGA House
Derwent Valley LGA Land
The market comparison graph provides a comparative trend forthe median price of houses and unit over the past 5 years. The suburb chosen was based on their proximity to the main LGA analysed, which is New Norfolk*.


PRICE BREAKDOWN 2024#


$400,000 to $449,999
$450,000 to $499,999
$500,000 to $549,999
$550,000 and above


Less than $99,999
$100,000 to $199,999
$200,000 to $299,999
$300,000 to $399,999
$400,000 and above
RENTAL GROWTH 2024€
House rental yields in Derwent Valley¥ was 4.3%in June 2024.,much higher than Hobart Metro (3.5%). Median house rental price has remained stable in the past 12months toQ2 2024, at$480 per week, whilst the number of houses rented reached a high point of 206. The unit market shows a median price increase of 1.9%, to $438per week, while the number of units rented declined by -29.5%. Overall this suggests a highly demanded rental market.
2bedroom houses have provided investors with +3.4%rental growth annually, achieving a median rent of $450per week.
Derwent Valley¥ recorded a vacancy rate of 0.9% in June 2024, well below Hobart Metro’s 1.5% average. Vacancy rates in Derwent Valley¥ have trended down over the past 12 months, indicating a tighter rental demand. Further, a 0.9% vacancyrate is significantly below that of the Real Estate Institute of Australia’s ‘Healthy’ Benchmark of 3.0%, indicating quicker occupancy of rental properties. Combined with median rental price growth this suggests a conducive and sustainable environment for investment.
RENTAL VACANCY RATES 2024


NewNorfolk¥
New Norfolk (7140)
Derwent Valley LGA Hobart Metro
PROJECT DEVELOPMENT MAP 2
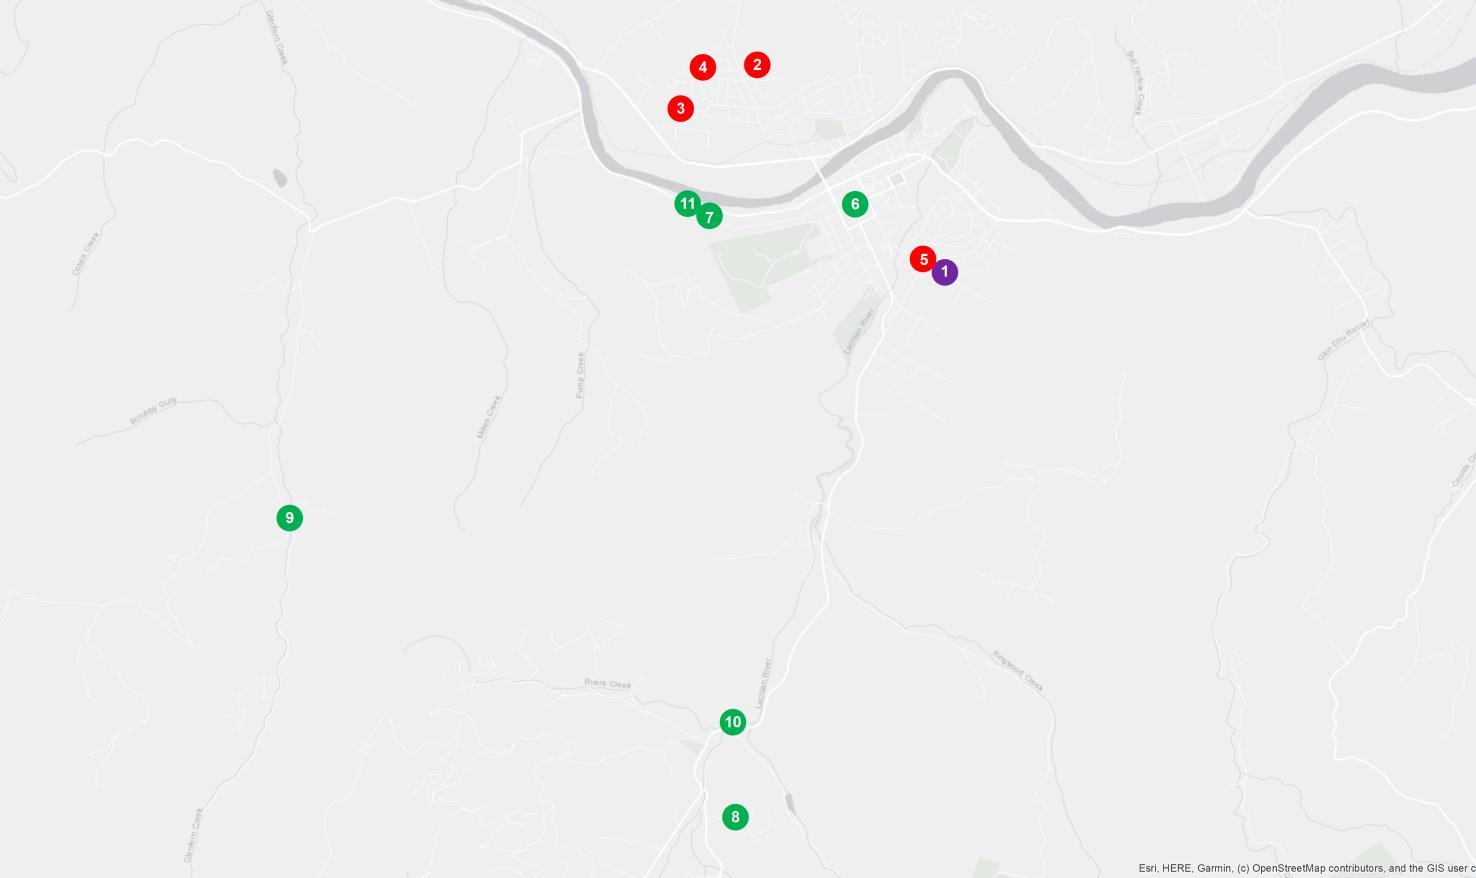

DERWENT VALLEY


RESEARCH SERVICES
Our research services span over every suburb, LGA,and state within Australia; captured in a variety of standard and customised products, andinclude:
• Advisory and consultancy
• Market analysis including profiling and trends
• Primary qualitative and quantitative research
• Demographic and target market analysis
• Geographic information mapping
• Project analysis including product and pricing recommendations
• Rental and investment return analysis
OUR KNOWLEDGE
Access to accurate and objective research is the foundation of all good property decisions.
OUR PEOPLE
Our research team is made up of highly qualified researchers who focus solely on propertyanalysis.


REFERENCES
* Derwent Valley sales market data and key indicators encapsulates aggregate property market conditions within the Derwent Valley LGA.
** Estimated values are based on construction value provided by the relevant data authority and does not reflect commercial and/or re-sale value.
# 2024 encapsulates sales transactions for 1st Half 2024 (01/01/2024 – 30/06/2024) only, other years encapsulates sales transactions for the full year (i.e 01/01 to 31/12 of the relevant year).
€ Annual rental growth is a comparison between Q2 2023 (01/04/2023 – 30/06/2023)and Q2 2024 (01/04/2024 – 30/06/2024) house median rent figures.
¥ Derwent Valley rental market data encapsulates aggregate property conditions within the postcode of 7140.
§ Rental yields shown are as reported as of June 2024.
₳ Project development map showcases a sample of upcoming projects only, due to accuracy of addresses provided by the data provider for geocoding purposes.
£ Projects refers to the top developments within the Derwent Valley LGA.
µ Estimated value is the value of construction costs provided by relevant data authority, it does not reflect the project’s sale/commercial value.
ψ Commencement date quoted for each project is an approximate only, as provided by the relevant data authority, PRD does not hold any liability to the exact date.
Source: APM Pricefinder, Cordell Connect database, SQM Research, Esri ArcGIS.
Disclaimer: PRD does not give any warranty in relation to the accuracy of the information contained in this report. If you intend to rely upon the information contained herein, you must take note that the information, figures and projections have been provided by various sources and have not been verified by us. We have no belief one way or the other in relation to the accuracy of such information, figures and projections. PRD will not be liable for any loss or damage resulting from any statement, figure, calculation or any other information that you rely upon that is contained in the material.
Prepared by PRD Research. © All medians and volumes are calculated by PRD Research. Use with written permission only. All other responsibilities disclaimed. © Copyright PRD 2024.