
Beverly Hills Market Update 2nd Half 2025

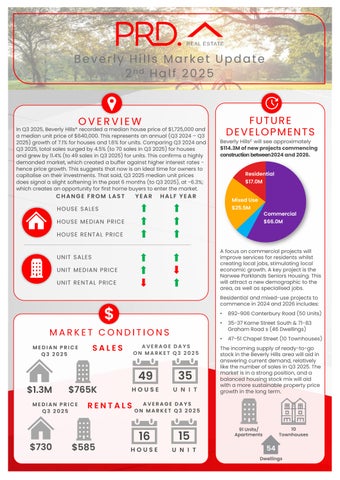
In Q3 2025, Beverly Hills* recorded a median house price of $1,725,000and a median unit price of $640,000.This represents anannual (Q3 2024 – Q3 2025)growth of 7.1% forhouses and 1.6%for units. Comparing Q3 2024and Q3 2025,total sales surged by 4.5% (to 70 sales in Q3 2025)for houses and grew by 11.4%(to 49 sales in Q3 2025)for units. This confirms a highly demanded market, which created a buffer against higher interest rateshence price growth. This suggests that now is an ideal time for owners to capitalise ontheir investments. Thatsaid, Q3 2025median unit prices does signal a slight softening in the past 6 months (to Q32025), at -6.3%; which creates an opportunity for first home buyers to enter the market.

HOUSE SALES
FROM LAST HOUSE MEDIAN PRICE HOUSE RENTAL PRICE


Beverly Hills£ will see approximately $114.3Mofnewprojectscommencing constructionbetween2024and2026.

HALF YEAR


A focus oncommercial projects will improve services for residents whilst creating local jobs,stimulating local economic growth. A key project is the Narwee Parklands Seniors Housing. This will attract a new demographic to the area, as well as specialised jobs.
Residential and mixed-use projects to commence in 2024and 2026 includes:
• 892-906 Canterbury Road (50 Units)
• 35-37Karne Street South& 71-83 Graham Road s (46 Dwellings)
• 47-51 Chapel Street (10 Townhouses)
MEDIAN PRICE Q3 2025 MEDIAN PRICE Q3 2025
AVERAGE DAYS ON MARKET Q3 2025
49 $1.3M $765K
AVERAGE DAYS ON MARKET Q3 2025
The incoming supply of ready-to-go stock in the Beverly Hills area will aid in answering current demand, relatively like the number of sales in Q3 2025.The market is in a strong position, and a balanced housing stock mix will aid with a more sustainable property price growth in the long term.


AVERAGE VENDOR DISCOUNT*
Average vendor discount reflects the average percentage difference between the first list price and final sold price. A lower percentage difference (closer to 0.0%) suggests that buyers are willing to purchase close to the first asking price of a property.


Average vendor discounts between Q3 2024and Q3 2025 have remains a premium for houses, but at a slightly lower rate of 6.8%(compared to 7.7% in Q3 2023). This indicates that although the market is still favouring sellers, buyers can slightly benefit too. Average vendor discounts in the unit's market have swung from a premium of 1.9% to sit at 0.0%, meaning neither buyers or sellers are at a greater advantage (in terms of discounts). Combined this creates a unique opportunity for buyers to transact.
The suburb of Beverly Hills has outperformed the wider Canterbury-Bankstown Local Government Area (LGA) in both median house and unit prices forthe past 5years. This continued tobe the case in 2025#
Most of the homes sold in Beverly Hills* in 2025# were split evenly between the more affordable price bracket of $1.35M-$1.6M(31.5%) and the middle price point, of $1.6M$1.85M (26.6%). In contrast, units had most sales (36.2%)in the premium price bracket of $800,000and above; but had strong sales numbers in the affordable price bracket of $500,000-$599,999(22.7%)as well. Overall, this indicates there is a home for every budget in Beverly Hills*.
MARKET COMPARISON
The market comparison graph provides a comparative trend for median price of houses and units over the past 5 years. The main LGA chosen was based on their proximity to the main suburb analysed, which is Beverly Hills.


than $499,999
$500,000 to $599,999
$600,000 to $699,999 $700,000 to $799,999 $800,000 and above
RENTAL GROWTH 2025€
House rental yields in Beverly Hills¥ was 3.0%as of September 2025, slightly above CanterburyBankstown LGA and the Sydney Metro averages (both at 2.7%). Further, median house rental price increased by 6.3%in the past 12months toQ3 2025, at $850per week. At the same time the number of houses rented decreased, by-20.3%(to 63houses) in Q3 2025; suggesting an undersupply of rental homes This indicates a highly demanded and competitive house rental market in Beverly Hills¥, which is beneficial toinvestors.
2-bedroom houses have provided investors with +6.3%rental growth annually, achieving a median rent of $670per week.
Beverly Hills¥ recorded a vacancy rate of 1.0% in September 2025, slightly above the CanterburyBankstown LGA average of 0.9%but below Sydney Metro’s 1.3%. Vacancy rates have fluctuated in the past 12months, but overall showed an increasing pattern, due to anincrease in investor activity However, a 1.0%vacancy rate is still well below the Real Estate Institution of Australia’s healthy benchmark of 3.0%, indicating quicker occupancy of rental properties in Beverly Hills¥
RENTAL VACANCY RATES 2025


BeverlyHills (2209)
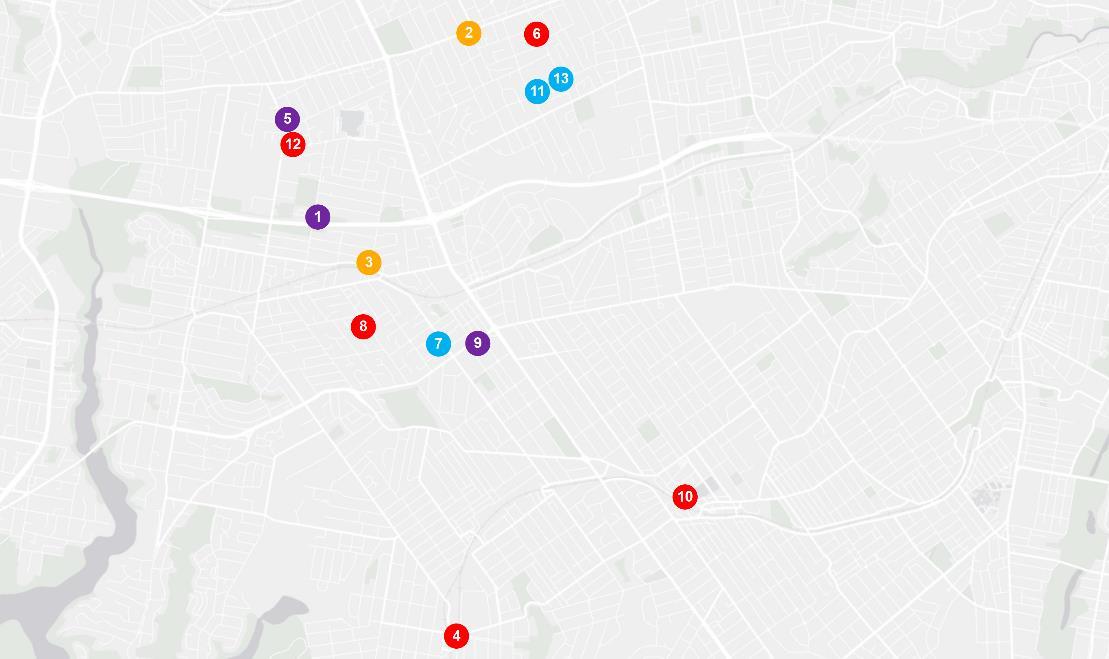
PROJECT DEVELOPMENT MAP 2024-2026 ₳

BEVERLY HILLS


RESEARCH SERVICES
Our research services span over every suburb, LGA,and state within Australia; captured in a variety of standard and customised products, andinclude:
• Advisory and consultancy
• Market analysis including profiling and trends
• Primary qualitative and quantitative research
• Demographic and target market analysis
• Geographic information mapping
• Project analysis including product and pricing recommendations
• Rental and investment return analysis


OUR KNOWLEDGE
Access to accurate and objective research is the foundation of all good property decisions.
OUR PEOPLE
Our research team is made up of highly qualified researchers who focus solely on propertyanalysis.


REFERENCES
* Beverly Hills market data and key indicators encapsulates aggregate property market conditions within the suburbs of Beverly Hills, Roselands, and Narwee.
** Estimated values are based on construction value provided by the relevant data authority and does not reflect commercial and/or re-sale value.
# 2025 encapsulates sales transactions for Q1 – Q3 2025 (01/01/2025 – 30/09/2025) only, other years encapsulates sales transactions for the full year (i.e 01/01 to 31/12 of the relevant year).
€ Annual rental growth is a comparison between Q3 2024 (01/07/2024 – 30/09/2024)and Q3 2025 (01/07/2025 – 30/09/2025) house median rent figures.
¥ Beverly Hills market data encapsulates aggregate property conditions within the postcode of 2209.
§ Rental yields shown are as reported as of September 2025.
₳ Project development map showcases a sample of upcoming projects only, due to accuracy of addresses provided by the data provider for geocoding purposes.
£ Projects refers to the top developments within the suburbs of Beverly Hills, Roselands, and Narwee.
µ Estimated value is the value of construction costs provided by relevant data authority, it does not reflect the project’s sale/commercial value.
ψ Commencement date quoted for each project is an approximate only, as provided by the relevant data authority, PRD does not hold any liability to the exact date.
Source: APM Pricefinder, Cordell Connect database, SQM Research, Esri ArcGIS.
Disclaimer: PRD does not give any warranty in relation to the accuracy of the information contained in this report. If you intend to rely upon the information contained herein, you must take note that the information, figures and projections have been provided by various sources and have not been verified by us. We have no belief one way or the other in relation to the accuracy of such information, figures and projections. PRD will not be liable for any loss or damage resulting from any statement, figure, calculation or any other information that you rely upon that is contained in the material.
Prepared by PRD Research. © All medians and volumes are calculated by PRD Research. Use with written permission only. All other responsibilities disclaimed. © Copyright PRD 2025.