
Clarence Market Update 1st Half 2025

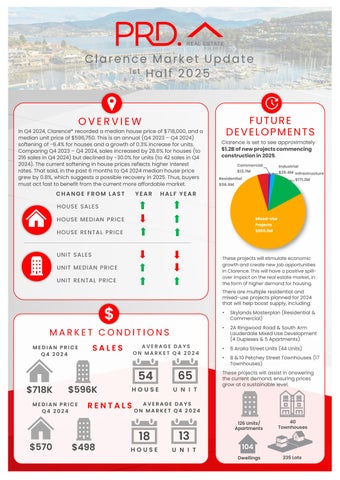
In Q4 2024, Clarence* recorded a median house price of $718,000,and a median unit price of $596,750.This is an annual (Q4 2023 – Q4 2024) softening of -6.4% for houses and a growth of 0.3%increase for units. Comparing Q4 2023– Q4 2024,sales increased by 28.6% forhouses (to 216 sales in Q4 2024) but declined by -30.0% for units (to 42sales in Q4 2024). The current softening in house prices reflects higher interest rates. That said, in the past 6 months to Q4 2024median house price grew by 0.8%,which suggests a possible recovery in 2025.Thus, buyers must act fast tobenefit from the current more affordable market.

HOUSE SALES YEAR HALF YEAR CHANGE FROM LAST
HOUSE MEDIAN PRICE
HOUSE RENTAL PRICE
SALES


Clarence is set to see approximately $1.2Bofnewprojectscommencing constructionin2025.

PRICE
RENTAL PRICE

MEDIAN PRICE Q4 2024
$718K $596K
MEDIAN PRICE Q4 2024
AVERAGE DAYS ON MARKET Q4 2024
54
AVERAGE DAYS ON MARKET Q4 2024


These projectswill stimulate economic growthandcreatenew jobopportunities in Clarence.This will have apositive spilloverimpacton the real estatemarket,in the formofhigher demandforhousing.
There aremultiple residential and mixed-use projectsplanned for 2024 that will help boost supply,including:
• SkylandsMasterplan (Residential & Commercial)
• 2A Ringwood Road & South Arm Lauderdale Mixed UseDevelopment (4 Duplexes & 5 Apartments)
• 6 Aralia Street Units (44 Units)
• 8 &10 PetcheyStreet Townhouses (17 Townhouses)
These projectswill assist in answering the current demand, ensuring prices grow at a sustainable level.


AVERAGE VENDOR DISCOUNT*
Average vendor discount reflects the average percentage difference between the first list price and final sold price. A lower percentage difference (closer to 0.0%) suggests that buyers are willing to purchase close to the first asking price of a property.


House Unit
In the past 12months to Q4 2024average vendor discount, for both houses and units, have swung toa premium, of 0.2% and 0.4%, respectively. The market now favours sellers, after previously favouring buyers for the past 18 months. This means buyers must offer higher thanthe first list price. Now is an ideal time to for buyers toact, before the market trends further north, with higher premiums.
The suburb of Clarence has historically been onpar with the wider Clarence City Local Government Area (LGA). In 2024 this trend has continued for bothhouse and unit median prices, with median prices in both the suburb and LGA growing at a slower pace.
The dominant proportion of homes sold in Clarence* in 2024# was equally split between the more affordable price point of $599,999and below (25.1%) and premium price of $900,000and above (24.7%). The unit market shows ample opportunities in the more affordable and middle-priced market, with 29.4%of sales in the $450,000- $549,999price bracket and 29.9%of sales in the $550,000- $649,000price bracket. Overall, this shows that there is a home for many budgets in Clarence*, in good news for first home buyers.
MARKET COMPARISON
The market comparison graph provides a comparative trend for the median price of houses and units over the past 5 years. The main LGA profiled was chosen based on their proximity to the main suburb analysed, which is Clarence.


to $899,999
and above


Less than $449,999 $450,000 to $549,999 $550,000 to $649,999 $650,000 to $749,999 $750,000 and above
RENTAL GROWTH 2024€
House rental yields in Clarence * was 3.7% in December, slightly above Hobart Metro (3.6%). This was paired with a 3.6%increase in median rent price in the past 12 months to Q4 2024,at $570per week. The number of houses rented decreased by -5.6% in the past 12 months, to 234 rentals in Q4 2024;which suggests anundersupply. Median unit rent price rose by 6.0% to $498, but the number of units rented increased, by 24.0%to 93units in Q4 2024. This suggests a highly demanded unit rental market. Overall, the rental market is beneficial for investors.
2-bedroom houses have provided investors with +4.3%rental growth annually, achieving a median rent of $480per week.
Clarence¥ recorded a vacancy rate of 0.3%in September 2024, below that of Clarence City LGA’s 0.8%and Hobart Metro’s 0.6%average. Vacancy rates in Clarence¥ have generally trended downwards in the past 12months, which suggests an even tighter rental market. Furthermore, 0.3%vacancy rate is significantly below the Real Estate Institution of Australia’s healthy benchmark of 3.0%, suggesting quicker occupancy of rental homes in Clarence¥
RENTAL VACANCY RATES 2024


PROJECT DEVELOPMENT MAP 2025 ₳
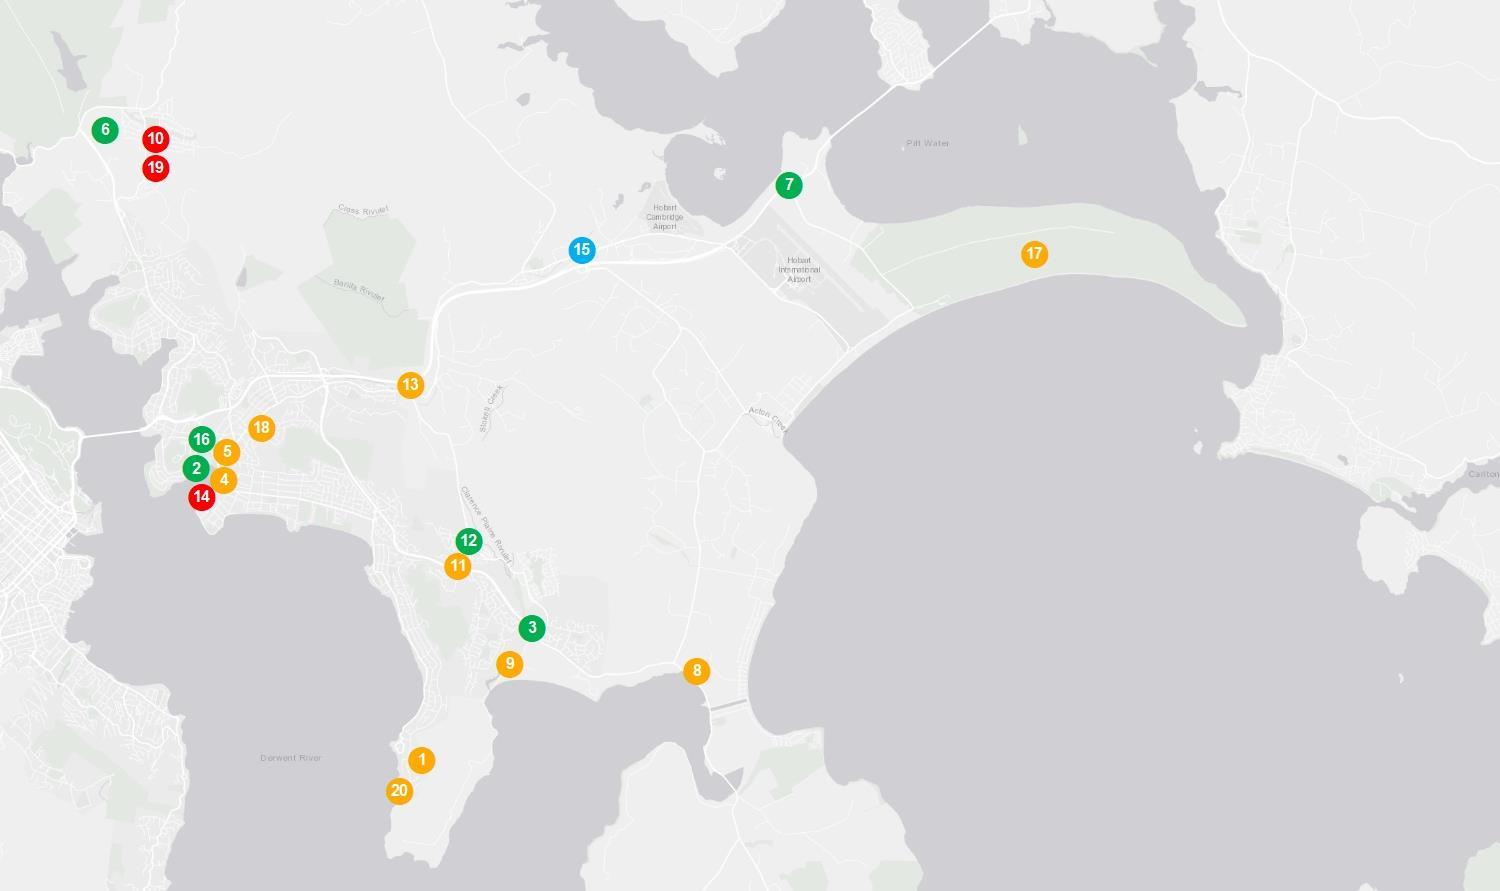

CLARENCE


RESEARCH SERVICES
Our research services span over every suburb, LGA,and state within Australia; captured in a variety of standard and customised products, andinclude:
• Advisory and consultancy
• Market analysis including profiling and trends
• Primary qualitative and quantitative research
• Demographic and target market analysis
• Geographic information mapping
• Project analysis including product and pricing recommendations
• Rental and investment return analysis
OUR KNOWLEDGE
Access to accurate and objective research is the foundation of all good property decisions.
OUR PEOPLE
Our research team is made up of highly qualified researchers who focus solely on propertyanalysis.


REFERENCES
* Clarence sales market data and key indicators encapsulates aggregate property market conditions within Clarence Local Government Area (LGA)
** Estimated values are based on construction value provided by the relevant data authority and does not reflect commercial and/or re-sale value.
# 2024 encapsulates sales transactions for the 2024 full year (01/01/2024 – 31/12/2024).
€ Annual rental growth is a comparison between Q4 2023 (01/10/2023 – 31/12/2023)and Q4 2024 (01/10/2024 – 31/12/2024) house median rent figures.
¥ Clarence rental market data encapsulates aggregate property conditions within the postcode of 7018.
§ Rental yields shown are as reported as of December 2024.
₳ Project development map showcases a sample of upcoming projects only, due to accuracy of addresses provided by the data provider for geocoding purposes.
£ Projects refers to the top developments within Clarence Local Government Area.
µ Estimated value is the value of construction costs provided by relevant data authority, it does not reflect the project’s sale/commercial value.
ψ Commencement date quoted for each project is an approximate only, as provided by the relevant data authority, PRD does not hold any liability to the exact date.
Source: APM Pricefinder, Cordell Connect database, SQM Research, Esri ArcGIS.
Disclaimer: PRD does not give any warranty in relation to the accuracy of the information contained in this report. If you intend to rely upon the information contained herein, you must take note that the information, figures and projections have been provided by various sources and have not been verified by us. We have no belief one way or the other in relation to the accuracy of such information, figures and projections. PRD will not be liable for any loss or damage resulting from any statement, figure, calculation or any other information that you rely upon that is contained in the material.
Prepared by PRD Research. © All medians and volumes are calculated by PRD Research. Use with written permission only. All other responsibilities disclaimed. © Copyright PRD 2025.