
Bremer Valley Market Update 2nd Half 2024


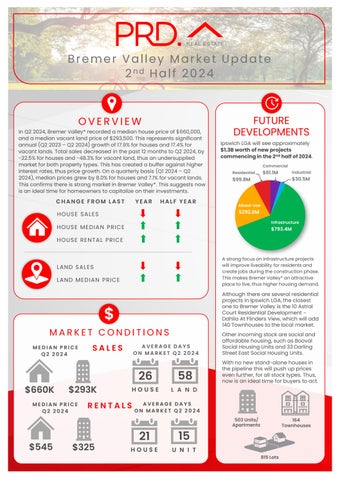
In Q2 2024, Bremer Valley* recorded a median house price of $660,000, and a median vacantland price of $293,500.This represents significant annual (Q2 2023– Q2 2024) growth of 17.9%for houses and 17.4%for vacantlands. Total sales decreased in the past 12months to Q2 2024, by -22.5% forhouses and -48.3% for vacantland, thus an undersupplied market forboth property types. This has created a buffer against higher interest rates, thus price growth. On a quarterly basis (Q1 2024 – Q2 2024), median prices grew by 8.0% for houses and 7.1% for vacantlands. This confirms there is strong market in Bremer Valley*. This suggests now is an ideal time for homeowners to capitalize on their investments.
YEAR HALF YEAR CHANGE FROM LAST

HOUSE SALES


Ipswich LGA will see approximately $1.3Bworthofnewprojects commencinginthe2nd halfof2024

HOUSE MEDIAN PRICE
HOUSE RENTAL PRICE
LAND SALES
LAND MEDIAN PRICE

MEDIAN PRICE Q2 2024


$660K $293K
MEDIAN PRICE Q2 2024
AVERAGE DAYS ON MARKET Q2 2024

26
AVERAGE DAYS ON MARKET Q2 2024


Astrongfocuson infrastructureprojects will improve liveability for residentsand createjobsduringthe constructionphase. This makesBremerValley* an attractive place to live, thushigherhousingdemand.
Although there are several residential projects in Ipswich LGA, the closest one to Bremer Valley is the 10Astral Court Residential DevelopmentDahlia At Flinders View, which will add 140Townhouses to the local market.
Other incoming stock are social and affordable housing, such as Booval Social Housing Units and 33Darling Street East Social Housing Units.
With no new stand-alone houses in the pipeline this will push up prices even further, forall stock types. Thus, now is an ideal time for buyers toact.


AVERAGE VENDOR DISCOUNT*
Average vendor discount reflects the average percentage difference between the first list price and final sold price. A lower percentage difference (closer to 0.0%) suggests that buyers are willing to purchase close to the first asking price of a property.


Average vendor discounts between Q4 2022and Q2 2024 have swung to a premium of 0.5% for houses and tightened to a discount of -2.5% for units. Thus,peak discounts seen in Q4 2022for bothproperty types have passed. Market conditions in Bremer Valley* is shifting to favoursellers, as buyers must offer either close to or above the first list price. Thus,buyers need to actquickly before prices rise further.
The suburb of Bremer Valley has historically presented a slightly more affordable market compared to the wider Ipswich Local Government Area (LGA) in both houses and land median prices for the past 5 years. In 2024#,this is still the case for units, however houses have seen an increase in prices; now onpar with the LGA.
The dominant proportion of houses sold in Bremer Valley* in 2024#were in the middle price bracket between $600,000 –$699,999(40.0%). There is almost an equal split between the house premium market, of $800,000and above, with 15.7% sales; and the most affordable market, of less than $499,999,with 12.9%sales. Overall, this suggests that there is a home for every budget in Bremer Valley*.
MARKET COMPARISON
Bremer Valley (4340) House
Ipswich LGA House
Bremer Valley (4340) Vacant Land Ipswich LGA Vacant Land
The market comparison graph provides a comparative trend for the median price of houses and unit over the past 5 years. The main LGA chosen was based on their proximity tothe main suburb analysed, which is Bremer Valley.


PRICE BREAKDOWN 2024 #


Less than $499,999
$500,000 to $599,999
$600,000 to $699,999 $700,000 to $799,999
and above


Less than $249,999
$250,000 to $274,999
$275,000 to $299,999
$300,000 to $324,999 $325,000 and above
RENTAL GROWTH 2024€
House rental yields in Bremer Valley¥ was 4.3% as of June 2024, higher than the Ipswich LGA (4.2%) and Brisbane Metro (3.4%). This was due to a 9.0%increase in median house rental price in the past 12 monthto Q2 2024, to $545 per week, and a significant 48.0%increase in the number of houses rented (to 37houses). Average days to let declined by -25.0%, to historical low level of 21 days. Overall, this suggests a high demand and competitive rental market, making Bremer Valley¥ an attractive option forinvestors.
4+ bedroom houses have provided investors with +12.0%rental growth annually, achieving a median rent of $560 per week.
Bremer Valley¥ recorded a vacancy rate of 0.4%in June 2024,well below Ipswich LGA (1.1%) and Brisbane Metro (1.1%). Vacancy rates in Bremer Valley¥ declined in the past 12months, thus a tighter and competitive rental market. Furthermore, a 0.4%vacancy rate is significantly lower than the Real Estate Institute of Australia’s healthy benchmark of 3.0%, indicating quicker occupancy of rental properties in in Bremer Valley¥, which is conducive for investors
RENTAL VACANCY RATES 2024

Bremer Valley (4340) Ipswich LGA Brisbane Metro REIA 'Healthy' Benchmark

BremerValley¥

PROJECT DEVELOPMENT MAP 2


RESEARCH SERVICES
Our research services span over every suburb, LGA,and state within Australia; captured in a variety of standard and customised products, andinclude:
• Advisory and consultancy
• Market analysis including profiling and trends
• Primary qualitative and quantitative research
• Demographic and target market analysis
• Geographic information mapping
• Project analysis including product and pricing recommendations
• Rental and investment return analysis
OUR KNOWLEDGE
Access to accurate and objective research is the foundation of all good property decisions.
OUR PEOPLE
Our research team is made up of highly qualified researchers who focus solely on propertyanalysis.


REFERENCES
* Bremer Valley sales market data and key indicators encapsulates aggregate property market conditions within the suburbs of Rosewood, Calvert, Grandchester, Thagoona, Walloon and Mount Walker.
** Estimated values are based on construction value provided by the relevant data authority and does not reflect commercial and/or re-sale value.
# 2024 encapsulates sales transactions for 1st Half 2024 (01/01/2024 – 30/06/2024) only, other years encapsulates sales transactions for the full year (i.e 01/01 to 31/12 of the relevant year).
€ Annual rental growth is a comparison between Q2 2023 (01/04/2023 – 30/06/2023)and Q2 2024 (01/04/2024 – 30/06/2024) house median rent figures.
¥ Bremer Valley rental market data encapsulates aggregate property conditions within the postcode of 4340.
§ Rental yields shown are as reported as of June 2024.
₳ Project development map showcases a sample of upcoming projects only, due to accuracy of addresses provided by the data provider for geocoding purposes.
£ Projects refers to the top developments within the Ipswich Local Government Area (LGA).
µ Estimated value is the value of construction costs provided by relevant data authority, it does not reflect the project’s sale/commercial value.
ψ Commencement date quoted for each project is an approximate only, as provided by the relevant data authority, PRD does not hold any liability to the exact date.
Source: APM Pricefinder, Cordell Connect database, SQM Research, Esri ArcGIS.
Disclaimer: PRD does not give any warranty in relation to the accuracy of the information contained in this report. If you intend to rely upon the information contained herein, you must take note that the information, figures and projections have been provided by various sources and have not been verified by us. We have no belief one way or the other in relation to the accuracy of such information, figures and projections. PRD will not be liable for any loss or damage resulting from any statement, figure, calculation or any other information that you rely upon that is contained in the material.
Prepared by PRD Research. © All medians and volumes are calculated by PRD Research. Use with written permission only. All other responsibilities disclaimed. © Copyright PRD 2024.
