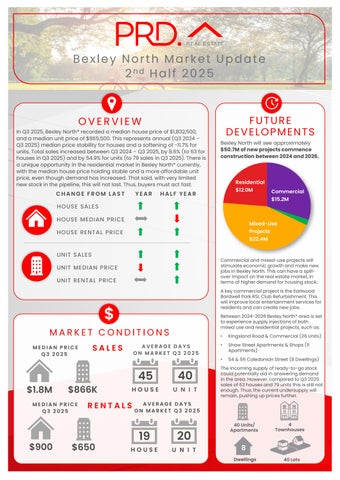

Bexley North Market Update 2nd Half 2025

In Q3 2025, Bexley North* recorded a median house price of $1,832,500, and a median unit price of $865,500.This represents annual (Q3 2024 –Q3 2025)median price stability for houses and a softening of -11.7% for units. Total sales increased between Q3 2024 – Q3 2025,by 8.6% (to 63for houses in Q3 2025)and by 54.9%for units (to 79sales in Q3 2025). There is a unique opportunity in the residential market in Bexley North* currently, with the median house price holding stable and a more affordable unit price, even though demand has increased. That said, with very limited new stock in the pipeline, this will not last. Thus,buyers must act fast.


Bexley North will see approximately $50.7Mofnewprojectscommence constructionbetween2024and2026.
HOUSE SALES YEAR HALF YEAR
FROM LAST HOUSE MEDIAN PRICE HOUSE RENTAL PRICE
PRICE
RENTAL PRICE

MEDIAN PRICE Q3 2025
$1.8M $866K
MEDIAN PRICE Q3 2025
AVERAGE DAYS ON MARKET Q3 2025
45
AVERAGE DAYS ON MARKET Q3 2025


Commercialandmixed-useprojectswill stimulate economicgrowthandmake new jobsin Bexley North.This can havea spilloverimpacton the real estatemarket,in termsof higherdemandfor housingstock.
Akey commercialprojectis the Earlwood BardwellParkRSL ClubRefurbishment.This will improve local entertainmentservicesfor residentsandcan createnewjobs.
Between2024-2026Bexley North* areaisset to experience supplyinjectionsof both mixed useandresidential projects,suchas:
• KingslandRoad& Commercial(26 Units)
• ShawStreetApartments& Shops(11 Apartments)
• 54& 56 CaledonianStreet (8Dwellings)
The incomingsupplyof ready-to-gostock couldpotentially aid in answeringdemand in the area.However,comparedto Q32025 salesof 63 housesand79unitsthis isstill not enough.Thus,the currentundersupplywill remain, pushinguppricesfurther.


AVERAGE VENDOR DISCOUNT*
Average vendor discount reflects the average percentage difference between the first list price and final sold price. A lower percentage difference (closer to 0.0%) suggests that buyers are willing to purchase close to the first asking price of a property.


In the past 12months to Q3 2025average vendor discount for houses remains ata premium, widening to a higher level of 8.0%. Average unit vendor discount is also still ata premium, however in contrast to houses have lessened to a lower premium of 3.0%.Overall, the market still favour sellers, as buyers must offer higher than the first list price. This is good news for owners, especially with a stable (for houses) and more affordable (for units) median sale price in the past 12months to Q3 2025.

The suburb of Bexley North has historically tracked on par with the Bayside Local Government Area (LGA) in house and unit median prices. This continued to be the case for houses in 2025#.However, median unit prices for2025# saw Bexley North becoming a premium than the LGA.
The dominant proportion of homes sold in Bexley North* in 2025#were in the premium price range of $2,150,000and above (26.9%). Similarly, most unit sales (41.9%) were also in the premium price bracket of$1,000,000and above (41.9%). Thatsaid affordable stock is still available, with 16.7% of houses sold atless than $1,549,999and 33.5%of units sold at less than$699,999; in good news forbuyers.
MARKET COMPARISON
Bexley North House Bayside LGA House Bexley North Unit Bayside LGA Unit
The market comparison graph provides a comparative trend for the median price of houses and unit in the past 5 years. The main LGA profiled was chosen based on their proximity to the main suburb analysed, which is
North.


PRICE


Less than $699,999
$700,000 to $799,999 $800,000 to $899,999 $900,000 to $999,999 $1,000,000 and above
Bexley
RENTAL GROWTH 2025€
House rental yields in Bexley North¥ was 2.7% in September 2025, slightly lower than the Bayside LGA (2.8%) and on par with Sydney Metro (2.7%). This was paired with a 5.9% increase in median house rental price in the past 12months to Q3 2025, at $900per week. The number of houses rented also increased, by 7.1% in the past 12months, to 60 rentals in Q3 2025. This suggests a highly demanded house rental market in Bexley North¥ , which is beneficial to investors – especially with a more stable and/oraffordable entry price in Q3 2025.
2-bedroom houses have provided investors with +14.6%rental growth annually, achieving a median rent of $745per week.
Bexley North¥ recorded a vacancy rate of 1.9% in September 2025,slightly higher than the Bayside LGA’s 1.7% and Sydney Metro 1.3%average. Vacancy rates in Bexley North¥ increased in the past 12months, due toan increase in investors entering the market. Thatsaid, a 1.9% vacancy rate is still below the Real Estate Institution of Australia’s healthy benchmark of 3.0%, suggesting quick occupancy of rental homes. This is a conductive environment forinvestors.
RENTAL VACANCY RATES 2025


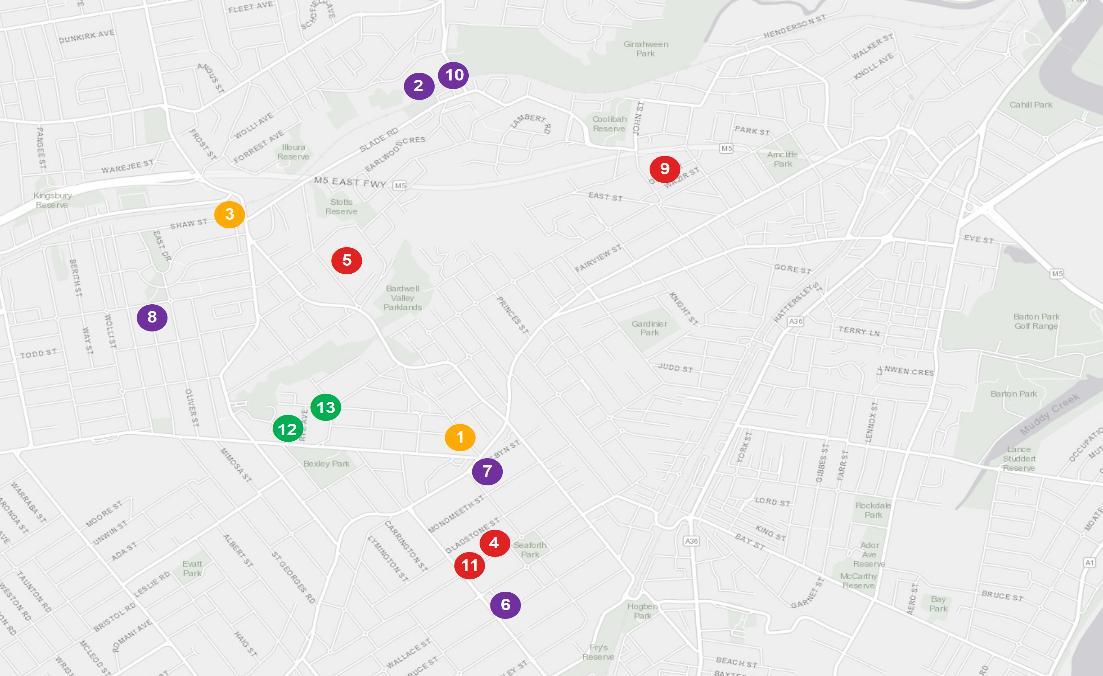
PROJECT DEVELOPMENT MAP 2024-2026 ₳

BEXELEY NORTH


RESEARCH SERVICES
Our research services span over every suburb, LGA,and state within Australia; captured in a variety of standard and customised products, andinclude:
• Advisory and consultancy
• Market analysis including profiling and trends
• Primary qualitative and quantitative research
• Demographic and target market analysis
• Geographic information mapping
• Project analysis including product and pricing recommendations
• Rental and investment return analysis
OUR KNOWLEDGE
Access to accurate and objective research is the foundation of all good property decisions.
OUR PEOPLE
Our research team is made up of highly qualified researchers who focus solely on propertyanalysis.


REFERENCES
* Bexley North market data and key indicators encapsulates aggregate property market conditions within the suburbs of Bexley North, Bexley, Bardwell Park, and Bardwell Valley.
** Estimated values are based on construction value provided by the relevant data authority and does not reflect commercial and/or re-sale value.
# 2025 encapsulates sales transactions for Q1 – Q3 2025 (01/01/2025 – 30/09/2025) only, other years encapsulates sales transactions for the full year (i.e 01/01 to 31/12 of the relevant year).
€ Annual rental growth is a comparison between Q3 2024 (01/07/2024 – 30/09/2024)and Q3 2025 (01/07/2025 – 30/09/2025) house median rent figures.
¥ Bexley North market data encapsulates aggregate property conditions within the postcode of 2207.
§ Rental yields shown are as reported as of October 2025.
₳ Project development map showcases a sample of upcoming projects only, due to accuracy of addresses provided by the data provider for geocoding purposes.
£ Projects refers to the top developments within the suburbs of Bexley North, Bexley, Bardwell Park, and Bardwell Valley.
µ Estimated value is the value of construction costs provided by relevant data authority, it does not reflect the project’s sale/commercial value.
ψ Commencement date quoted for each project is an approximate only, as provided by the relevant data authority, PRD does not hold any liability to the exact date.
Source: APM Pricefinder, Cordell Connect database, SQM Research, Esri ArcGIS.
Disclaimer: PRD does not give any warranty in relation to the accuracy of the information contained in this report. If you intend to rely upon the information contained herein, you must take note that the information, figures and projections have been provided by various sources and have not been verified by us. We have no belief one way or the other in relation to the accuracy of such information, figures and projections. PRD will not be liable for any loss or damage resulting from any statement, figure, calculation or any other information that you rely upon that is contained in the material.
Prepared by PRD Research. © All medians and volumes are calculated by PRD Research. Use with written permission only. All other responsibilities disclaimed. © Copyright PRD 2025.