
Bexley North Market Update 2nd Half 2024

In Q3 2024, Bexley North* recorded a median house price of $1,897,000, and a median unit price of $980,000.This represents annual (Q3 2023 –Q3 2024)median price growth of14.3% forhouses and 33.3%for units. Comparing Q3 2023– Q3 2024sales declined, by -26.3% (to 56 sales in Q3 2024)for houses and by -32.1% (to 53sales in Q3 2024) for units
Price growth is alongside lower amount of sales suggests the property market in Bexley North* is experiencing an undersupply, which creates a buffer against higher interest rates. This suggests that now is an ideal time forproperty owners to capitalise on their investments and sell.

HOUSE SALES YEAR HALF YEAR CHANGE FROM LAST
HOUSE MEDIAN PRICE
HOUSE RENTAL PRICE
SALES
RENTAL PRICE

MEDIAN PRICE Q3 2024


Bexley North will see approximately $89.2Mofnewprojectscommencing constructionbetween2023and2025.

$1.89M $980K
MEDIAN PRICE Q3 2024
AVERAGE DAYS ON MARKET Q3 2024
52
AVERAGE DAYS ON MARKET Q3 2023


These projectswill stimulate economic growthandmore local job opportunitiesin Bexley North, whichwill havea spill-over impacton the real estatemarket,in the form of higher demandfor housing.
From 2023-2025the Bexley North* area is setto experience housing supply injections through both mixed-use developments and solely residential developments. These include:
• Kingsland Road (26 Units)
• Abercorn Street (25 Units)
• Shaw Street (11 Apartments)
• 120 Kingsland Road North Residential Subdivision (40 Lots)
The incoming supply of ready-to-go housing stock will addresssome of the demand This is especially true for units, which can lead to a more sustainable level of price growth in the near future. That said there areno new stand-alone houses planned, and land lots taketime to develop. Thus house prices will likely continue to increase,due to low stock.


AVERAGE VENDOR DISCOUNT*
Average vendor discount reflects the average percentage difference between the first list price and final sold price. A lower percentage difference (closer to 0.0%) suggests that buyers are willing to purchase close to the first asking price of a property.


In the past 12months to Q3 2024average vendor discount have continued to remain a premium, at 4.3%for houses and 5.3%for units. This suggests that the property market in Bexley North* still favoursellers, as buyers must offer higher than the first listing price. This is especially true for units, as the Q3 2024premium is the highest seen for the past 18months. For owners, this indicates an ideal time to sell. Buyers need toact fast, before the premium paid increases even further.
The suburb of Bexley North has historically tracked on par with the wider Bayside Local Government Area (LGA) in both house and unit median prices. In 2024# ,this remains true for houses; but units in Bexley North have become a premium market compared to the wider Bayside LGA.
The dominant proportion of homes sold in Bexley North* across 2024# were in the more affordable price point of less than $1,749,999(46.4%) Similarly most of the units sold were also in the most affordable price point of below $849,999(57.0%). Despite price growth in Bexley North*, this reveals that there is still some affordably priced stock available, which is good news for first home buyers.
MARKET COMPARISON
The market comparison graph provides a comparative trend forthe median price of houses and unit over the past 5 years. The suburb chosen was based on their proximity to the main LGA analysed, which is Bexley North*.


BREAKDOWN 2024#


than $849,999 $850,000 to $949,999 $950,000 to $1,049,999 $1,050,000 to $1,149,999 $1,150,000 and above
RENTAL GROWTH 2024€
House rental yieldsin BexleyNorth¥ was 2.8%in September2024,on parcompared to the Bayside LGA (2.9%) and SydneyMetro (2.8%). This was paired with a 7.6% increase in median house rental price in the past 12 months to Q3 2024,at $850 perweek. The number of houses rented declined by -30.0%in the past 12 months, to 56 rentals in Q3 2024.This suggestsan undersupply, which is ideal for investors. Conversely the unit rental market hasseen an increase in the number of units rented but the median rent have remained consistent, indicating the market has reached an equilibrium.
4 bedroom houses have provided investors with +10.0% rental growth annually, achieving a median rent of $1,100per week.
Bexley North¥ recorded a vacancyrate of 1.5% in September2024,on par to the Bayside LGA’s1.7% and Sydney Metro’s 1.6%. Vacancy rates in Bexley North¥ have fluctuated in the past 12months, with an increasing trend in the past 6 months. This is not abnormal, considering investors arereturning to marketdue to stable cash rates.Further, a 0.8% vacancy rate issignificantly below the Real EstateInstitution of Australia’s healthy benchmark of 3.0%,suggesting quicker occupancy of rental homes in BexleyNorth¥ This createsa conductive environment for investors.
RENTAL VACANCY RATES 2024


PROJECT DEVELOPMENT MAP 2023-2025 ₳
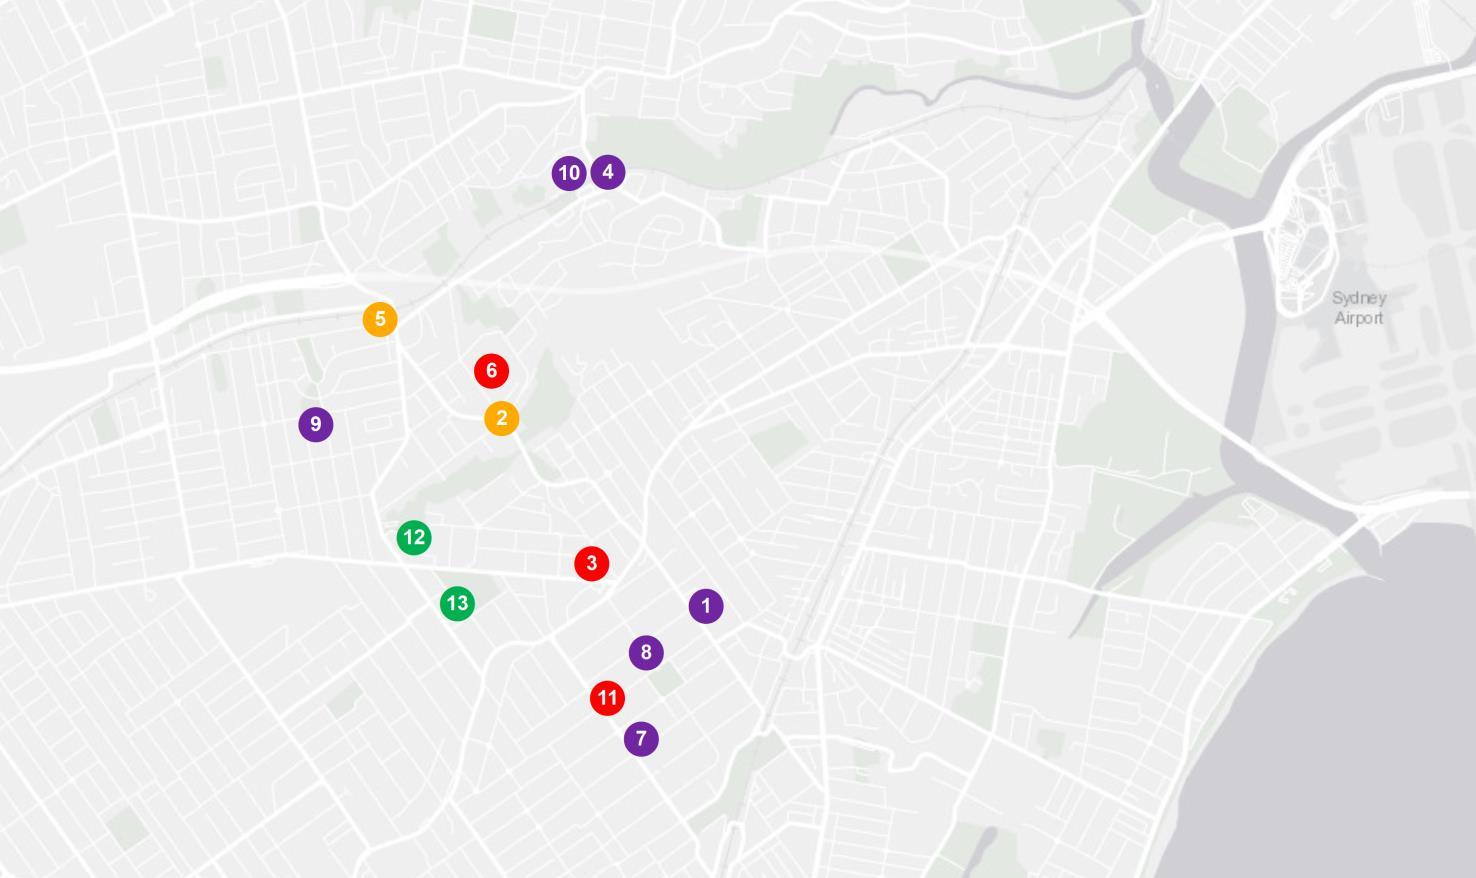

BEXLEY NORTH


RESEARCH SERVICES
Our research services span over every suburb, LGA,and state within Australia; captured in a variety of standard and customised products, andinclude:
• Advisory and consultancy
• Market analysis including profiling and trends
• Primary qualitative and quantitative research
• Demographic and target market analysis
• Geographic information mapping
• Project analysis including product and pricing recommendations
• Rental and investment return analysis
OUR KNOWLEDGE
Access to accurate and objective research is the foundation of all good property decisions.
OUR PEOPLE
Our research team is made up of highly qualified researchers who focus solely on propertyanalysis.


REFERENCES
* Bexley North market data and key indicators encapsulates aggregate property market conditions within the suburbs of Bexley North, Bexley, Bardwell Park, and Bardwell Valley.
** Estimated values are based on construction value provided by the relevant data authority and does not reflect commercial and/or re-sale value.
# 2024 encapsulates sales transactions for 2024 (01/01/2024 – 30/09/2024)only, other years encapsulates sales transactions for the full year (i.e 01/01 to 31/12 of the relevant year).
€ Annual rental growth is a comparison between Q3 2023 (01/07/2023 – 30/9/2023) and Q3 2024 (01/07/2024 – 30/09/2024) house median rent figures.
¥ Bexley North market data encapsulates aggregate property conditions within the postcode of 2207.
§ Rental yields shown are as reported as of September 2024.
₳ Project development map showcases a sample of upcoming projects only, due to accuracy of addresses provided by the data provider for geocoding purposes.
£ Projects refers to the top developments within the suburbs of Bexley North, Bexley, Bardwell Park, and Bardwell Valley
µ Estimated value is the value of construction costs provided by relevant data authority, it does not reflect the project’s sale/commercial value.
ψ Commencement date quoted for each project is an approximate only, as provided by the relevant data authority, PRD does not hold any liability to the exact date.
Source: APM Pricefinder, Cordell Connect database, SQM Research, Esri ArcGIS.
Disclaimer: PRD does not give any warranty in relation to the accuracy of the information contained in this report. If you intend to rely upon the information contained herein, you must take note that the information, figures and projections have been provided by various sources and have not been verified by us. We have no belief one way or the other in relation to the accuracy of such information, figures and projections. PRD will not be liable for any loss or damage resulting from any statement, figure, calculation or any other information that you rely upon that is contained in the material.
Prepared by PRD Research. © All medians and volumes are calculated by PRD Research. Use with written permission only. All other responsibilities disclaimed. © Copyright PRD 2024.