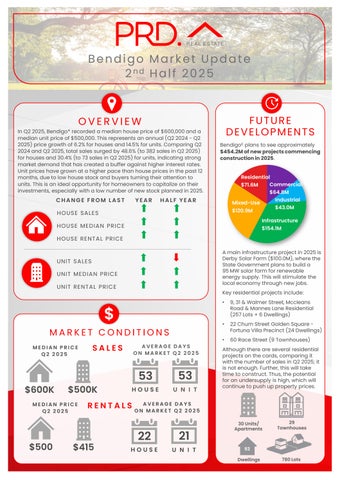

Bendigo Market Update 2nd Half 2025


HOUSE SALES YEAR HALF YEAR CHANGE FROM LAST
HOUSE MEDIAN PRICE
HOUSE RENTAL PRICE
In Q2 2025, Bendigo* recorded a median house price of $600,000and a median unit price of $500,000.This represents an annual (Q2 2024 - Q2 2025)price growth of 6.2%for houses and 14.5% for units. Comparing Q2 2024and Q2 2025,total sales surged by 48.6% (to 382sales in Q2 2025) for houses and 30.4%(to 73sales in Q2 2025)for units, indicating strong market demand that has created a buffer against higher interest rates Unit prices have grown at a higher pace than house prices in the past 12 months, due to low house stock and buyers turning their attention to units. This is an ideal opportunity for homeowners to capitalize on their investments, especially with a low number of new stock planned in 2025. 53 $600K $500K

PRICE Q2 2025
PRICE Q2 2025
AVERAGE DAYS ON MARKET Q2 2025
53
AVERAGE DAYS ON MARKET Q2 2025
Bendigo£ plans tosee approximately $454.2Mofnewprojectscommencing constructionin2025


A main infrastructure project in 2025is Derby Solar Farm ($100.0M),where the State Government plans to build a 95MWsolar farm for renewable energy supply. This will stimulate the local economy through new jobs.
Key residential projects include:
• 9, 31 & Walmer Street, Mccleans Road & Mannes Lane Residential (257 Lots + 6 Dwellings)
• 22 Chum Street Golden SquareFortuna Villa Precinct (24 Dwellings)
• 60 Race Street (9 Townhouses)
Although there are several residential projects on the cards, comparing it with the number of sales in Q2 2025; it is not enough. Further, this will take time toconstruct. Thus,the potential for an undersupply is high, which will continue to push up property prices.


AVERAGE VENDOR DISCOUNT*
Average vendor discount reflects the average percentage difference between the first list price and final sold price. A lower percentage difference (closer to 0.0%) suggests that buyers are willing to purchase close to the first asking price of a property.


Average vendor discounts between Q2 2024 and Q2 2025 have tightened to-4.3% for houses and -3.5% for units. Market conditions in Bendigo* still favours buyers, as owners are willing to accept below first listed prices. That said, average vendor discount is shifting to zero, with Q2 2025being the tightest. This suggest a shift towards the area becoming a seller’s market. Buyers must act fast.
The suburb of Bendigo has historically outperformed the wider Bendigo Local Government Area (LGA) in house and unit prices, except in 2023 (most likely as an immediate reaction to cash rate hikes in 2022). 2025#continues to see Bendigo suburb’s median house price returning to its pre2022cash rate hikes pattern of above the LGA price.
The dominant proportion of homes sold in Bendigo* in 2025# were in the middle-price bracket between $550,000 - $649,999(29.1%), followed by the more affordable price bracket of $450,000- $549,999(28.7%). Most of units sold were in the more affordable price point between $350,000 to $449,999(36.7%). Combined, this is good news for firsthome buyers. For owners, the premium house market of $750,000and above have grown to 17.8% of total sales.
MARKET COMPARISON
Bendigo (3550) House
Greater Bendigo LGA House Bendigo (3550) Unit
Greater Bendigo LGA Unit
The market comparison graph provides a comparative trend for median price of houses and units over the past 5 years. The main LGA chosen was based on their proximity to the main suburb analysed, which is Bendigo.


PRICE BREAKDOWN 2025*


than$349,999
$350,000 to $449,999
$450,000 to $549,999
$550,000 to$649,999
$650,000and above
RENTAL GROWTH 2025€
House rental yields in Bendigo¥ was 3.7% as of June 2025, higher than Bendigo LGA (3.5%) and Melbourne Metro (3.1%). This is paired with a 4.6% growth in median house rental pricein the past 12months to Q2 2025,at $500 per week, along with a -1.2% decline inthe number of houses rented (to 484 rentals in Q22025). This indicates anundersupplied and competitive house rental market in Bendigo¥, which is beneficial to investors.
2+ bedroom houses have provided investors with +7.7% rental growth annually, achieving a median rent of $420per week.
Bendigo¥ recorded a vacancy rate of 0.9% in June 2025, onpar to Bendigo LGA’s 1.0% average but much lower than Melbourne Metro’s 1.8%. Vacancy rates have decreased in the past 12 months to June 2025, indicating aneven tighter rental market. Further, a 0.9%vacancy rate is well below the Real Estate Institution of Australia’s healthy benchmark of 3.0%, thus there is quicker occupancy of rental homes in Bendigo¥. This creates a conducive environment for investors, even with a higher house and unit price (thus entry price) in the past 12months.
RENTAL VACANCY RATES 2025

Bendigo (3550) Bendigo LGA Melbourne Metro REIA 'Healthy' Benchmark

Bendigo¥

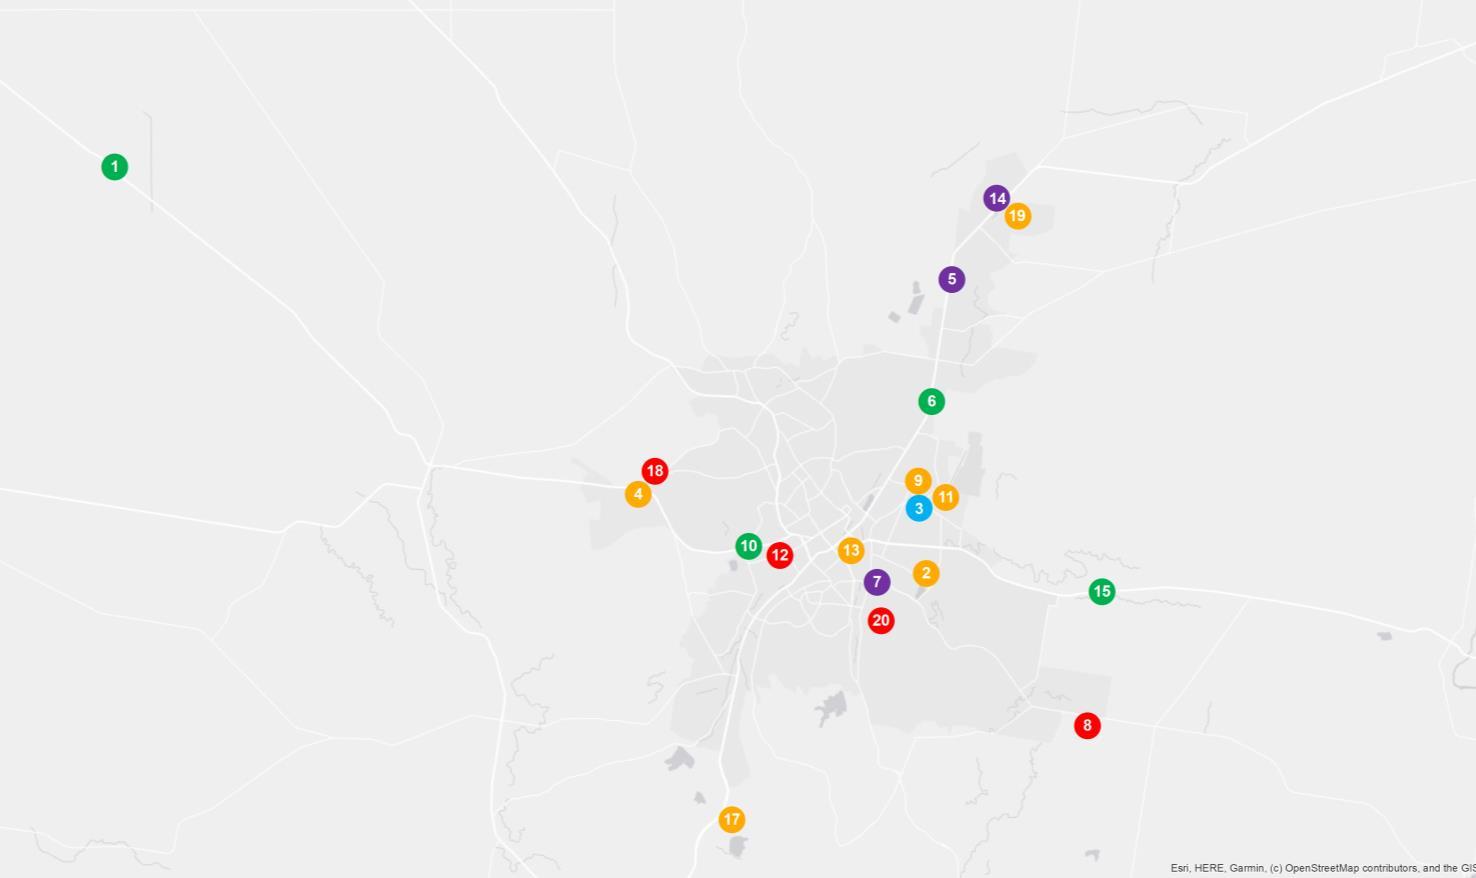
PROJECT DEVELOPMENT MAP 2025 ₳

BENDIGO


RESEARCH SERVICES
Our research services span over every suburb, LGA,and state within Australia; captured in a variety of standard and customised products, andinclude:
• Advisory and consultancy
• Market analysis including profiling and trends
• Primary qualitative and quantitative research
• Demographic and target market analysis
• Geographic information mapping
• Project analysis including product and pricing recommendations
• Rental and investment return analysis


OUR KNOWLEDGE
Access to accurate and objective research is the foundation of all good property decisions.
OUR PEOPLE
Our research team is made up of highly qualified researchers who focus solely on propertyanalysis.


REFERENCES
* Bendigo sales market data and key indicators encapsulates aggregate property market conditions in the following suburbs: Bendigo, Golden Square, Kangaroo Flat, Quarry Hill, Flora Hill, Kennington, Strathdale, Strathfieldsaye, Epsom, White Hills, and Huntly.
** Estimated values are based on construction value provided by the relevant data authority and does not reflect commercial and/or re-sale value.
# 2025 encapsulates sales transactions for 1st half 2025 (01/01/2025 – 30/06/2025) only, other years encapsulates sales transactions for the full year (i.e 01/01 to 31/12 of the relevant year).
€ Annual rental growth is a comparison between Q2 2024 (01/04/2024 – 30/06/2024) and Q2 2025 (01/04/2025 – 30/06/2025) house median rent figures.
¥ Bendigo rental market data encapsulates aggregate property conditions within the postcode of 3550, 3551, 3555 and 3556.
§ Rental yields shown are as reported as of June 2025.
₳ Project development map showcases a sample of upcoming projects only, due to accuracy of addresses provided by the data provider for geocoding purposes.
£ Projects refers to the top developments within the Greater Bendigo Local Government Area
µ Estimated value is the value of construction costs provided by relevant data authority, it does not reflect the project’s sale/commercial value.
ψ Commencement date quoted for each project is an approximate only, as provided by the relevant data authority, PRD does not hold any liability to the exact date.
Source: APM Pricefinder, Cordell Connect database, SQM Research, Esri ArcGIS.
Disclaimer: PRD does not give any warranty in relation to the accuracy of the information contained in this report. If you intend to rely upon the information contained herein, you must take note that the information, figures and projections have been provided by various sources and have not been verified by us. We have no belief one way or the other in relation to the accuracy of such information, figures and projections. PRD will not be liable for any loss or damage resulting from any statement, figure, calculation or any other information that you rely upon that is contained in the material.
Prepared by PRD Research. © All medians and volumes are calculated by PRD Research. Use with written permission only. All other responsibilities disclaimed. © Copyright PRD 2025.