Bayside Market Update 1st Half 2025


FROM LAST

In Q1 2025,Bayside* recorded a median house price of $980,000and a median unit price of $700,000.This is an annual (Q1 2024– Q1 2025) price growth of 6.9% forhouses and a softening of -5.3% for units. Comparing Q1 2024and Q1 2025,total sales decreased by -29.6% for houses (to 190 sales in Q1 2025),and by -54.0% for units (to only 29sales in Q1 2025). The undersupply of houses has created a buffer against higher interest rates, thus price growth. The slight softening in unit prices reflects the incoming stock available in the area, with less houses being available. This creates a limited opportunity for first home buyers waiting to enter the market. 38 $980K $700K

PRICE Q1 2025
AVERAGE DAYS ON MARKET Q1 2025
PRICE Q1 2025
AVERAGE DAYS ON MARKET Q1 2025
Redland City LGA plans tosee approx. $779.5Mofnewprojectscommencing constructionin2025


A key mixed use project planned in 2024is the Capalaba Town Centre Revitalisation Project ($250.0M), which will deliver an innovative landmark development to support the area's revitalization, stimulate the economy and create more local employment.
Key residential projects include:
• 219-221Bloomfield Street (52Units).
• 218-220Middle Street Apartments (46 Apartments)
• 169-193 Serpentine Creek Road & Kidd Street Subdivision (38 Lots)
At this stage, all planned projects for 2025will deliver units/apartments, townhouses and lots only, without any stand-alone dwellings planned in the pipeline. Thus, the house market will likely remain undersupplied. This will push up median house prices further and stimulate a recovery in the unit market –as house buyers turn their preferences to units.


AVERAGE VENDOR DISCOUNT*
Average vendor discount reflects the average percentage difference between the first list price and final sold price. A lower percentage difference (closer to 0.0%) suggests that buyers are willing to purchase close to the first asking price of a property.


Average vendor discounts have remained stable at -0.1% for houses buthave widened significantly to -3.2% for units in Q1 2025. Over the past 15months, house discounts have fluctuated between -0.6% and a balanced point of 0.0%, which indicates a tight market with very little discount on offer. In contrast, the unit market recorded a peak discount in Q1 2025,presenting an opportunity for first home buyers.
In the past 2years to 2025#,the suburb of MountCotton saw the highest growth in median house price, of 29.3%.This is followed by Thornlands (20.1%) and Victoria Point (13.2%). Victoria Point became the most affordable suburb in 2025# , creating an opportunity for first home buyers.
The dominant proportion of homes sold in Bayside* in 2024/25# was in the more affordable price point between $950,000to $1,049,999for houses (25.6%) and $550,000to $649,999forunits (31.5%). The premium market continue to hold strong, with 25.3%of houses sold above $1.15M and 28.8%of units above $850K. Thatsaid, the most affordable option remain available, with 23.8%of houses sold under $849,999and 4.7%of units under $549,999.This suggests there is a home for every budget in Bayside*.
MARKET COMPARISON
2024/25 #


$550,000 to $649,999
$650,000 to $749,999
$750,000 to $849,999 $850,000 and above
RENTAL GROWTH 2025€
House rental yield in Bayside¥ was 4.0%as of March 2025,higher than the Redland City LGA (3.6%) and Brisbane Metro (3.2%). This was paired with a 4.3%increase in median house rental price in the past 12 months,at $720per week, along with a -19.1% decrease in the number of housed rented (to 123houses in Q1 2025). Average day on the market has declined, by -25.0%, to a historical low level of 15 days in Q1 2025.This confirms there is an undersupplied and competitive house rental market in Bayside¥, which is beneficial to investors.
4+ bedroom houses have provided investors with +12.3%rental growth annually, achieving a median rent of $730per week.
Bayside¥ recorded a vacancy rate of 06%in March2025, below the Redland City LGA (1.1%) and Brisbane Metro (0.9%). Vacancy rates have shown a decreasing trend in the past 12months, indicating an even tighter rental market. Further, a 0.6%vacancy rate is well below the Real Estate Institute of Australia’s healthy benchmark of 3.0%. This suggests quicker occupancy of rental homes, thus a conducive environment for investors, even with a higher entry price.
RENTAL VACANCY RATES 2025


Bayside¥

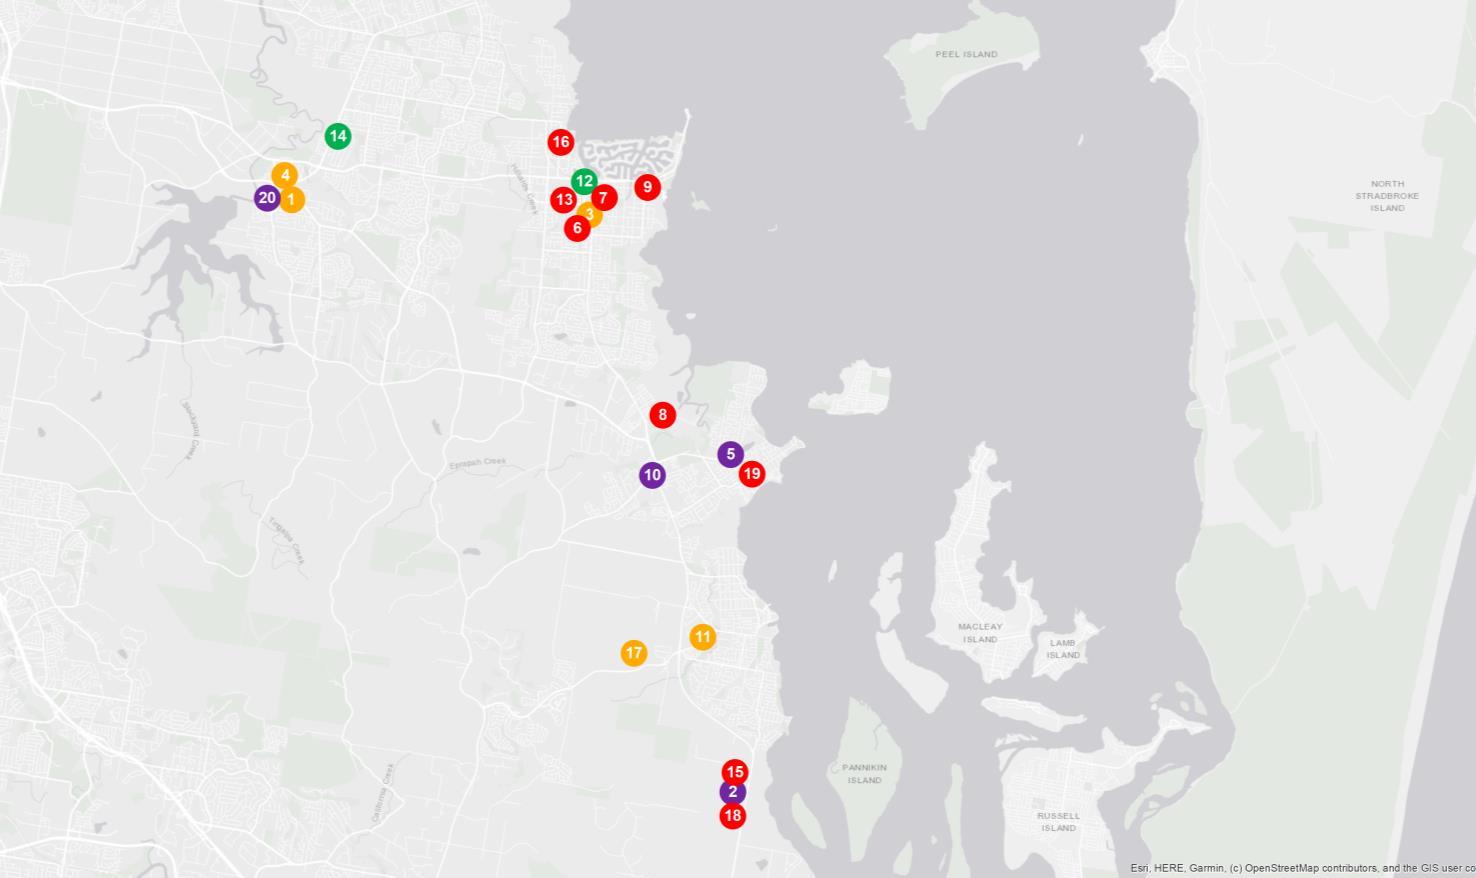
PROJECT DEVELOPMENT MAP 2025 ₳


RESEARCH SERVICES
Our research services span over every suburb, LGA,and state within Australia; captured in a variety of standard and customised products, andinclude:
• Advisory and consultancy
• Market analysis including profiling and trends
• Primary qualitative and quantitative research
• Demographic and target market analysis
• Geographic information mapping
• Project analysis including product and pricing recommendations
• Rental and investment return analysis
OUR KNOWLEDGE
Access to accurate and objective research is the foundation of all good property decisions.
OUR PEOPLE
Our research team is made up of highly qualified researchers who focus solely on propertyanalysis.


REFERENCES
* Bayside sales market data and key indicators encapsulates aggregate property market conditions within the suburbs of Mount Cotton, Redland Bay, Thornlands and Victoria Point.
** Estimated values are based on construction value provided by the relevant data authority and does not reflect commercial and/or re-sale value.
# 2025 encapsulates sales transactions for Q1 2025 (01/01/2025 – 31/03/2025) only, other years encapsulates sales transactions for the full year (i.e 01/01 to 31/12 of the relevant year).
€ Annual rental growth is a comparison between Q1 2024 (01/01/2024 – 31/03/2024) and Q1 2025 (01/01/2025 – 31/03/2025) house median rent figures.
¥ Bayside rental market data encapsulates aggregate property conditions within the postcode of 4165.
§ Rental yields shown are as reported as of March 2025.
₳ Project development map showcases a sample of upcoming projects only, due to accuracy of addresses provided by the data provider for geocoding purposes.
£ Projects refers to the top developments within the Redland City Local Government Area.
µ Estimated value is the value of construction costs provided by relevant data authority, it does not reflect the project’s sale/commercial value.
ψ Commencement date quoted for each project is an approximate only, as provided by the relevant data authority, PRD does not hold any liability to the exact date.
Source: APM Pricefinder, Cordell Connect database, SQM Research, Esri ArcGIS.
Disclaimer: PRD does not give any warranty in relation to the accuracy of the information contained in this report. If you intend to rely upon the information contained herein, you must take note that the information, figures and projections have been provided by various sources and have not been verified by us. We have no belief one way or the other in relation to the accuracy of such information, figures and projections. PRD will not be liable for any loss or damage resulting from any statement, figure, calculation or any other information that you rely upon that is contained in the material.
Prepared by PRD Research. © All medians and volumes are calculated by PRD Research. Use with written permission only. All other responsibilities disclaimed. © Copyright PRD 2025.