
Albury Market Update 2nd Half 2024


YEAR HALF YEAR CHANGE FROM LAST
HOUSE SALES
HOUSE MEDIAN PRICE
HOUSE RENTAL PRICE
LAND SALES
LAND MEDIAN PRICE

MEDIAN PRICE Q2 2024
In Q2 2024, Albury* (postcodes 2640 and 2641) recorded a median house price of $575,000and a medianland price of $425,000.This represents annual (Q2 2023– Q2 2024)growth of 1.8% for houses and 58.3%for vacantland. Comparing Q2 2023vs Q2 2024house sales has increased, by 6.3% (to 269 sales in Q2 2024), while vacant land sales declined by-68.3% (to only 19sales in Q2 2024). This confirms there is strong demand for houses and a clear undersupply of land, which has created a buffer against higher interest rates– hence price growth for both houses and land. TheAlbury* market on a growth trajectory, thus an ideal opportunity for owners to capitalize on their investments. 71
$575k $425K
MEDIAN PRICE Q2 2024
AVERAGE DAYS ON MARKET Q2 2024
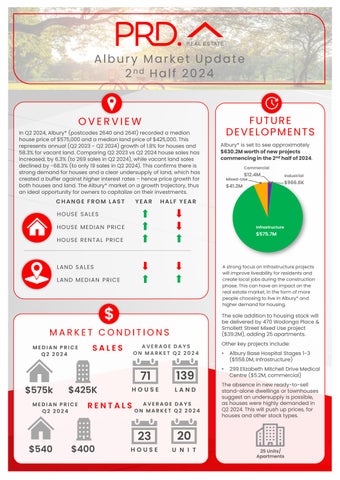
Albury* is set to see approximately $630.2Mworthofnewprojects commencinginthe2nd halfof2024


Astrongfocuson infrastructureprojects will improve liveability for residentsand createlocal jobsduringthe construction phase.Thiscan have an impacton the real estatemarket,in the form of more people choosingto live in Albury*and higherdemandfor housing.
The sole addition to housing stock will be delivered by 470Wodonga Place & Smollett Street Mixed Use project ($39.2M), adding 25 apartments.
Other key projects include:
• Albury Base Hospital Stages 1-3 ($558.0M,Infrastructure)
• 299Elizabeth Mitchell Drive Medical Centre ($5.2M,commercial)
AVERAGE DAYS ON MARKET Q2 2024
The absence in new ready-to-sell stand-alone dwellings ortownhouses suggest an undersupply is possible, as houses were highly demanded in Q2 2024.This will push up prices, for houses and other stock types


Average vendor discount reflects the average percentage difference between the first list price and final sold price. A lower percentage difference (closer to 0.0%) suggests that buyers are willing to purchase close to the first asking price of a property.


Average vendor discounts between Q1 2023and Q2 2024 have tightened to -3.8% for houses and to -6.8% forunits. While peak discounts have passed (houses in Q1 2023and units in Q2 2023), current discounts remain attractive to buyers, especially given tothe undersupply and highly demanded market. Thatsaid, a tighter vendor discount also suggest that the market is starting toshift towards a seller’s market. Buyers looking fora discount must actfast.
The suburb of Albury has historically outperformed the wider Albury Local Government Area (LGA) in house and land prices. This continued in 2024#, despite slower growth in Albury’s median unit price.
The dominant proportion of homes sold in Albury* across 2024# were in the premium price range of above $700,000 (29.9%). Mostof the vacantland sold were in the more affordable price-range point between $350,000-$449,999 (35.0%). The most affordable price are still available, with 11.3%of houses sold at less than $399,999and 15.0% of land sold at less than$249,999.This suggests an opportunity for first-time buyers looking for affordable options. Overall, there is a home for every budget in Albury*.
COMPARISON PRICE BREAKDOWN 2024 #
and above The market comparison graph provides a comparative trend for the median price of houses and unit over the past 5 years. The suburb chosen was based on their proximity to the main LGA analysed, which is Albury.


to $549,999
RENTAL GROWTH 2024€
House rental yields in Albury¥ was 3.8%as of June 2024,higher thanSydney Metro (2.8%).This was paired with a 25.0% surge in median house rental price in the past 12months, currently at $540per week in Q2 2024. Between Q2 2023 vs Q2 2024the number ofhouses rented declined by -25.0%, to its lowest level of 15rentals in Q2 2024. The unit market had the same pattern, which suggests an undersupplied and tight rental market. This is good news for investors.
3- bedroom houses have provided investors with +14.9% rental growth annually, achieving a median rent of $540per week.
Albury¥ recorded a vacancy rate of 1.2%in June 2024, on par with the Albury LGA’s 1.1% average but below Sydney Metro’s 1.7%. Vacancy rates decreased during the past 12months in Albury¥ , even with slight fluctuations due to investors entering/exiting the market. Further, a 1.2%figure is well below the Real Estate Institute of Australia’s healthy benchmark of 3.0%, which suggests quicker occupancy of rental properties. This suggests a conducive environment for investors, despite the increase in median house sale prices in the past 12 months to Q2 2024.
RENTAL VACANCY RATES 2024

RENTAL


RESEARCH SERVICES
Our research services span over every suburb, LGA,and state within Australia; captured in a variety of standard and customised products, andinclude:
• Advisory and consultancy
• Market analysis including profiling and trends
• Primary qualitative and quantitative research
• Demographic and target market analysis
• Geographic information mapping
• Project analysis including product and pricing recommendations
• Rental and investment return analysis
OUR KNOWLEDGE
Access to accurate and objective research is the foundation of all good property decisions.
OUR PEOPLE
Our research team is made up of highly qualified researchers who focus solely on propertyanalysis.


REFERENCES
* Albury sales market data and key indicators encapsulates aggregate property market conditions within the postcodes 2640 and 2641.
** Estimated values are based on construction value provided by the relevant data authority and does not reflect commercial and/or re-sale value.
# 2024 encapsulates sales transactions for 1stHalf2024(01/01/2024 – 30/06/2024) only, other years encapsulated sales transactions for the full year (i.e 01/01/ to 31/12 of the relevant year).
€ Annual rental growth is a comparison between Q2 2023 (01/04/2023 – 30/06/2023)and Q2 2024 (01/04/2024 – 30/06/2024) house median rent figures.
¥ Albury rental market data encapsulates aggregate property conditions within the postcode of 2640.
§ Rental yields shown are as reported as of June 2024.
₳ Project development map showcases a sample of upcoming projects only, due to accuracy of addresses provided by the data provider for geocoding purposes.
£ Projects refers to the top developments within the postcodes of 2640 and 2641.
µ Estimated value is the value of construction costs provided by relevant data authority, it does not reflect the project’s sale/commercial value.
ψ Commencement date quoted for each project is an approximate only, as provided by the relevant data authority, PRD does not hold any liability to the exact date.
Source: APM Pricefinder, Cordell Connect database, SQM Research, Esri ArcGIS.
Disclaimer: PRD does not give any warranty in relation to the accuracy of the information contained in this report. If you intend to rely upon the information contained herein, you must take note that the information, figures and projections have been provided by various sources and have not been verified by us. We have no belief one way or the other in relation to the accuracy of such information, figures and projections. PRD will not be liable for any loss or damage resulting from any statement, figure, calculation or any other information that you rely upon that is contained in the material.
Prepared by PRD Research. © All medians and volumes are calculated by PRD Research. Use with written permission only. All other responsibilities disclaimed. © Copyright PRD 2024.
